3D Ultrasound Market Overview
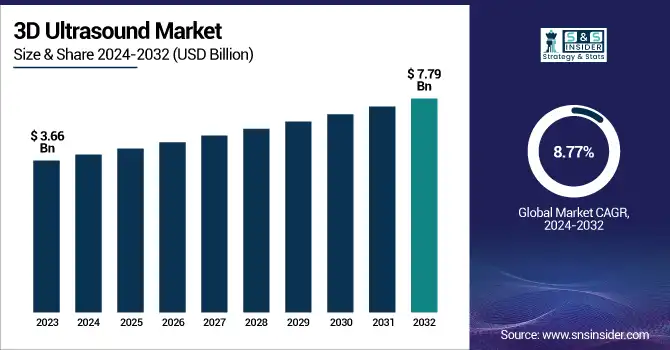
The 3D Ultrasound Market was valued at USD 3.66 billion in 2023 and is projected to reach USD 7.79 billion by 2032, growing at a CAGR of 8.77% from 2024 to 2032.
To Get more information on 3D Ultrasound Market - Request Free Sample Report
In this report, thorough research is conducted on cost analysis and pricing trends of 3D ultrasound equipment across both developed and developing markets globally. The report showcases the fast adoption of advanced imaging technologies including wireless handheld devices and AI-powered 3D imaging. It also explores regulatory frameworks and compliance statistics diagnostic imaging equipment globally. The report covers in-depth data on healthcare infrastructure development, including the surging number of hospital expansions and diagnostic imaging centers globally. Trends in regional disparities and reimbursement policies in technology access are also studied. Overall, the report also provides a data-driven outlook to support strategic decision-making.
U.S. 3D Ultrasound Market Size & Forecast
In 2023, the U.S. held the dominant share in the 3D ultrasound market in 2023. The market was valued at USD 0.65 Billion and is expected to reach a valuation of USD 1.45 Billion by 2032 expanding at a CAGR of 9.37% during 2024-2032. This dominance is driven by the country’s highly developed healthcare infrastructure, early adoption of advanced diagnostic technology, and strong presence of leading medical device producers. The surging chronic diseases’ prevalence and complications related to pregnancy has raised the demand for real-time and accurate imaging solutions including 3D ultrasound.
In addition, favorable reimbursement policies imposed by governments, along with growth in healthcare spending and government support for medical innovation further drives the market growth in the U.S. The growing incorporation of AI in ultrasound systems and the surging number of diagnostic imaging centers also drives to the 3D ultrasound market growth in the U.S. significantly.
3D Ultrasound Market Dynamics
Drivers
-
Surging Real-Time 3d Imaging Adoption for Prenatal and Cardiovascular Diagnostics Drives Market Expansion
One of the leading driving factors for the 3D ultrasound market growth is the rising demand for detailed and real-time imaging, specifically in the cardiovascular diagnostics and prenatal care. Healthcare providers largely prefer 3D ultrasounds for getting clear fetal imaging, better pregnancy monitoring, and early detection of anomaly. The market’s growth is also driven by rising need for accurate cardiac imaging technologies to detect valve issues, heart defects, and several other conditions, which further boosted the demand for 3D imaging tools. These systems provide more advantages than traditional 2D imaging by offering volumetric views that enhance diagnostic accuracy.
In addition, growing enhancements in image processing software, user-friendly interfaces, and portability, are boosting the adoption among hospitals and clinics. The surging chronic conditions prevalence and awareness related to maternal health, particularly in the developed regions, such as Europe and North America, further strengthens the use of 3D ultrasound systems in the clinical settings.
Restraints:
-
Limited Accessibility in Low-Income Regions Restrain the Adoption of 3D Ultrasound Technologies
Despite rising technological advancements, high 3D ultrasound systems’ upfront costs, remains a significant restraint hampering the market expansion, particularly in the rural and lower-income regions. The 3D ultrasound imaging systems require significant capital investment, which makes them less accessible to small clinics, along with primary care facilities in the developing economies. Furthermore, ongoing software updates, maintenance, and the growing need for specialized personnel to smoothly operate equipment drives the increased operational costs.
In several emerging economies, the healthcare budgets are limited, and basic diagnostic tools are still highly used over the advanced imaging modalities. Reimbursement challenges several countries also hamper the product adoption, as insurance policies may not cover 3D ultrasound procedures fully. This cost restraint generates a technological divide and reduces the potential reach of 3D ultrasound technology globally, further preventing uniform healthcare access and hinder market expansion in the under-developed regions.
Opportunities in the 3D Ultrasound Market
-
Growing AI Integration and Portable Ultrasound Devices Generates Better Growth Opportunities
The increasing incorporation of artificial intelligence (AI) and the growing emergence of portable 3D ultrasound devices, are showcasing promising opportunities for the market expansion. AI-driven imaging platforms help in improving diagnostic accuracy, support automate measurements, and offer clinical decision-making, making ultrasound interpretation more consistent and faster. The increasing trend toward wireless technology and miniaturization also led to the development of compact 3D ultrasound and handheld systems, raising access to point-of-care diagnostics in both resource-limited and remote settings. These innovations are particularly useful in ambulatory care, emergency medicine, and telemedicine, where rapid imaging is a critical aspect.
In addition, healthcare providers are heavily investing in simulation tools and AI-enabled training and simulation tools to bridging the skill gap, further allowing broader use of 3D ultrasound in general practice. As the global healthcare systems shift toward home-based diagnostics and decentralized care, the demand for portable, smart, and affordable imaging tools is projected to increase substantially driving market growth.
Challenges:
-
Skilled Sonographers’ Shortage and Lack of Technological Training Propel Market Growth
A key challenge experienced by the 3D ultrasound market is the lack of adequate training to operate on advanced imaging systems and shortage of skilled sonographers globally. Unlike traditional 2D ultrasound, the 3D ultrasound imaging requires specialized knowledge for the purpose of managing the volumetric data, utilize enhanced software functions, and interpret complex scans. In several regions, particularly in the developing nations, the healthcare professionals might not receive proper hands-on training to use these advanced technologies effectively. This flaw in expertise can lead to misdiagnosis, underutilization of equipment, and reliance on the outdated methods.
Additionally, the rapid advancements in technologies for ultrasound systems require consistent adaptation and learning that is widely overlooked due to the time constraints in the clinical workflows and limited support from institutions. To address this challenge, strategic investment is required for training programs, designing user-friendly systems, and setting certified standards, which decrease the learning curve along with maintaining accuracy of diagnostics.
3D Ultrasound Market Segmentation Analysis
By Product
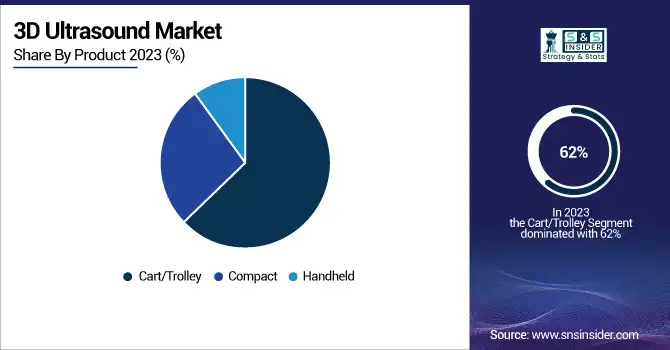
Under product, in 2023, the cart/trolley segment held the largest 3D ultrasound market share of approximately 62% due to their ability of providing high resolution imaging solutions, along with multiple transducers, and advanced features for different applications including obstacles, obstetrics, cardiology, gen, and gynecology. The high performance of carts/trolleys of handling a larger number of patients makes them an ideal comprehensive diagnostics solution. Although, the cart-based systems are widely preferred in the imaging centers or hospitals as they are more ergonomic and can easily move within the clinical environment, and incorporate with the electronic health record (EHR) systems. Moreover, due to increased demand for detailed imaging combined with technological innovations & their evolution over time in providing effective & efficient imaging solutions coupled with a broader spectrum of applications.
By Application
On the basis of application, the obstetrics and gynecology led the market in 2023 by holding a revenue share of approximately 32.45%. the segment’s growth is driven by the advanced fetal and reproductive health imaging demand globally. The 3D ultrasound technology plays a vital role in monitoring fetal development, assessing placental health, and detect congenital anomalies, and also guiding prenatal procedures with larger precision than traditional 2D imaging. Healthcare providers and pregnant women increasingly adopt 3D ultrasounds for their ability to offer real-time and clearer images of the fetus, further improving both patient experience and clinical accuracy.
Additionally, the increasing number of pregnancies, along with surging awareness of fetal and mental health, and the growing adoption of regular prenatal checkups, particularly in the developed regions, have substantially boosted the dominance of this segment. The growing incorporation of AI and mobile platforms in OB/GYN practices further propels the wide utilization of 3D ultrasound systems, further boosting the segment’s growth in the market.
By End-Use
By end-use, the market was dominated by the hospitals segment, which held the largest share of approximately 45% in 2023. This growth is propelling due to their wide-ranging diagnostic infrastructure, high financial backup for investments in advanced imaging technologies, and a large patient footfall. These institutions generally require high-performance and versatile ultrasound systems, which are capable of supporting a large range of clinical applications, such as obstetrics and gynecology, cardiology, urology, and emergency care. The hospitals are also benefited from skilled radiologists, sonographers, and well-established IT infrastructure, which allows for the systems’ effective use and incorporation of 3D ultrasound systems into the electronic health records (EHRs) and clinical workflows.
Additionally, hospitals also receive reimbursement support or government funding, particularly in the developed nations that facilitates the augmenting adoption of the state-of-the-art imaging tools. The surging need for fast, accurate, and non-invasive diagnostics in both outpatient and inpatient settings further bolsters the role of hospitals as the initial end-user, further safeguarding their dominant position in the global market.
3D Ultrasound Market Regional Insights
In 2023, North America dominated the market and held a revenue share of around 41%. The region’s growth is propelled by its advanced healthcare infrastructure, presence of key industry players, and high cutting-edge medical technologies adoption rates, and strong presence of key industry players. The region, particularly the U.S., is benefited from a strong healthcare system, wide insurance coverage, and promising reimbursement policies, which facilitate the widespread utilization of 3D ultrasound systems.
Additionally, North America is also dominating in terms of research and development, boosting innovation in imaging technology including AI-powered ultrasound and portable devices that improves diagnostic capabilities. The increasing prevalence of chronic diseases, maternal health concerns, and the growing demand for non-invasive diagnostic tools also contribute to the region's market dominance. Furthermore, well-established healthcare facilities and diagnostic imaging centers in North America are equipped with the latest ultrasound systems, further solidifying the region's leadership in the global market.
Asia Pacific witnessed significant growth in the market. The growth is attributed to the factors, such as rapid development in healthcare infrastructure, growing investments in healthcare, and augmenting demand for advanced diagnostic technologies. Asia Pacific has witnessed substantial improvements in medical facilities and access to healthcare, particularly in countries, such as Japan, India, and China, where the focus on modernizing healthcare systems. Furthermore, the surging awareness related to fetal and maternal health, integrated with a surging number of health screenings and pregnancies, which drove the demand for 3D ultrasound technology. Ultrasound devices’ portability and affordability, along with several government initiatives to improve healthcare access, have also contributed to the region’s growth. Moreover, the surging prevalence of chronic diseases and cardiovascular conditions in Asia Pacific further propels adoption of 3D ultrasound systems for accurate and early diagnostics. These factors collectively make Asia Pacific a major region in the 3D ultrasound market.

Get Customized Report as per Your Business Requirement - Enquiry Now
Key Players in the 3D Ultrasound Market
-
GE Healthcare (Logiq E10, Voluson E10)
-
Philips Healthcare (Affiniti 70, EPIQ 7)
-
Canon (Aplio i800, Xario 200)
-
Hitachi (HI VISION Avius, ARIETTA 70)
-
Siemens (Acuson SC2000, Acuson S2000)
-
Fujifilm (Sonosite Edge II, Sonosite M-Turbo)
-
Royal Philips (Affiniti 50, EPIQ 5)
-
Alpinion Medical Systems Co. Ltd. (E-Cube 12, E-Cube 15)
-
Analogic Corp. (BK Ultrasound 3000, Pro Focus 2202)
-
Esaote S.P.A. (MyLab X8, MyLab 60)
-
General Electric (Voluson 730, Logiq P9)
-
Koninklijke Philips N.V. (ClearVue 650, Sparq Ultrasound System)
-
Samsung Medison Co. Ltd. (UGEO PT60A, UGEO X8)
-
Shenzhen Mindray Bio-Medical Electronics Co. Ltd. (Resona 7, DC-70)
-
Toshiba Medical Systems Corporation (Aplio 500, Xario 100)
-
Carestream Health (Touch Ultrasound, Carestream 2100 Ultrasound)
-
Samsung Electronics Co., Ltd. (UGEO PT60A, UGEO X8)
-
SonoScape Medical Corp. (S9 Ultrasound, A6 Ultrasound)
-
Chison Medical Imaging Co. Ltd. (Q9 Ultrasound, ECO5 Ultrasound)
-
Mindray (Resona 7, DC-70)
Recent Developments in the 3D Ultrasound Market
-
In 2023, GE HealthCare introduced the Venue Family point-of-care ultrasound systems, featuring Caption Guidance, an AI-driven technology that offers real-time guidance for capturing high-quality cardiac images. This innovation aims to enhance accessibility to cardiac exams by enabling a wider range of healthcare providers to perform scans with AI-assisted guidance.
-
In 2023, Esaote launched the MyLab™X90 ultrasound device, integrating high-quality imaging with artificial intelligence to improve workflow efficiency in advanced healthcare settings. The device features premium components like the XCrystal probe family and a dual-layer eLed monitor, enhancing image clarity and user experience.
| Report Attributes | Details |
|---|---|
| Market Size in 2023 | USD 3.66 Billion |
| Market Size by 2032 | USD7.79Billion |
| CAGR | CAGR of8.77 % From 2024 to 2032 |
| Base Year | 2023 |
| Forecast Period | 2024-2032 |
| Historical Data | 2020-2022 |
| Report Scope & Coverage | Market Size, Segments Analysis, Competitive Landscape, Regional Analysis, DROC & SWOT Analysis, Forecast Outlook |
| Key Segments | •By Product (Handheld, Compact, Cart/Trolley) • By Application (General Imaging, Cardiology, Obstetrics and Gynecology, Urology, Others) • By End-Use (Hospitals, Diagnostic Imaging Centers, Others) |
| Regional Analysis/Coverage | North America (US, Canada, Mexico), Europe (Eastern Europe [Poland, Romania, Hungary, Turkey, Rest of Eastern Europe] Western Europe] Germany, France, UK, Italy, Spain, Netherlands, Switzerland, Austria, Rest of Western Europe]), Asia Pacific (China, India, Japan, South Korea, Vietnam, Singapore, Australia, Rest of Asia Pacific), Middle East & Africa (Middle East [UAE, Egypt, Saudi Arabia, Qatar, Rest of Middle East], Africa [Nigeria, South Africa, Rest of Africa], Latin America (Brazil, Argentina, Colombia, Rest of Latin America) |
| Company Profiles | GE Healthcare, Philips Healthcare, Canon, Hitachi, Siemens, Fujifilm, Royal Philips, Alpinion Medical Systems Co. Ltd., Analogic Corp., Esaote S.P.A., General Electric, Koninklijke Philips N.V., Samsung Medison Co. Ltd., Shenzhen Mindray Bio-Medical Electronics Co. Ltd., Toshiba Medical Systems Corporation, Carestream Health, Samsung Electronics Co., Ltd., SonoScape Medical Corp., Chison Medical Imaging Co. Ltd., Mindray |
Frequently Asked Questions
Ans: North America led the 3D Ultrasound Market in the region with the highest revenue share in 2023.
Ans: Rising adoption of real-time 3d imaging for prenatal and cardiovascular diagnostics boosts the 3d ultrasound market growth.
Ans: Cart/Trolley type will grow rapidly in the 3D Ultrasound Market from 2024-2032.
Ans: The expected CAGR of the global 3D Ultrasound Market during the forecast period is 8.77%
Ans: The 3D Ultrasound Market was valued at USD 3.66 Billion in 2023.
Get in Touch
