3D Animation Market Size & Overview:
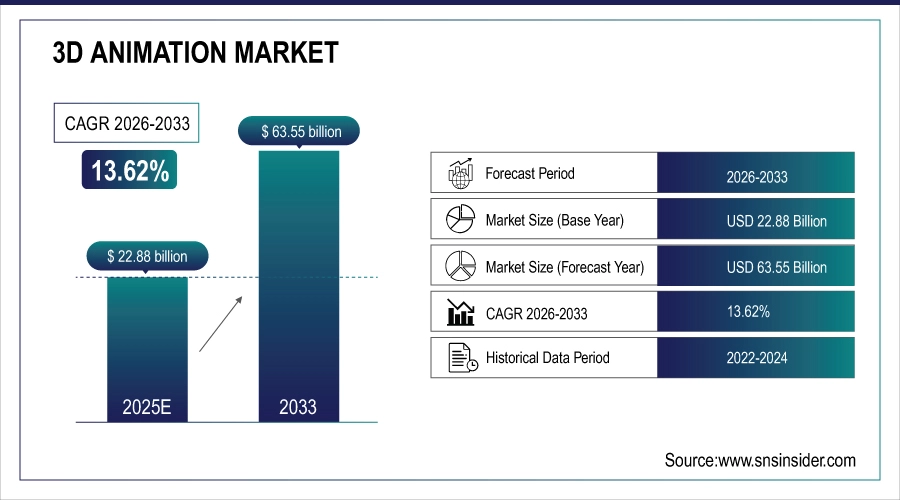
The 3D Animation Market was valued at USD 22.88 billion in 2025E and is expected to reach USD 63.55 billion by 2033, growing at a CAGR of 13.62% from 2026-2033.
The 3D animation market has witnessed substantial growth in recent years, driven by technological advancements and rising demand across various industries. This growth is particularly evident in the entertainment sector, where 3D animation has transformed filmmaking and television, enhancing visual storytelling and offering more immersive experiences for viewers. As a result, computer-generated animation now makes up 85% of the market, with animated films achieving a 30% higher profit margin than their non-animated counterparts, underscoring the lucrative potential of 3D animation.
3D Animation Market Size and Forecast:
-
Market Size in 2025E: USD 22.88 Billion
-
Market Size by 2033: USD 63.55 Billion
-
CAGR: 13.62% from 2026 to 2033
-
Base Year: 2025
-
Forecast Period: 2026–2033
-
Historical Data: 2022–2024
Get more information on 3D Animation Market- Request Free Sample Report
This profitability is further fueled by the gaming industry, where the demand for dynamic, realistic graphics has led to greater adoption of 3D animation technologies, enabling the creation of detailed virtual environments. 61% of the U.S. population plays video games for at least one hour weekly, contributing to the USD 57 billion total consumer spending on video games in 2023. Building on these developments, the rise of virtual reality (VR) and augmented reality (AR) applications has created new opportunities for 3D animation, with sectors such as education, healthcare, and training increasingly utilizing these technologies for interactive simulations and experiences.
Key trends in the 3D Animation Market:
-
Rising demand for high-quality visual content across film, television, gaming, and OTT streaming platforms.
-
Increasing adoption of 3D animation in advertising, marketing, and brand storytelling to enhance customer engagement.
-
Growing use of real-time 3D animation and rendering technologies in gaming engines and virtual production.
-
Rapid expansion of animation usage in AR/VR, metaverse environments, and immersive digital experiences.
-
Increased application of 3D animation in education, healthcare visualization, architecture, and industrial simulation.
-
Strong demand for cloud-based animation tools and collaborative production pipelines enabling remote workflows.
-
Higher investment in AI-driven animation, motion capture, and automation tools to reduce production time and costs.
-
Strategic partnerships and acquisitions among animation studios, software providers, and cloud service companies to enhance capabilities and global reach.
Recently, several leading animation and VFX studios announced expanded adoption of real-time 3D animation pipelines using advanced game engines and AI-assisted rendering tools to accelerate content production for films, episodic series, and interactive media. These advancements are enabling faster turnaround times, improved realism, and cost-efficient large-scale animation projects.
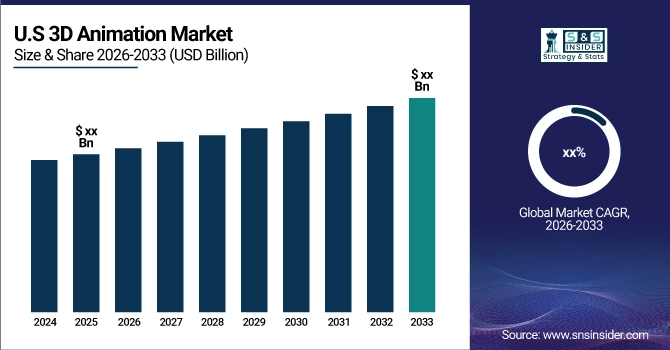
The U.S. 3D Animation Market size was estimated at approximately USD 9.6 billion in 2025 and is projected to reach around USD 28.5 billion by 2033, growing at an estimated CAGR of about 14.5%. Growth is driven by increasing demand from the entertainment and gaming industries, rising investments in immersive technologies such as AR/VR, and strong adoption of 3D animation in advertising, education, and enterprise visualization. The presence of major animation studios, technology providers, and a mature digital content ecosystem further supports market expansion in the United States.
3D Animation Market Drivers
- Rising Demand for 3D Animation Market in Entertainment, Media, and Emerging Technologies
The demand for 3D animation is surging across various segments of the entertainment and media industries. In film and television, studios increasingly rely on 3D animation for blockbuster movies, TV shows, and special effects to create visually captivating and immersive experiences that draw in worldwide audiences. Animated films, in particular, have gained significant popularity, with advanced 3D techniques being used to push the boundaries of visual storytelling. Additionally, the video game industry’s rapid growth is a major driver of 3D animation, as games demand more complex, lifelike characters, dynamic environments, and realistic animations. Content such as animation, VFX, and games are increasingly distributed via OTT streaming services like Netflix, Amazon Prime, YouTube, Twitter, and Facebook. Furthermore, Meta’s recent partnership with James Cameron’s Lightstorm Vision on December 6, 2024, to create 3D content for Meta Quest is set to accelerate the demand for innovative 3D content, including live sports and films. As these industries continue to evolve, 3D animation plays an ever-expanding role in shaping modern media and entertainment experiences.
- Technological Advancements Fueling the Growth of the 3D Animation Market
Technological advancements are significantly driving the 3D animation market by enhancing both accessibility and efficiency. The availability of advanced animation software and tools, such as Autodesk Maya, Blender, and Cinema 4D, has made 3D animation more accessible to both large studios and smaller businesses, offering powerful features at affordable prices. Additionally, Artificial Intelligence (AI) and Machine Learning are optimizing animation workflows by automating tasks like motion capture, facial expressions, and rendering, thereby reducing production time and costs. On December 4, 2024, World Labs introduced a new AI system capable of generating interactive 3D environments from 2D images, further revolutionizing the industry. Cloud computing also provides scalable platforms, enabling smaller studios and individual creators to perform complex rendering tasks without heavy hardware investments. These innovations are transforming animation production across industries.
3D Animation Market Restraints
- High Production Costs Pose a Significant Barrier to the Widespread Adoption of the 3D Animation Market in Various Industries
Creating high-quality 3D animation requires substantial investment in various resources, making it a challenge for smaller studios to compete. For standard projects, the cost can range between USD 5,000 and USD 10,000 per minute of animation. More intricate projects may cost between USD 10,000 and USD 15,000 per minute, while top-tier animations can exceed USD 15,000 per minute. These costs include skilled labor, software licenses, and powerful computing resources. Detailed and realistic animations demand significant time and effort, driving up production expenses. For many smaller studios and independent creators, these high costs can be prohibitive, limiting their ability to produce competitive, high-quality content. This financial barrier restricts the widespread adoption of 3D animation, particularly in regions or industries with tighter budgets.
3D Animation Market Segmentation Analysis:
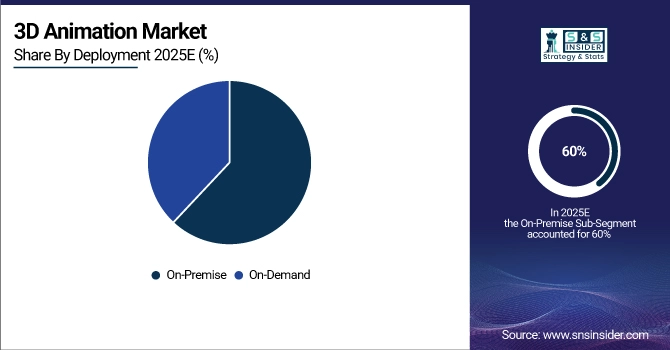
By Deployment, On-Premise Deployment Leads Market Share While On-Demand Solutions Show Rapid Growth
In 2025, the On-Premise segment dominated the 3D animation market with the highest revenue share of around 60%. This is primarily due to its ability to offer greater control, security, and performance. Industries like film production and gaming require robust infrastructure for handling large-scale rendering and animation processes. On-premise solutions allow companies to maintain high-quality standards while safeguarding sensitive data, making them the preferred choice for many.
The On-Demand segment is expected to grow at the fastest CAGR of 14.29% from 2026 to 2033. This growth is driven by the increasing need for flexible, cost-effective solutions that scale with demand. On-demand platforms reduce the need for expensive upfront investments in hardware, making them ideal for smaller studios and remote teams. The shift towards cloud-based services and collaborative workflows is fueling the rapid adoption of on-demand 3D animation solutions.
By Organization Size, Large Enterprises Dominate Adoption as SMEs Drive Future Market Expansion
In 2025, the Large Enterprises segment dominated the 3D animation market , capturing about 61% of the revenue share. This is due to the substantial budgets and resources available to large companies, enabling them to invest in cutting-edge 3D animation technologies. Industries such as entertainment, gaming, and manufacturing rely on high-quality, complex animations for diverse applications. These enterprises’ need for premium solutions continues to drive demand in the market.
The Small and Medium-sized Enterprises (SMEs) segment is projected to grow at the fastest CAGR of 14.41% from 2026 to 2033. This growth is fueled by the increasing availability of affordable, cloud-based animation tools that reduce capital investment. SMEs can now access high-quality animation solutions for content creation and marketing without heavy upfront costs. This shift toward scalable, cost-effective solutions is driving the segment’s rapid expansion.
By Technique, 3D Modeling Holds Largest Share; Visual Effects (VFX) to Experience Fastest Growth
In 2025, the 3D Modeling segment dominated the 3D animation market, capturing approximately 34% of the revenue share. This is primarily due to its essential role in creating the foundational structures for 3D animations across industries such as film, gaming, and architecture. 3D modeling is critical for developing lifelike characters, environments, and objects, making it a core component of the animation production process, which drives its significant market share.
The Visual Effects (VFX) segment, however, is projected to grow at the fastest CAGR of 14.84% from 2026 to 2033. This growth is driven by the increasing demand for more immersive, realistic content in films, television, and video games. As technologies advance and consumer expectations rise, the need for high-quality VFX to enhance storytelling and visual experiences is accelerating, making it a key driver for the industry's expansion over the coming years.
By End Use, Media & Entertainment Emerges as the Leading and Fastest-Growing End-Use Segment
The Media and Entertainment segment dominated the 3D animation market with the highest revenue share of about 36% in 2025 and is expected to grow at the fastest CAGR of about 14.61% from 2026 to 2033. This dominance is driven by the growing demand for high-quality animated content across films, television, and digital platforms. 3D animation plays a crucial role in enhancing visual storytelling, especially with the rise of immersive and interactive content in the entertainment industry. The rapid expansion of streaming services, coupled with the increasing popularity of animated films and TV shows, further fuels the demand. Additionally, the integration of technologies like virtual reality (VR) and augmented reality (AR) in entertainment is expected to significantly contribute to the market's growth, offering more engaging and innovative experiences for audiences.
3D Animation Market Regional Insights
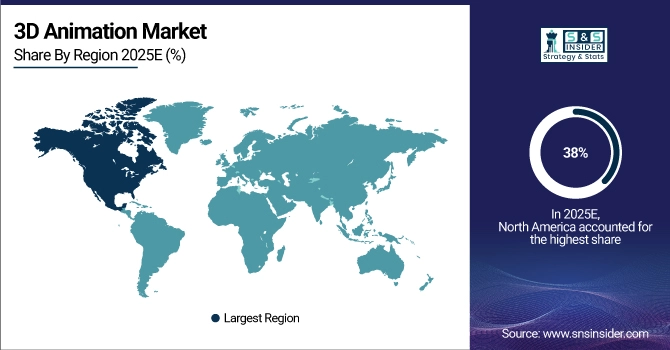
North America Dominates the 3D Animation Market in 2025E
In 2025E, North America commands an estimated 38% share of the global 3D Animation Market, driven by its strong entertainment ecosystem, advanced digital infrastructure, and high investment in animation technologies. The region benefits from the presence of major film studios, gaming companies, and streaming platforms that continuously demand high-quality animated content and visual effects. Rapid adoption of real-time rendering, virtual production, and AI-assisted animation tools further strengthens regional dominance, making North America a global hub for innovation and premium 3D animation production.
The United States dominates North America’s 3D animation market, supported by Hollywood studios, leading game developers, and global animation software providers. The country’s strong ecosystem encourages innovation in CGI, VFX, and immersive storytelling. High content spending by streaming platforms, growing use of animation in advertising and enterprise visualization, and early adoption of VR and AR technologies continue to reinforce U.S. leadership. Additionally, access to skilled talent and advanced production pipelines positions the U.S. as the primary driver of regional growth.
Get Customized Report as per your Business Requirement - Request For Customized Report
Asia Pacific is the Fastest-Growing Region in the 3D Animation Market in 2025E
Asia Pacific is projected to grow at an estimated CAGR of 15.8%, making it the fastest-growing region in the 3D animation market. Growth is fueled by rising digital content consumption, expanding gaming industries, and increasing investments in animation studios across emerging economies. The region’s cost-effective production capabilities, growing middle-class population, and rapid adoption of cloud-based animation tools are accelerating market expansion, particularly in media, mobile gaming, and online entertainment platforms.
China dominates the Asia Pacific 3D animation market, driven by strong government support for digital media, a booming gaming sector, and rapidly expanding streaming platforms. High demand for locally produced animated films, series, and mobile games boosts adoption of advanced animation technologies. Additionally, China’s growing pool of animation professionals and investment in AI-driven production tools strengthens its position as a leading regional content creator. Japan also contributes significantly through its strong animation culture, while India is emerging as a key outsourcing hub.
Europe 3D Animation Market Insights, 2025
In 2025, Europe held a significant share of the 3D animation market, supported by strong demand from media, gaming, architecture, and automotive visualization sectors. The region benefits from advanced creative talent, government support for digital media, and growing use of animation in advertising and industrial simulations. Germany dominates the European market, driven by its strong automotive and manufacturing industries, where 3D animation is widely used for product visualization, design validation, and virtual prototyping. Ongoing digital transformation initiatives continue to support regional growth.
Middle East & Africa and Latin America 3D Animation Market Insights, 2025
In 2025, the Middle East & Africa region experienced steady growth in the 3D animation market, driven by increasing investments in media production, smart city projects, and digital education initiatives. Countries such as the UAE and Saudi Arabia are investing in entertainment and creative industries to diversify their economies. Latin America also showed moderate growth, led by Brazil and Mexico, supported by expanding gaming markets, growing animation studios, and rising adoption of 3D animation in advertising and digital content creation. Both regions represent emerging opportunities for future market expansion.
KEY PLAYERS
-
Adobe Inc. (Adobe After Effects, Adobe Animate)
-
Autodesk Inc. (Maya, 3ds Max)
-
Corel Corporation (CorelDRAW, PaintShop Pro)
-
Nvidia Corporation (NVIDIA Omniverse, NVIDIA RTX Graphics Cards)
-
Pixar Animation Studios (RenderMan, Presto Animation Software)
-
DreamWorks Animation LLC (DreamWorks Apollo, MoonRay Render Engine)
-
Walt Disney Animation Studios (Hyperion Renderer, Zootopia Rigging System)
-
Maxon Computer GmbH (Cinema 4D, Redshift)
-
NewTek Inc. (LightWave 3D, TriCaster)
-
The Foundry Visionmongers Ltd. (Nuke, Mari)
-
Zco Corporation (3D Animation Services, Mobile App Development)
-
Anifex (Anifex 3D Animation Software, 3D Modeling & Animation Services)
-
Rip Media Group (3D Animation Production, Custom Animation Services)
-
Studio Ghibli Inc. (Miyazaki's 3D Animation Techniques, Storyboarding & Animation Design)
-
Nickelodeon Animation Studios (Nickelodeon 3D Animation, SpongeBob Animation Software)
-
Warner Bros. Entertainment Inc. (Warner Animation Software, 3D Animation Production)
-
Framestore (Framestore 3D, Houdini for VFX)
-
Blue Sky Studios, Inc. (Horton Hears a Who Animation, Ice Age Production Pipeline)
-
Weta Digital Ltd. (Weta Digital Animation Software, Weta Effects)
-
Viacom International Inc. (3D Animation Studios, 3D Animated Content Production)
Competitive Landscape for the 3D Animation Market:
Adobe Inc.
Adobe Inc. is a global leader in creative software, playing a critical role in the 3D animation market through its advanced digital content creation tools. The company offers industry-standard solutions widely used across animation, motion graphics, visual effects, and multimedia production. Adobe’s platforms enable artists, studios, and enterprises to create high-quality animated content efficiently, supporting workflows across film, television, gaming, advertising, and digital media. With a strong subscription-based ecosystem and deep integration across creative tools, Adobe strengthens collaboration, accelerates production timelines, and enhances creative flexibility, making it a key contributor to the global 3D animation market’s growth.
-
In 2024, Adobe expanded AI-powered animation and motion design capabilities across its creative suite, improving automation, realism, and workflow efficiency for animation professionals.
Autodesk Inc.
Autodesk Inc. is a dominant player in the 3D animation market, providing professional-grade software used extensively in film, gaming, architecture, and manufacturing visualization. Its solutions are central to 3D modeling, animation, simulation, and rendering workflows, enabling studios to produce complex and visually rich content. Autodesk’s tools support large-scale production pipelines and are widely adopted by major animation studios and game developers worldwide. The company’s focus on cloud collaboration, procedural workflows, and scalable animation pipelines positions it as a foundational technology provider driving innovation and productivity across the 3D animation ecosystem.
-
In 2024, Autodesk enhanced real-time collaboration and cloud-based production features within its animation platforms, supporting distributed teams and large-scale animation projects.
Corel Corporation
Corel Corporation is a well-established creative software provider with a growing presence in the 3D animation and digital design market. The company focuses on delivering accessible, cost-effective creative tools that appeal to independent creators, small studios, and design professionals. Corel’s software supports illustration, graphics, and animation workflows, enabling users to develop visually compelling content for marketing, media, and digital platforms. By offering flexible licensing models and user-friendly interfaces, Corel plays an important role in expanding 3D animation adoption among budget-conscious users and emerging creative businesses.
-
In 2024, Corel introduced performance enhancements and improved animation workflows across its creative software portfolio, targeting independent animators and small production teams.
NVIDIA Corporation
NVIDIA Corporation is a key technology enabler in the 3D animation market, providing high-performance graphics hardware and advanced real-time rendering platforms. Its GPU technologies power complex animation, simulation, and visual effects workloads across film, gaming, and industrial visualization. NVIDIA’s real-time rendering and collaborative virtual world platforms support physically accurate lighting, AI-driven animation, and immersive content creation. The company’s leadership in GPU acceleration and AI integration significantly enhances production speed and visual realism, making NVIDIA a critical backbone for next-generation 3D animation pipelines.
-
In 2024, NVIDIA expanded real-time rendering and AI-driven animation capabilities within its platform ecosystem, enabling faster, more realistic 3D content creation for studios and enterprises.
| Report Attributes | Details |
| Market Size in 2025E | USD 22.88 Billion |
| Market Size by 2033 | USD 63.55 Billion |
| CAGR | CAGR of 13.62% from 2026-2033 |
| Base Year | 2025 |
| Forecast Period | 2026-2033 |
| Historical Data | 2022-2024 |
| Report Scope & Coverage | Market Size, Segments Analysis, Competitive Landscape, Regional Analysis, DROC & SWOT Analysis, Forecast Outlook |
| Key Segments | • By Technique (3D Modeling, Motion Graphics, 3D Rendering, Visual Effects (VFX)) • By Component (Solution, Services) • By Organization Size (Small and Medium-sized Enterprises (SMEs), Large Enterprises) • By Deployment (On-Premise, On-Demand) • By End-use (Entertainment & Media, Architecture & Construction, Education & Academics, Manufacturing, Healthcare & Life Sciences, Others) |
| Regional Analysis/Coverage |
North America (US, Canada, Mexico), Europe (Eastern Europe [Poland, Romania, Hungary, Turkey, Rest of Eastern Europe] Western Europe] Germany, France, UK, Italy, Spain, Netherlands, Switzerland, Austria, Rest of Western Europe]), Asia Pacific (China, India, Japan, South Korea, Vietnam, Singapore, Australia, Rest of Asia Pacific), Middle East & Africa (Middle East [UAE, Egypt, Saudi Arabia, Qatar, Rest of Middle East], Africa [Nigeria, South Africa, Rest of Africa], Latin America (Brazil, Argentina, Colombia, Rest of Latin America) |
| Company Profiles | Adobe Inc., Autodesk Inc., Corel Corporation, Nvidia Corporation, Pixar Animation Studios, DreamWorks Animation LLC, Walt Disney Animation Studios, Maxon Computer GmbH, NewTek Inc., The Foundry Visionmongers Ltd., Zco Corporation, Anifex, Rip Media Group, Studio Ghibli Inc., Nickelodeon Animation Studios, Warner Bros. Entertainment Inc., Framestore, Blue Sky Studios, Inc., Weta Digital Ltd., Viacom International Inc. |
Frequently Asked Questions
ANS- The Asia Pacific region is expected to grow at the fastest CAGR of 15.41% from 2026 to 2033.
ANS- Google DeepMind introduced Genie 2, an AI tool capable of generating fully playable 3D worlds from simple prompts.
ANS- The Visual Effects (VFX) segment is projected to grow at a CAGR of 14.84% from 2026 to 2033.
ANS- North America captured about 39% of the 3D Animation Market's revenue share in 2025.
ANS- 3D Animation Market was valued at USD 22.88 billion in 2025E and is expected to reach USD 23.13 billion by 2033, growing at a CAGR of 13.20% from 2026-2033.
Get in Touch
