3D Holographic Market Report Scope & Overview:
Get more information on 3D Holographic Market - Request Sample Report
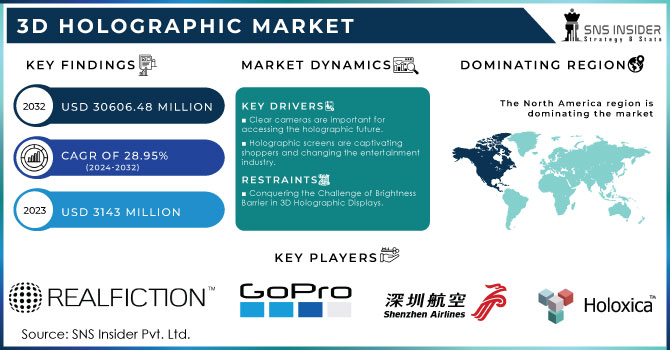
3D Holographic Market size was valued at USD 3143 million in 2023 and is expected to grow to USD 30606.48 million by 2032 and grow at a CAGR of 28.95 % over the forecast period of 2024-2032.
The advancement in creating Computer Generation Holograms (CGH) is set to greatly speed up the expansion of the 3D holographic market. Before, the level of computational effort needed to create computer-generated holograms made it difficult to use in real-time and restricted the practical use of holographic displays. Using a split Lohmann lens-based diffraction model, the new method significantly decreases the computational burden while maintaining image quality. This progress is vital as it eliminates a significant obstacle for the sector. Expect rapid progress in different industries as we now have the capability to create top-notch holograms instantly. Entertainment, advertising, gaming, and medical imaging are some of the few sectors ready for change. As holographic displays become more advanced and cost-effective, they may become just as common as regular screens in the future. This change will lead to fresh market possibilities and boost economic expansion.
Japan's recent release of new banknotes, showcasing advanced 3D holographic portraits, is expected to greatly increase the holographic market. The nation's choice to use printed designs for producing lively holograms on its money has attracted worldwide interest and is expected to boost the request for comparable technologies in different industries. Although Japan's society heavily relies on cash, it offers a special chance for using holographic technology in payment systems, with additional impacts in areas such as security, authentication, and consumer goods. The holographic materials and production equipment market is expected to experience significant growth due to the printing of approximately 7.5 billion new banknotes and the necessity for extensive machine updates. With Japan's goal of increasing cashless payments to 80% from 39%, the use of both cash and digital transactions will speed up the implementation of advanced security measures such as holograms, strengthening Japan's leadership in this sector.
Market Dynamics
Drivers
Clear cameras are important for accessing the holographic future.
Clear cameras are ready to change the 3D holographic industry by allowing smooth blending of real-life surroundings with virtual material, resulting in increased engagement and interaction. The potential of Zeiss' forthcoming Smart Glass technology, which will be showcased at CES 2024, illustrates this concept. The technology turns glass surfaces into interactive displays with more than 92% transparency, creating new opportunities for holographic applications beyond automotive HUDs. Holographic controls in smart homes and solar energy generation have a wide-reaching impact. This major advancement, comparable to the creation of letterpress printing, signifies a crucial moment for the holographic sector, known as the "Holographic Interface Revolution." With advancements in technology and increased availability, there will likely be a rise in the need for holographic solutions in different industries, leading to market expansion and a new way of people interacting with technology. The ability to seamlessly merge the physical and digital worlds will drive the market's shift to creating captivating and interactive experiences
Holographic screens are captivating shoppers and changing the entertainment industry.
Retailers have a tough battle on their hands when it comes to capturing customer attention, as they only have a short window of eight seconds to make an impact. Holographic displays are becoming a potent weapon in this arena. Their appeal, as demonstrated in Coca-Cola's "#bestcokeever" campaign, draws large groups. Throughout this campaign, more than 150,000 samples were distributed by a holographic slot machine game, showcasing how the technology can encourage interaction. Although big projects typically require rentals, smaller alternatives such as hanging window displays provide greater flexibility and simpler upkeep. Outside of traditional retail, holographic are changing the entertainment industry. Concerts showcasing late celebrities or live remote performances exhibit the adaptability of this technology. Game developers are also utilizing holographic to design characters that are extremely lifelike. Developers can produce interactive 3D characters in games by using cameras and sensors to capture subjects from various angles. The increasing use in retail, entertainment, and gaming highlights a major factor driving the 3D holographic market - the rising need for engaging and immersive experiences. With advancing technology becoming more cost-effective, increased integration is anticipated in multiple sectors, leading to a fresh phase of customer interaction and amusement.
Restraints
Conquering the Challenge of Brightness Barrier in 3D Holographic Displays.
One of the main obstacles in the 3D holographic display industry is the difficulty of preserving image clarity when exposed to strong ambient light or direct sunlight. Holograms, in contrast to traditional 2D displays, use precise manipulation of light waves to generate the perception of 3D images appearing to float. Nevertheless, in brightly lit settings, external light sources disrupt the light waves, diminishing image contrast and brightness. This leads to dim or pale holograms, greatly reducing their usefulness for outdoor use or well-lit indoor environments. This restriction has a significant effect due to the increasing need for 3D holographic displays in different sectors. It is essential to tackle this challenge in order to widen the market's scope and unlock the complete capacity of holographic technology. Conquering this obstacle of brightness is crucial for accessing new uses and promoting market expansion of 3D holographic displays.
Challenges impeding the expansion of the 3D holographic display market include adoption rates and Technology Type ion costs.
The 3D holographic display market is encountering obstacles that are inhibiting its widespread adoption, despite its potential for growth. One major obstacle is the low rate of acceptance, fueled by various factors such as the expensive Technology Type ion costs linked to holographic display technology. Producing 3D holographic displays involves intricate engineering and specialized materials to control light waves, resulting in a costly and intricate manufacturing process. The price of these screens is significantly more expensive than standard 2D or 3D screens that use simpler technologies such as stereoscopic imaging. Therefore, numerous potential customers, especially in markets where price is a major factor, are reluctant to commit to purchasing this innovative technology. Additionally, alternative tech like augmented reality (AR) and virtual reality (VR) provide comparable immersive experiences at a lower cost, thus also adding to the delay in the adoption of 3D holographic displays. AR and VR technologies are already well-established in industries such as entertainment, education, and advertising, offering interactive and immersive experiences at an affordable cost.
Segment Analysis
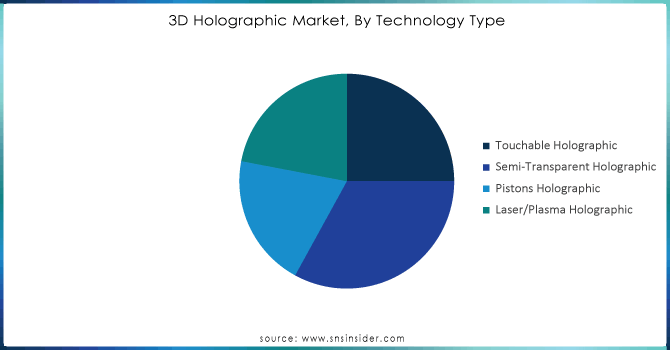
By Technology Type
Based on Technology Type, Semi-transparent Holographic is dominated in 3d Holographic market with 33 % of share in 2023. Its capability to smoothly integrate digital content with the physical world has driven its use in industries such as retail, automotive, and entertainment. The growth is driven by the increasing demand for immersive experiences and interactive advertising. Businesses are utilizing semi-translucent screens to design attractive Technology Type displays and advanced automotive HUDs. The market expansion is being driven by the flexibility of this technology, and its continued dominance is anticipated as industries aim to captivate audiences through new experiences.
Need any customization research on 3D Holographic Market - Enquiry Now
By Industry Vertical
In 2023, the consumer electronics industry dominated the 3D holographic market with a highest 31% share, highlighting its important role in the acceptance of this technology. The attraction of 3D holographic displays in consumer electronics is their capability to offer deeply immersive and interactive experiences, establishing fresh benchmarks for Technology Type innovation and user involvement. Leading corporations are utilizing this technology to develop revolutionary Technology Types that improve the overall customer satisfaction. Sony has led the way in creating holographic displays for luxury consumer electronics, providing unique viewing experiences that integrate well with home entertainment setups. In the same way, Microsoft has integrated holographic technology into its HoloLens devices, which are commonly used in gaming and mixed reality. Samsung is also investigating holographic screens for its future line of consumer Technology Types, with the goal of incorporating 3D holography into smartphones and other mobile devices. This leadership in the consumer electronics sector demonstrates the increasing desire for innovative, visually impressive Technology Types that challenge conventional display technologies. With ongoing progress, it is expected that the consumer electronics industry will continue to play a significant role in driving growth in the 3D holographic market.
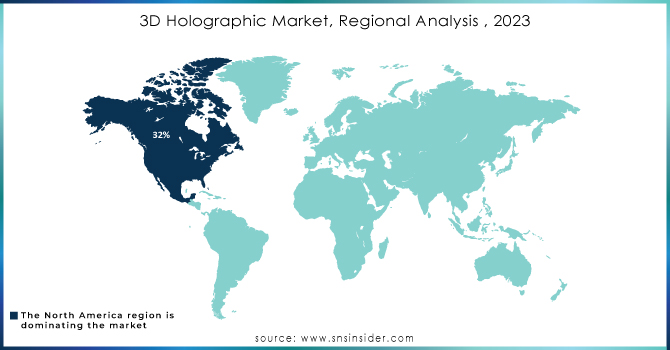
Regional Analysis
In 2023, North America had the largest market share in the 3D holographic technology market with a substantial 32% dominance. The U.S. is leading in the adoption and application of extended reality applications. This is driven by a strong technology infrastructure in the region, high investments in research and development as well as the high rate of adoption of XR across different industries in the region. In the U.S. Microsoft for instance experimented with HoloLens devices that integrate 3D holography in the context of mixed reality as well as enterprise applications Google is also a contributor in this region of the XR and holographic innovation. In relation to advertising, retail and events, the North American VNTANA and HYPERVSN brands are also notable for their innovative SMART Holographic display solutions. The leadership is further enhanced by a strong network of established tech giants, emerging business as well as academic centers that are pushing the innovation as well as business application of the technology.
In 2023, Asia Pacific saw the highest growth rate in the 3D holographic market, securing a market share of 29%. The region's rapid expansion is linked to its growing tech industry, higher investment in innovation, and increased need for advanced display solutions in multiple sectors. China has played a major role, with companies such as Huawei dedicating resources to research and develop holographic technologies for integration into their consumer electronics and communication devices. Japan is also making a contribution through companies like Sony, researching holographic technology for immersive entertainment experiences. In South Korea, LG Electronics is leading the way in developing holographic displays for consumer and industrial uses. The growth of the area is also supported by the growing retail and advertising industries, which are incorporating holographic displays to enhance customer experiences.
Key Players:
The prominent players of the market are Fine Pixel Led Co., Ltd, GoPro, Shenzhen Flyin, Fursol Corporation Ltd, Holoxica, Realfiction, Amethys, Magic, RIVOX,HoPro, Hyper vision Technologies and others in the final report.
Recent Development
-
In January 2024, HoloCare AS launched software that creates interactive 3D holograms of patients' organs, aiding surgeons in precise surgical planning tailored to individual anatomy. This immersive technology facilitates improved surgical communication, planning, and collaboration, accessible remotely for enhanced medical decision-making.
-
In December 2022, Meta Platforms Inc. acquired Luxexcel to enhance its AR and VR capabilities. This acquisition integrates Luxexcel's advanced lens manufacturing expertise to enhance the performance, design, and functionality of Meta's AR and VR devices, aligning with Meta's vision for advancing immersive technologies. Luxexcel Holding B.V., known for its 3D print solutions for ophthalmic labs and AR and VR headsets, strengthens Meta's position in the AR and VR market.
| Report Attributes | Details |
| Market Size in 2023 | USD 3143 Million |
| Market Size by 2032 | USD 30606.48 Million |
| CAGR | CAGR of 28.95 % From 2024 to 2032 |
| Base Year | 2023 |
| Forecast Period | 2024-2032 |
| Historical Data | 2020-2022 |
| Report Scope & Coverage | Market Size, Segments Analysis, Competitive Landscape, Regional Analysis, DROC & SWOT Analysis, Forecast Outlook |
| Key Segments | • By Technology Type (Touchable Holographic, Semi-transparent/Electro Holographic, Pistons Holographic, Laser/Plasma Holographic) • By Industry Vertical (Consumer Electronics, Media & Entertainment, Healthcare & Medical, Education, Aerospace & Defense, Others) |
| Regional Analysis/Coverage | North America (USA, Canada, Mexico), Europe (Germany, UK, France, Italy, Spain, Netherlands, Rest of Europe), Asia-Pacific (Japan, South Korea, China, India, Australia, Rest of Asia-Pacific), The Middle East & Africa (Israel, UAE, South Africa, Rest of Middle East & Africa), Latin America (Brazil, Argentina, Rest of Latin America) |
| Company Profiles | Fine Pixel Led Co., Ltd, GoPro, Shenzhen Flyin, Fursol Corporation Ltd, Holoxica, Realfiction, Amethys, Magic, RIVOX, HoPro, Hyper vision Technologies and others |
| Key Drivers |
|
| Market Restraints |
|
Get in Touch
