3D Printed Drones Market Size & Growth:
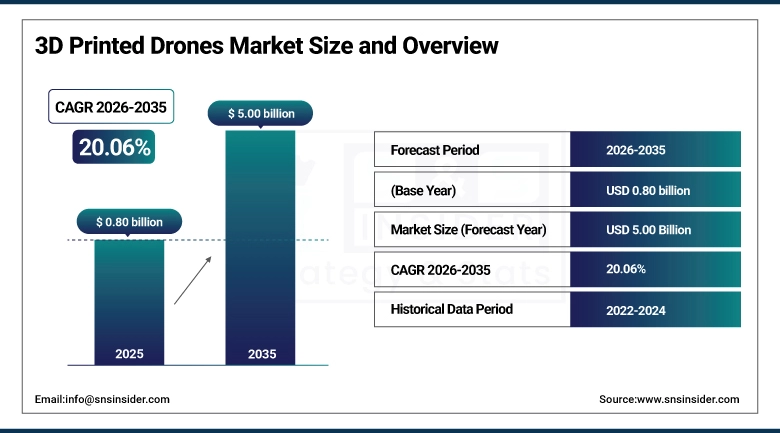
The 3D Printed Drones Market size was valued at USD 0.80 billion in 2025 and is expected to grow at 20.06% CAGR to reach USD 5.00 billion by 2035.
The global market is segmented on the basis of detailed segmentation, growth drivers, challenges, and regional analysis. Drones are getting lighter, cheaper, and faster to make with the addition of additive manufacturing. This technology change allows for fast customization with quick and easy algorithm deployment, and faster and wider adoption within defense, commercial and government sectors globally. Growth in 3D printing drives cost-effectiveness and innovation in the UAV manufacturing market.
For instance, over 90% material utilization efficiency is achieved with 3D printing, minimizing waste during drone manufacturing.
Market Size and Forecast: 2025
-
Market Size in 2025 USD 3.58 Billion
-
Market Size by 2035 USD 19.52 Billion
-
CAGR of 23.6% From 2026 to 2035
-
Base Year 2025
-
Forecast Period 2026-2035
-
Historical Data 2022-2024
To Get more information on 3D Printed Drones Market - Request Free Sample Report
3D Printed Drones Market Trends:
-
Increasing demand for lightweight and cost-effective drones across agriculture, defense, logistics, and infrastructure sectors.
-
Rapid customization of drone components enabled by 3D printing to meet specific mission requirements.
-
Enhanced drone performance with 3D-printed parts reducing component weight by up to 35%, improving endurance and payload capacity.
-
Growth of on-demand drone manufacturing for disaster relief, search and rescue, and tactical military missions.
-
Integration of additive manufacturing into field logistics by defense forces for real-time UAV component production and repair.
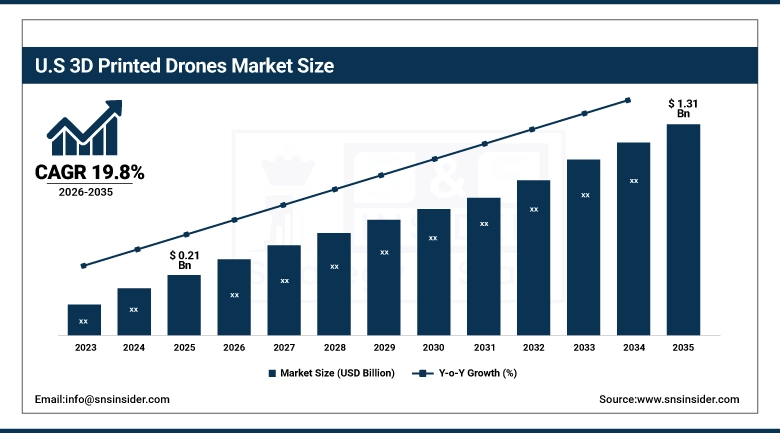
The U.S. 3D Printed Drones Market size was USD 0.21 billion in 2025 and is expected to reach USD 1.31 billion by 2035, growing at a CAGR of 19.8% over the forecast period of 2026–2035. The U.S. market is mainly fueled by massive military investment, early adoption of additive manufacturing technologies, and the foundation of a few cutting-edge drone and 3D printing enterprises. Additional growth is propelled by government contracts and rising R&D programs to modernize aerospace systems. These elements are fast-tracking the advancement and utilization of 3D drones in both defense and commercial fields, reaffirming both as a major player in the global 3D printed drones market growth. For instance, over 60% of aerospace and defense contractors in the U.S. use large-format additive manufacturing for drone parts.
3D Printed Drones Market Growth Drivers:
-
Rising Demand for Lightweight, Cost-Effective, and Rapidly Customizable Drone Solutions Across Industries
Industries such as agriculture, defense, logistics, and infrastructure inspection are growing rapidly, which is creating a large demand for lightweight, inexpensive, and versatile drones. Production speed and cost are also not a concern when it comes to 3D printing, which is slowly but surely converting the design of the part into the actual part itself. What makes this even more appealing for modern drone applications is its ability to customize components depending on the mission requirements. The unified growth of increase in usage of UAVs and expansion of 3D printer capabilities is one of the key factor driving the global 3D printed drones industry growth.
For instance, 3D-printed parts can reduce drone component weight by up to 35%, significantly improving endurance and payload capacity.
3D Printed Drones Market Restraints:
-
Limited Material Availability and Performance Constraints in 3D Printed Drone Components
Although 3D printing delivers design flexibility, few performance materials suitable for flying long-endurance missions exist. Not all materials possess the strength-to-weight ratio or durability required for aerospace-grade components. And for other components, such as motors and batteries, conventional manufacturing technologies still being used today make it impossible to manufacture a full drone out of 3D printed pieces. Such limitations in both material and performance restrict wide-scale adoption, particularly in mission-critical applications where durability and strength are paramount.
3D Printed Drones Market Opportunities:
-
Rising Adoption of On-Demand Drone Manufacturing for Disaster Relief and Tactical Military Missions
There is growing demand for on-demand drone production in remote or high-risk areas, both for military and humanitarian uses. Instead of waiting for surgical drone designs to arrive from overseas, 3D printing enables forces or aid agencies to manufacture drones locally, saving crucial time and cost according to mission requirements in real-time. This feature enables quick stand-up in the midst of humanitarian assistance and disaster relief, search and rescue, or combat crisis action. This has already led to governments and defense contractors pouring resources into mobile 3D printing stations, creating the potential for real-time, on-the-ground drone manufacturing.
For instance, over 40% of NATO-aligned forces have integrated additive manufacturing into field logistics for UAV component production and repair.
3D Printed Drones Market Segment Analysis:
By Type
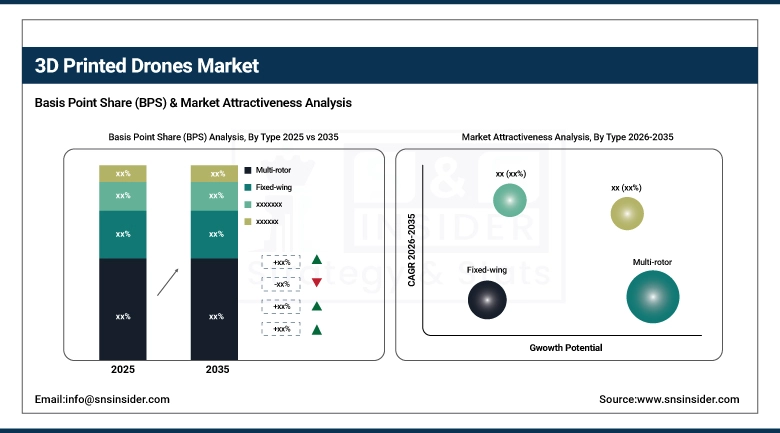
In 2025, the multi-rotor dominated the 3D printed drones market share by 46.50%. This ubiquity is driven by its uncomplicated architecture, its 3D printing methodology, and its widespread use in surveillance, agricultural, and aerial imaging. That has begun to witness additively adopted to improve a rotor's performance and weight to create a drone perhaps more ideal for the short-range missions, and consumer facing tenders, as it had with companies such as DJI. The hybrid segment is expected to experience the fastest growth, with a notable CAGR of 20.81% during the year 2026 to 2035. The drones have been born for vertical take-off, but also for rest-based flight at a long range, making them ideal for logistics and defense missions. Driven by the stability and versatility of the segment, along with a variety of high demand sectors, including traditional drone usages, the segment is booming, with noted innovator Quantum Systems utilizing 3D printing to produce fully customizable hybrid drones for mapping, reconnaissance, and industrial inspection ends.
By Component
The airframe segment held a leading revenue share of 35% in 2025, primarily due to its structural significance and strong compatibility with 3D printing, enabling rapid customization. 3D printing allows weight reduction and structural optimization, desirable in both military and industrial drones. Industry leaders such as Lockheed Martin are utilizing 3D-printed airframes in the aerospace industry to maximize aerodynamic efficiency with minimal effort and expense. Propellers segment is expected to have the highest growth rate of the market as it is projected to grow with a CAGR of 22.14% during 2026 to 2035. It's aerodynamic but lighter than a standard propeller, due to its being 3D-printed. Companies such as Zortrax are developing 3D-printed propellers that satisfy the operating and structural requirements of propellers for commercial and research drones that can bring more precise flight control and greater fuel efficiency for wider applications.
By Technology
Fused Deposition Modeling (FDM) held the leading share of 47.70% in 2025, primarily due to its cost-effectiveness and adoption in application prototyping along with small volume production. This is further clarified with how the use of standard thermoplastics makes the rapid production possible. Companies such as Stratasys quickly supplied drone startups and even military R&D arms with the ability to rapidly prototype structural components at low cost in order to iterate on designs with an economic profile that made little sense forty years ago for many common forms of FDM drones. Selective Laser Sintering (SLS) is anticipated to experience the highest CAGR of 21.46% during 2026–2035 owing to its advantages in terms of strong, complex and lightweight parts. EOS GmbH, the leading commercial provider of SLS systems is supporting aerospace and defense companies to leverage SLS to produce performance drone components exposed to mission-critical conditions.
By End-User
The military segment accounted for the highest market share of 37.89% in 2025, which can be attributed to increasing defense budgets and the growing use of 3D printed drones for reconnaissance, surveillance and tactical missions. It sticks to the operational agility that a combat zone enables with their ability to produce drones quickly and onsite. AeroVironment and others are adding manufacturing processes to support specialized mission requirements for UAVs by the Defense Industry. The commercial segment is forecasted to grow at the fastest CAGR of 21.07% during 2026 to 2035, owing to the universal use of drones for delivery, inspection, and filming purposes. Logistics drones such as the ones produced by Zipline are hybrid models made from 3D-printed components (allowing for faster design iterations and shorter production cycles) which makes this portion of the industry booms in developed and developing countries as well.
3D Printed Drones Market Regional Analysis:
North America 3D Printed Drones Market Insights
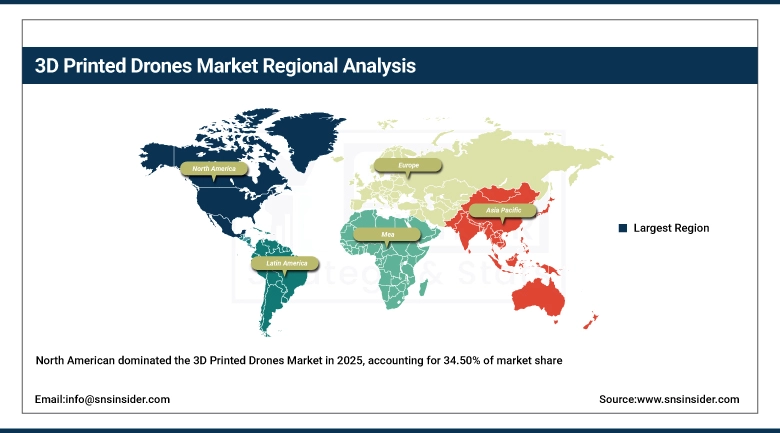
North America holds an approximate 34.50% of global market revenue during 2025 due to enhanced government and military investments, R&D funding, and key players presence. Then there are U.S.-based firms such as Boeing and Northrop Grumman that are all-on-board for drone development via 3D printing in a market backed with policies and an advanced industrial base.
Get Customized Report as per Your Business Requirement - Enquiry Now
-
The U.S. dominates the North American 3D printed drones market due to strong defense spending, advanced aerospace infrastructure, early adoption of additive manufacturing, and key players such as Lockheed Martin and AeroVironment driving innovation and large-scale production capabilities.
Asia Pacific 3D Printed Drones Market Insights
Asia Pacific will be growing at a CAGR of 21.51% due to increased use of drones in sectors such as agriculture, surveillance, and disaster relief. China, India, Japan and many other countries have sought to reduce costs of using drones by making them locally through 3D printing in a bid to become self-sufficient. Fierce 3D prototyping and scalable production by local incumbents such as DJI are driving innovation.
-
China leads the Asia Pacific market owing to its massive drone manufacturing base, technological investments in 3D printing, supportive government policies, and global giants such as DJI leveraging additive manufacturing for cost-effective, high-volume drone production and rapid product innovation.
Europe 3D Printed Drones Market Insights
Europe holds a significant position in the 3D printed drones market, driven by strong R&D investments, aerospace innovation, and increasing adoption in defense and commercial sectors. Countries including Germany, France, and the UK are actively integrating additive manufacturing into drone development, supported by EU funding initiatives. Growing interest in border surveillance and industrial inspection further fuels regional growth.
-
Germany dominates the European 3D printed drones market due to its advanced aerospace industry, strong additive manufacturing capabilities, and high R\&D investment. Leading companies and defense collaborations position Germany as the core innovation and production hub in the region.
Latin America (LATAM) and Middle East & Africa (MEA) 3D Printed Drones Market Insights
In the Middle East & Africa, the UAE dominates due to strong defense spending, smart city initiatives, and rapid adoption of drone technologies supported by government-led innovation hubs. In Latin America, Brazil leads with increasing use of drones in agriculture, defense modernization, and growing investment in additive manufacturing and R&D.
3D Printed Drones Market Key Players:
Major Key Players in 3D printed drones Market are
- DJI
- Lockheed Martin Corporation
- AeroVironment, Inc.
- Boeing
- Northrop Grumman Corporation
- Stratasys Ltd.
- 3D Systems Corporation
- General Atomics
- BAE Systems
- Parrot Drones SAS
- Raytheon Technologies Corporation
- Quantum Systems GmbH
- EHang
- Thales Group
- Dassault Systèmes
- Airbus S.A.S.
- Zortrax
- EOS GmbH
- GE Additive
- Delair Tech
Competitive Landscape for 3D Printed Drones Market:
DJI is a global leader in commercial and consumer drones, specializing in innovative UAV solutions. Leveraging 3D printing for lightweight, customizable components, DJI enhances drone endurance, payload capacity, and mission-specific performance. The company serves sectors including agriculture, defense, logistics, and infrastructure inspection, driving adoption of advanced 3D-printed drone technologies worldwide.
-
In May 2025, DJI launched the Mavic 4 Pro, featuring a 100 MP Hasselblad sensor, 360° "Infinity" gimbal, up to 51 min flight time, and advanced obstacle avoidance. This latest flagship underscores DJI’s integration of high-precision aerial imaging, enabling drone components such as propellers and structural mounts to benefit from lightweight, 3D‑printed accessories and modular innovations.
Lockheed Martin Corporation is a leading aerospace and defense company developing advanced UAVs for military and tactical applications. By integrating 3D-printed components, the company achieves lightweight, high-performance drones tailored for rapid deployment, disaster relief, and mission-specific operations, strengthening its position in the emerging 3D-printed drones market globally.
-
In November 2024, Lockheed Martin significantly expanded its additive manufacturing by opening a state‑of‑the‑art facility in Grand Prairie, Texas, equipped with large‑format Nikon SLM Solutions machines. This expansion enables rapid production of 3D‑printed drone components and supports scalable prototyping of airframes and structural parts.
| Report Attributes | Details |
|---|---|
| Market Size in 2025 | USD 0.80 Billion |
| Market Size by 2035 | USD 5.00 Billion |
| CAGR | CAGR of 20.06% From 2026 to 2035 |
| Base Year | 2025 |
| Forecast Period | 2026-2035 |
| Historical Data | 2022-2024 |
| Report Scope & Coverage | Market Size, Segments Analysis, Competitive Landscape, Regional Analysis, DROC & SWOT Analysis, Forecast Outlook |
| Key Segments | • By Type (Fixed-wing, Multi-rotor, Single-rotor and Hybrid) • By Component (Airframe, Wings, Landing Gears, Propellers, Mounts & Holders and Others) • By Technology (Fused Deposition Modeling (FDM), Stereolithography (SLA), Selective Laser Sintering (SLS) and Others) • By End-User (Consumer, Military, Commercial and Government & Law Enforcement) |
| Regional Analysis/Coverage | North America (US, Canada), Europe (Germany, UK, France, Italy, Spain, Russia, Poland, Rest of Europe), Asia Pacific (China, India, Japan, South Korea, Australia, ASEAN Countries, Rest of Asia Pacific), Middle East & Africa (UAE, Saudi Arabia, Qatar, South Africa, Rest of Middle East & Africa), Latin America (Brazil, Argentina, Mexico, Colombia, Rest of Latin America). |
| Company Profiles | DJI, Lockheed Martin Corporation, AeroVironment, Inc., Boeing, Northrop Grumman Corporation, Stratasys Ltd., 3D Systems Corporation, General Atomics, BAE Systems, Parrot Drones SAS, Raytheon Technologies Corporation, Quantum Systems GmbH, EHang, Thales Group, Dassault Systèmes, Airbus S.A.S., Zortrax, EOS GmbH, GE Additive and Delair Tech. |
Frequently Asked Questions
Ans: North America dominated the 3D Printed Drones Market in 2025.
Ans: The Fused Deposition Modeling (FDM) segment dominated the 3D Printed Drones Market in 2025.
Ans: The major growth factor is the integration of additive manufacturing, enabling faster, cost-effective, and customizable drone production across industries.
Ans: The 3D Printed Drones Market size was valued at USD 0.80 billion in 2025 and is expected to grow at 20.06% CAGR to reach USD 5.00 billion by 2035.
Ans: The 3D Printed Drones Market is expected to grow at a CAGR of 20.06% from 2026-2035.
Get in Touch
