Semiconductor Yield Analytics Tools Market Report Scope and Overview:
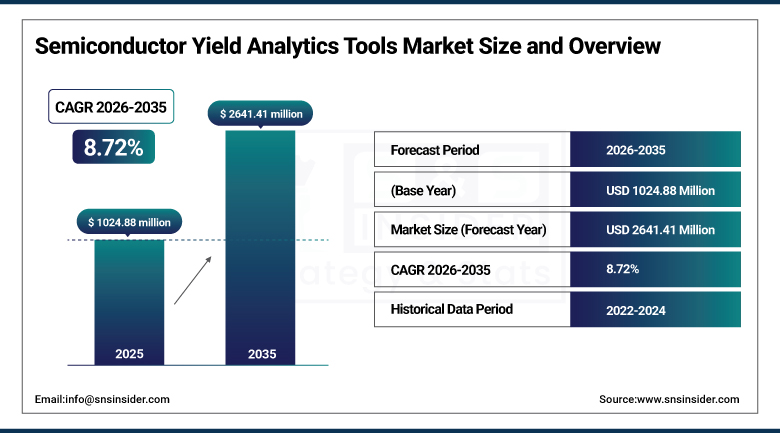
The Semiconductor Yield Analytics Tools Market size was valued at USD 1024.88 Million in 2025 and is expected to reach USD 2641.41 Million by 2035, growing at a CAGR of 8.72% over the forecast period of 2026-2035.
The world Semiconductor Yield Analytics Tools Market is growing with the presence of number of growing companies which are involved in the production of various semiconductor tool components. With the rapid development of technologies such as AI, IoT and autonomous driving, the requirements for defect-free, high-performance chips is particularly urgent. Software application that is very important for increasing the productivity of the fabrication procedure and reducing expensive wear out in advance of products are manufacture are yield improvement tools. This trend is also reinforced by increased investment in semiconductor infrastructure and implementation of data-driven quality control throughout the fabs worldwide.
over 60% of fabs globally are integrating data-driven quality control systems to improve real-time yield monitoring and predictive defect detection.
Semiconductor Yield Analytics Tools Market Size and Forecast:
-
Market Size in 2025 USD 1024.88 Million
-
Market Size by 2035 USD 2641.41 Million
-
CAGR 8.72% from 2026 to 2035
-
Base Year 2025
-
Forecast Period 2026–2035
-
Historical Data 2022–2024
To Get more information on Semiconductor Yield Analytics Tools Market - Request Free Sample Report
The U.S. Semiconductor Yield Analytics Tools Market size was USD 227.40 Million in 2025 and is expected to reach USD 383.18 million by 2035, growing at a CAGR of 6.74% over the forecast period of 2026–2035.The US semiconductor yield analytics tools market growth is driven by rising demand for high-quality chips in applications such as AI and 5G, as well as investment in domestic semiconductor manufacturing. Growing federal support for domestic chip fabrication and a larger focus on manufacturing resilience following global supply chain disruptions also are contributing to an acceleration of adoption rates for the market in the United States.
78% of U.S. chipmakers cited supply chain resilience and self-sufficiency as top reasons for investing in yield-enhancing technologies.
Semiconductor Yield Analytics Tools Market Highlights:
-
Growing demand for higher semiconductor manufacturing efficiency is driving adoption of yield analytics tools.
-
Integration with AI, machine learning, and big data analytics is enhancing defect detection and process optimization.
-
Increasing complexity of advanced nodes and packaging technologies is boosting market growth.
-
Adoption of real-time monitoring and predictive maintenance is improving wafer yield and reducing production costs.
-
Expansion of fabless semiconductor companies and foundries is increasing tool utilization.
-
Continuous innovation in analytics platforms and automation is shaping market trends.
-
Collaborations between semiconductor manufacturers, software providers, and research institutions are accelerating development and deployment.
Semiconductor Yield Analytics Tools Market Drivers:
-
Increasing semiconductor complexity necessitates advanced analytics to maintain high yield and cost-efficiency across production cycles
As chip architectures become more advanced - such as AI, 5G and edge computing - manufacturers have increased defect rates and narrower process margins. Tools based on yield analytics allow for the real-time and data-supported defect monitoring and predict maintenance to improve production efficiency. Firms are investing in AI platforms that can identify inefficiencies in the process, resulting in fewer defective chips and greater profitability. The ever-increasing demand for performance and efficiency, combined with the need to minimize waste, is driving fabs to implement full fledged yield analytics solution to speed development and increase market share.
According to research, implementing predictive yield analytics has been shown to reduce product development cycles by up to 30%, accelerating time-to-market for new chips.
Semiconductor Yield Analytics Tools Market Restraints:
-
Limited interoperability with legacy systems hampers seamless integration of yield analytics platforms
There is a huge fraction of semiconductor fabs out there, especially those that were built over a decade ago, that are still running on antiquated MES systems, or even home brew solutions. However, integrating contemporary yield analytics platforms into such legacy systems is a challenging task that is fraught with data format discrepancies, security concerns and operational disruptions. This gap between plug-and-play interoperability significantly deters companies from migrating to modern analytics environments. The resulting inefficiencies slow the decision-making process and diminish the potential that the tools offer, forming a significant deterrent to mass market adoption even though there's the potential for ROI.
Semiconductor Yield Analytics Tools Market Opportunities:
-
Growing focus on smart manufacturing and Industry 4.0 opens avenues for AI-integrated yield analytics solutions
These software tools use machine learning algorithms to anticipate yield-improving and yield-limiting events, manage tool operations and detect root causes as they are happening. This intelligent automation minimizes both downtime and enhances process flexibility, especially in a multi-line fab. In order to gain from the paradigm shift towards self-learning manufacturing environments in the industries, suppliers will benefit tremendously from the integrated analytics with AI vendors, that would ultimately deliver fully autonomous semiconductor manufacturing.
According to research, as of 2024, over 72% of semiconductor manufacturers have adopted some form of Industry 4.0 technology, including AI and data analytics platforms.
Semiconductor Yield Analytics Tools Market Segment Analysis:
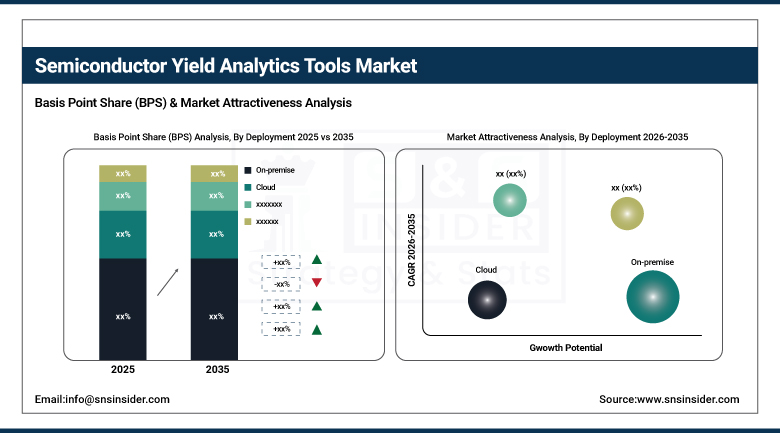
By Deployment, on-premise segment dominates the Semiconductor Yield Analytics Tools Market, cloud segment is expected to grow fastest.
The on-premise segment accounted for the highest revenue share of approximately 71.78% in 2025 because it generally provides better data security, system performance, and customization options. On-premise deployment is also a favorite for semiconductor manufacturers to adhere to strict IP protection regulations and to operate the critical production environments end-to-end by themselves. There’s also that the old equipment in old fabrication plants is more likely to work best with on-site analytics tools, which can work in concert with legacy process-control systems without leading to a data security breach or loss of operational integrity in high-security production lines.
The cloud segment is projected to grow at the fastest CAGR of around 9.89% from 2026 to 2035, due to its flexibility, scalability, and cheaper initial cost to deploy. Companies such as PDF Solutions are already developing and providing cloud-native analytics platforms that facilitate collaborative fabless and foundry design. Cloud-based tools will provide the agility they’ll need to keep up with growing volumes of data and to respond to analytics demands without massive capital investment. In addition, cloud platforms enable remote team work, AI-based analytics, and rapid deployment cycles.
By Application, Defect Data Analysis segment dominates the Semiconductor Yield Analytics Tools Market, Process and Tool Excursion Identification segment is expected to grow fastest.
The Defect Data Analysis segment dominated the Semiconductor Yield Analytics Tools Market with the highest revenue share of about 30.84% in 2025 because of its importance in detecting yield-detracting defects in manufacturing. With the growing complexity of chip architectures, fault detection and classification play a crucial role in enhancing the yield and minimizing the production cost. Strong need from fabs for waste reduction, cycle time reduction, and quality control also lead to the significance of the segment. On the Innovation, for example, offers chip front and back end process specialized defect analysis systems.
The Process and Tool Excursion Identification segment is expected to register the fastest CAGR of approximately 10.04% from 2026 to 2035, driven by increasing demand for predictive maintenance and anomaly detection in high-end semiconductor nodes. One of the leading vendors in this segment, BISTel, provides AI-based platform for real-time excursion identification. Since process variation directly affects the performance and the reliability of the resulting chip, early excursion detection enables fabs to avoid costly production problems and drives adoption of smart manufacturing.
By Type, Wafer Inspection Tools segment dominates the Semiconductor Yield Analytics Tools Market, Process Control Tools segment is expected to grow fastest.
The Wafer Inspection Tools segment dominated the Semiconductor Yield Analytics Tools Market with a revenue share of about 41.37% in 2025, due to their criticality in detection of pattern defects, particles and structural imperfections at critical stages in the process of manufacturing of semiconductors. These are early ad for defect detection through several wafer stages with an intention of reducing yield drops and optimizing process control. Semiconductor yield analytics tools companies such as KLA Corporation are leading this space with advanced wafer inspection systems used in leading fabs worldwide.
The Process Control Tools segment is projected to grow at the fastest CAGR of around 10.05% between 2026 and 2035, as the trend among manufacturers shifts toward collecting and returning data in real-time to maintain consistency and minimize variation. Nova Ltd offers metrology and process control solutions with advanced integration of AI and big data analysis such as machine learning, optimisation and fault detection, providing recommendations on products-to-be off the line. As process windows get smaller and nodes continue to shrink, the demands on high-precision control are growing, and this has led to even greater demand for tools that enable zero-defect manufacturing.
By End-Users, Integrated Device Manufacturers (IDMs) segment dominates the Semiconductor Yield Analytics Tools Market, Semiconductor Fabless Companies segment is expected to grow fastest
The Integrated Device Manufacturers (IDMs) segment dominated the Semiconductor Yield Analytics Tools Market share of 38.88% in 2025 as they get to keep the whole semicondoctor value chain—from deisgn to production. This vertical integration leads to huge investments in yield analytics tools to further improve costs, performance and time-to-market. Industry leader IDM Intel Corporation employs holistic yield analysis systems to maximize wafer production and process capability for its fabs worldwide to sustain competitive edge and innovation.
The Semiconductor Fabless Companies segment is expected to grow at the fastest CAGR of around 9.85% from 2026 to 2035, fueled by a growing use of advanced analytics to improve cooperation with foundry partners. Cadence Deals in AI-based design-for-yield and analytics products that are well-matched for fabless companies. And as fabless companies concentrate on chip designs and deprioritize the manufacturing, yield analytics aids them in monitoring the results of fabrication, adjusting designs for manufacturability and shortening the time-to-yield.
Semiconductor Yield Analytics Tools Market Regional Analysis:
North America Semiconductor Yield Analytics Tools Market Insights
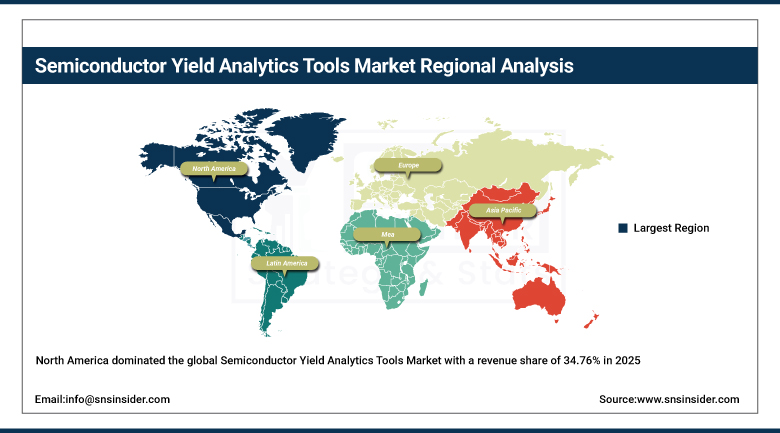
North America dominated the global Semiconductor Yield Analytics Tools Market with a revenue share of 34.76% in 2025, owing to the presence of industry leaders, large R&D costs, and sophisticated fabrication facilities. The top leading fabs and yield analytics service providers are in the region. Swelling demand from automotive, defense, and AI are also propelling investments into yield optimization technologies, and the regional supremacy is buttressed by supportive government initiatives and a mature semiconductor ecosystem.
-
The U.S. is leading the North American market, owing to the strong presence of semiconductor manufacturers, higher R&D investments and leading players in yield analysis tools. Leader in the business is also backed by government support and high adoption in areas such as defense and automotive.
Get Customized Report as per Your Business Requirement - Enquiry Now
Asia Pacific Semiconductor Yield Analytics Tools Market Insights
Asia Pacific is projected to grow at the fastest CAGR of approximately 10.00% from 2026 to 2035, driven by the rapid growth of semiconductor manufacturing clusters in China, Taiwan, South Korea and India. The region has a strong presence of fabs and a growing number of both IDMs and foundries. Moreover, growing demand for consumer electronics, auto chips, and 5G devices fuels the adoption of yield analytics solutions. Assistance from the government, cheap labor and rising tech innovation continue to drive market growth throughout the Asia Pacific region.
-
China leads the Asia Pacific market owing to aggressive investments towards chip self-sufficiency, building out of fabrication capacities and being dominated by government-led industrial policies. In addition, the increasing demand for electronics and AI technology in the country has led to the adoption of yield analytics tools in local manufacturing plants.
Europe Semiconductor Yield Analytics Tools Market Insights
Europe is a prominent market for Semiconductor Yield Analytics Tools, owing to the region’s high manufacturing prowess, R&D intensity, and investments towards semiconductor innovation. It’s not just about sending satellites into orbit More than simple satellites, countries like Germany, France and the Netherlands support with high-end fabrication facilities and AI-centred analytics amongst others. Automotive electronics and industrial automation are the focus for the region and increase the need for yield optimization is also on the rise.
-
Germany holds the larger share in Europe market of Semiconductor Yield Analytics Tools. It is primarily due to its robust semiconductor production, advanced engineering capabilities, and significant R&D investments. Germany’s emphasis on auto electronics, industrial automation and smart manufacturing drives the demand for yield analytics in its high-tech production chain.
Middle East & Africa and Latin America Semiconductor Yield Analytics Tools Market Insights
The Middle East & Africa is led by the UAE as the country is focusing greatly on technological sectors and investing significantly on the semiconductor infrastructure. In Latin America, the market is led by Brazil, which benefits from growing electronics manufacturing, government support and surging application of hi-tech manufacturing solutions.
Semiconductor Yield Analytics Tools Market Competitive Landscape:
yieldWerx:
yieldWerx is a leading provider of semiconductor yield analytics solutions, offering advanced software platforms that help chip manufacturers optimize wafer yields, reduce defects, and improve production efficiency. By integrating real-time data, AI, and machine learning, yieldWerx enables proactive decision-making across the fabrication process, supporting high-performance semiconductor production and maximizing profitability in complex manufacturing environments. The company focuses on scalable, cloud-enabled solutions for global semiconductor operations.
-
In March 2025, yieldWerx announced a strategic partnership with Dymek to deploy yield analytics across Southeast Asia, combining yieldWerx’s platform with Dymek’s regional expertise.
DR YIELD software & solutions GmbH:
DR YIELD software & solutions GmbH specializes in semiconductor yield management, providing innovative tools like YieldWatchDog to enhance production quality and minimize defects. The company leverages AI and machine learning to analyze complex fabrication data, helping manufacturers predict and prevent yield loss. DR YIELD focuses on offering customizable, data-driven solutions that support continuous process improvement, optimize manufacturing operations, and strengthen competitiveness in the global semiconductor market.
-
In May 2024, DR YIELD software & solutions GmbH launched a featured article on “Leveraging Machine Learning in Semiconductor Yield Analysis,” showcasing their AI enhancements to YieldWatchDog.
Semiconductor Yield Analytics Tools Companies are:
Major Key Players in Semiconductor Yield Analytics Tools Market are
-
Applied Materials, Inc.
-
ASML Holding N.V.
-
Lam Research Corporation
-
Synopsys, Inc.
-
PDF Solutions, Inc.
-
Onto Innovation Inc.
-
Tokyo Electron Limited (TEL)
-
DR YIELD software & solutions GmbH
-
yieldHUB / yieldWerx
-
Kionix, Inc.
-
Cadence Design Systems, Inc.
-
Advantest Corporation
-
Teradyne, Inc.
-
Applied Micro Circuits Corporation (AMCC)
-
Nova Measuring Instruments Ltd.
-
Mentor Graphics (Siemens EDA)
-
Tokyo Electron Device Limited
-
Rudolph Technologies (part of Onto Innovation)
-
FormFactor, Inc.
| Report Attributes | Details |
|---|---|
| Market Size in 2025 | USD 1024.88 Million |
| Market Size by 2035 | USD 2641.41 Million |
| CAGR | CAGR of 8.72% From 2026 to 2035 |
| Base Year | 2025 |
| Forecast Period | 2026-2035 |
| Historical Data | 2022-2024 |
| Report Scope & Coverage | Market Size, Segments Analysis, Competitive Landscape, Regional Analysis, DROC & SWOT Analysis, Forecast Outlook |
| Key Segments | • By Deployment (On-premise, Cloud) • By Application (Defect Data Analysis, Wafer Disposition, Process and Tool Excursion Identification, Spatial Signature Analysis, Yield Analysis, Others (Yield Prediction)) • By Type (Wafer Inspection Tools, Process Control Tools, Data Analysis Tools, Others (Visualization Tools)) • By End-users (Integrated Device Manufacturers (IDMs), Semiconductor Fabless Companies, Semiconductor Test Equipment Manufacturers, Semiconductor Outsourced Assembly and Test Houses (OSATs)) |
| Regional Analysis/Coverage | North America (US, Canada), Europe (Germany, UK, France, Italy, Spain, Russia, Poland, Rest of Europe), Asia Pacific (China, India, Japan, South Korea, Australia, ASEAN Countries, Rest of Asia Pacific), Middle East & Africa (UAE, Saudi Arabia, Qatar, South Africa, Rest of Middle East & Africa), Latin America (Brazil, Argentina, Mexico, Colombia, Rest of Latin America). |
| Company Profiles | KLA Corporation, Applied Materials, Inc., ASML Holding N.V., Lam Research Corporation, Synopsys, Inc., PDF Solutions, Inc., Onto Innovation Inc., Tokyo Electron Limited (TEL), DR YIELD software & solutions GmbH, yieldHUB / yieldWerx, Kionix, Inc., Cadence Design Systems, Inc., Advantest Corporation, Teradyne, Inc., Applied Micro Circuits Corporation (AMCC), Nova Measuring Instruments Ltd., Mentor Graphics (Siemens EDA), Tokyo Electron Device Limited, Rudolph Technologies (part of Onto Innovation), FormFactor, Inc. |
Frequently Asked Questions
North America dominated the Semiconductor Yield Analytics Tools Market in 2025.
On-premise segment dominated the Semiconductor Yield Analytics Tools Market.
The major growth factor of the Semiconductor Yield Analytics Tools Market is the increasing demand for advanced nodes, AI-driven defect detection, and increasing wafer complexity.
The Semiconductor Yield Analytics Tools Market size was valued at USD 1024.88 Million in 2025 and is expected to reach USD 2641.41 Billion by 2035.
The Semiconductor Yield Analytics Tools Market is expected to grow at a CAGR of 8.72 % from 2026-2035.
Get in Touch
