6G Market Report Scope & Overview:
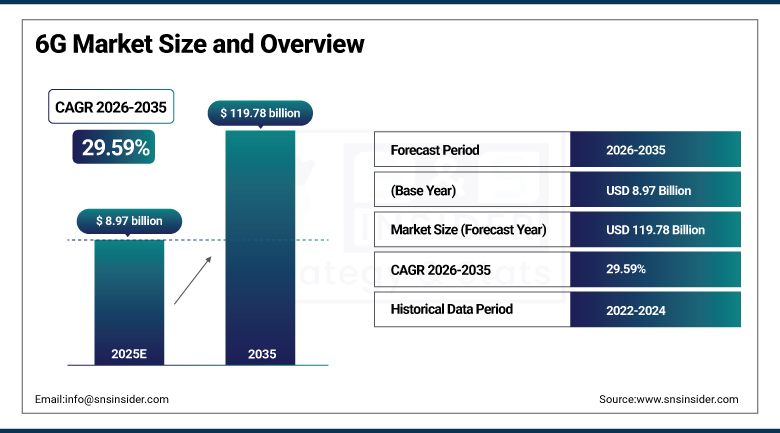
6G Market was valued at USD 8.97 billion in 2025 and is expected to reach USD 119.78 billion by 2035, growing at a CAGR of 29.59% from 2026–2035.
6G technology is experiencing increased growth because of the rising need for ultra-high-speed connection, latency-free communication, and huge growth of IoT applications. The rise in the use of artificial intelligence-based network infrastructure, immersive technologies such as AR/VR and holographic communication, and smart cities is spurring development. Investments by governments, roadmap for telecommunications technology in 2030, and next-gen spectrum studies are also contributing to its advancement.
Market Size and Forecast
-
Market Size in 2025: USD 8.97 Billion
-
Market Size by 2035: USD 119.78 Billion
-
CAGR: 29.59% from 2026 to 2035
-
Base Year: 2025
-
Forecast Period: 2026–2035
-
Historical Data: 2022–2024
To Get more information On 6G Market - Request Free Sample Report
6G Market Trends
-
Accelerating national 6G technology programme investment across the United States (NextG Initiative), European Union (Hexa-X and Smart Networks and Services programme), South Korea, Japan, and China, each committing billions of dollars to research, standardisation, and spectrum policy development that will collectively define global 6G technical standards.
-
Growing integration of artificial intelligence as a native architectural element within 6G network design, rather than an overlay feature as in previous wireless generations, enabling AI-driven spectrum management, traffic prediction, resource allocation, and security threat detection that continuously optimise network performance without human operator intervention.
-
Rising investment in terahertz spectrum research and component development, addressing the physical layer challenges of attenuation, beam management, and device integration that must be resolved before THz frequencies can be commercially deployed at the network densities required for 6G ultra-high-capacity applications.
-
Growing research into non-terrestrial network integration that combines 6G terrestrial base stations with Low Earth Orbit satellite constellations and High-Altitude Platform Stations to provide truly ubiquitous global coverage including oceans, polar regions, and remote rural areas currently unreachable by cellular infrastructure.
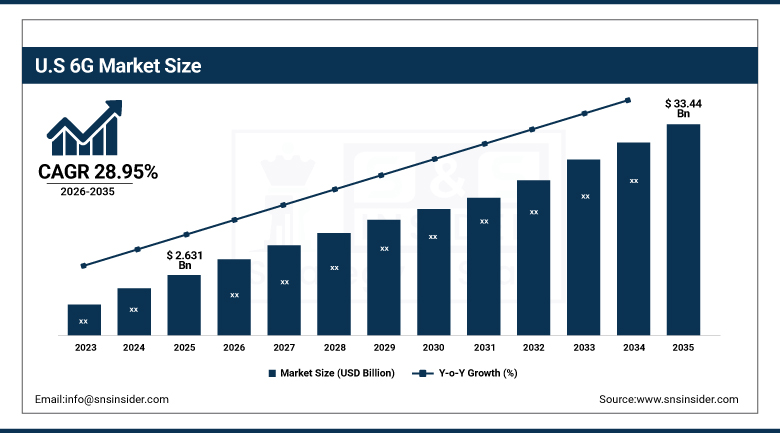
U.S. 6G Market was valued at USD 2.631 billion in 2025 and is expected to reach USD 33.44 billion by 2035, growing at a CAGR of 28.95% during 2026–2035.
The United States is a global leader in 6G technology research and commercial ecosystem development, with the National Science Foundation's Platforms for Advanced Wireless Research programme, the NTIA's NextG Initiative, and DARPA's Colosseum wireless network emulation platform collectively representing the most comprehensive government-funded 6G research infrastructure in the world. U.S. leadership is reinforced by the commercial technology investment of Qualcomm, Intel, Apple, AT&T, Verizon, and T-Mobile that are each pursuing parallel 6G research programmes to maintain their competitive positions in the next wireless generation.
The U.S. NextG Initiative coordinating government, academia, and industry 6G research through the Alliance for Telecommunications Industry Solutions, combined with NSF's USD 2.5 billion investment in wireless research platforms including the PAWR programme that provides open-access testbed infrastructure for 6G research experimentation, represents the most comprehensive national 6G investment framework among major wireless economies.
6G Market Segment Insights
-
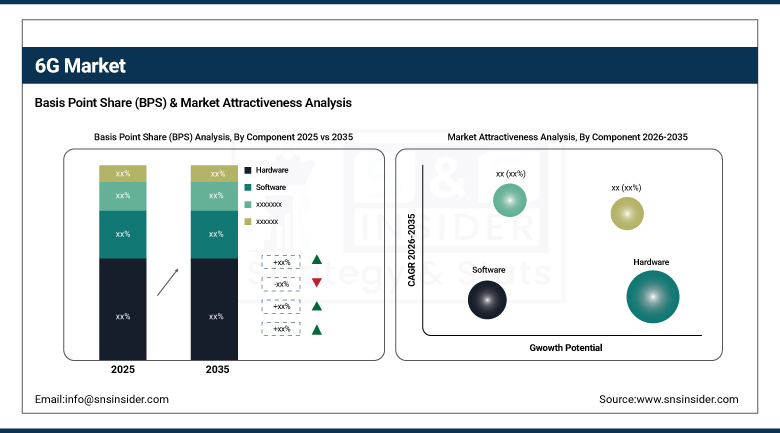
According to Component, Hardware dominated in 2025 as the primary investment category for 6G testbed and early infrastructure development; Software is projected to witness the fastest CAGR over 2026 to 2035 as 6G evolves into AI-native, self-optimising networks enabling virtualisation, real-time analytics, and secure scalable communication.
-
In terms of Communication Type, Wired Communications led with approximately 43.4% market share in 2025, driven by terahertz-based wireless research infrastructure, extensive MIMO deployment, and dense network architecture; Wireless Communications is the fastest-growing type as telecom operators focus on wireless access for early testbeds and commercial deployment.
-
By Network Infrastructure, Base Stations held a significant share in 2025 as the primary infrastructure investment category; Edge Computing is expected to register the fastest CAGR over 2026 to 2035, supporting real-time data processing and ultra-low latency for autonomous mobility, digital twins, and immersive XR applications.
-
By End-User, Telecommunications dominated in 2025 as primary 6G network operator investors; Media and Entertainment is expected to grow fastest from 2026 to 2035, fueled by demand for immersive XR streaming, holographic content, and interactive multi-sensory experiences enabled by 6G's ultra-low latency and high-speed data transmission.
6G Market Segment Analysis
By Component: Hardware dominates, Software grows fastest
Hardware retained the dominant component position in the 6G Market in 2025, reflecting the capital-intensive nature of 6G research testbed construction, antenna system development, semiconductor chip design and fabrication for terahertz frequency components, and base station prototype manufacturing that constitutes the primary commercial activity in the current pre-commercial 6G investment phase. Hardware investment encompasses massive MIMO antenna arrays, terahertz transceiver modules, intelligent reflecting surface panels, mmWave and sub-THz radio frequency components, and specialised semiconductor chips for 6G signal processing that represent the highest-value engineering investment in 6G technology development.
Software is projected to grow at the fastest CAGR through 2035, driven by the fundamental architectural shift in 6G toward cloud-native, software-defined network functions where AI and machine learning algorithms embedded in network software perform the resource management, traffic optimisation, security, and service delivery functions that hardware-centric previous generations performed through fixed-function electronics.
By Communication Type: Wired dominates in research phase, Wireless grows fastest
The Wired Communications segment led the 6G Market in 2025 with approximately 43.4% of revenues, driven by the fibre backhaul and fronthaul infrastructure investment that underpins both current 5G network densification and the research testbed connectivity that 6G wireless experimentation requires. 6G's dense network architecture, where base station spacing will decrease significantly to support terahertz frequency propagation characteristics, requires dramatically expanded fibre connectivity to connect thousands of small cells and distributed antenna systems to centralised processing infrastructure.
Wireless Communications is the fastest-growing communication type segment through 2035, as the primary innovation focus of 6G technology centres on the wireless air interface that will deliver terahertz-band peak data rates, sub-100-microsecond latency, and intelligent beamforming that defines 6G's transformative capability advantage over 5G.
By Network Infrastructure: Base Stations lead, Edge Computing grows fastest
Base Stations retained the leading network infrastructure position in 2025, reflecting their status as the central physical infrastructure element in any cellular wireless network and the primary near-term investment category as 6G site planning, spectrum research, and prototype system integration activities progress toward commercial deployment readiness. 6G base station architecture will differ fundamentally from 5G through integration of AI-native signal processing, intelligent reflecting surface coordination, terahertz frequency antenna integration at unprecedented element density, and software-defined radio functions that make base station hardware more software-configurable and upgrade-friendly than previous generations.
Edge Computing is projected to register the fastest network infrastructure CAGR through 2035, driven by 6G's fundamental architectural requirement for distributing compute intelligence close to network edges to deliver the ultra-low latency service levels that autonomous vehicles, robotic control, extended reality, and digital twin applications require. 6G edge computing encompasses Multi-access Edge Computing platforms co-located with base stations, centralised unit data centre deployments, and distributed unit processing at antenna sites that collectively create a distributed compute fabric enabling latency-critical application processing at microsecond timescales.
By End-User: Telecommunications dominate, Media and Entertainment grow fastest
Telecommunications retained the dominant end-user position in the 6G Market in 2025, reflecting that the primary 6G market participants in the current research and investment phase are telecommunications equipment vendors, network operators, and semiconductor companies that are collectively investing in the technology development that will define commercial 6G deployments. Telecom network operators including AT&T, Verizon, T-Mobile in the U.S., Deutsche Telekom, Orange, and Vodafone in Europe, and SK Telecom, NTT, and Korea Telecom in Asia are the ultimate commercial deployers of 6G infrastructure whose investment decisions will drive the largest market revenue flows once commercial deployment begins.
Media and Entertainment is expected to be the fastest-growing end-user industry from 2026 to 2035, fueled by the transformative enabling capabilities that 6G will provide for immersive extended reality streaming, holographic communication, and interactive multi-sensory entertainment experiences that are technically impossible within 5G's bandwidth, latency, and reliability constraints. Immersive XR experiences that require simultaneous high-resolution video streaming to both eyes, real-time spatial audio processing, hand and body tracking at sub-millimetre accuracy, and haptic feedback across a user's physical environment require the terabit-per-second data rates and sub-millisecond latency that only 6G can reliably deliver to mobile, untethered users at scale.
6G Market Regional Analysis
|
Region |
Major Country |
Share within Region (%) |
|---|---|---|
|
North America |
United States |
~81% |
|
Europe |
Germany |
~29% |
|
Asia Pacific |
South Korea |
~38% |
|
Middle East & Africa |
UAE |
~30% |
|
Latin America |
Brazil |
~43% |
North America 6G Market Insights
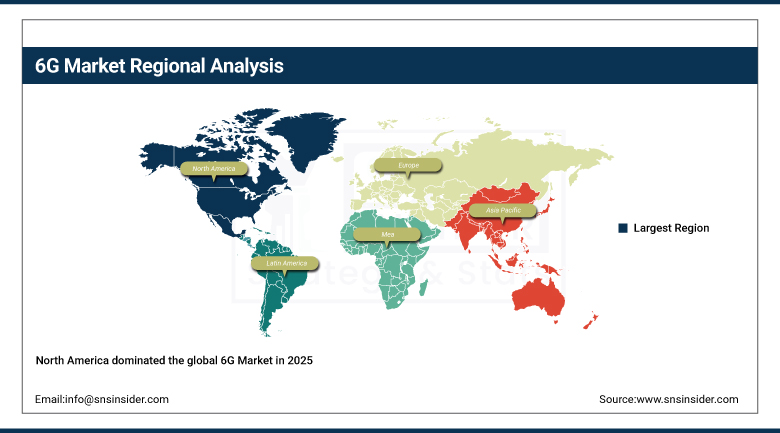
North America dominated the global 6G Market in 2025, with the United States accounting for approximately 81% of North American revenues. U.S. leadership in 6G is driven by the NextG Initiative coordinating government-academia-industry 6G research, NSF's Platforms for Advanced Wireless Research testbed programme, and the commercial technology investment of Qualcomm, Intel, Apple, AT&T, Verizon, and T-Mobile. National security priorities motivating U.S. government investment in 6G technology leadership, combined with FCC spectrum studies and CHIPS Act semiconductor investment supporting 6G chipset development, establish a comprehensive policy framework sustaining U.S. competitive advantage. North America is expected to register the fastest regional CAGR over the forecast period through its concentration of AI-native network research and standards contributions.
Get Customized Report as per Your Business Requirement - Enquiry Now
Asia Pacific 6G Market Insights
Asia Pacific is a strategically critical 6G market, home to South Korea and Japan's world-leading 6G national programmes, China's massive state-funded 6G research investment coordinated through the IMT-2030 Promotion Group, and the globally dominant 5G infrastructure vendors Samsung and Huawei whose 6G research programmes will shape commercial equipment portfolios. South Korea has committed to 6G commercial launch by 2028 to 2029, representing the most aggressive commercial deployment timeline of any major economy and motivating the most intensive near-term 6G research investment concentration globally. The Asia Pacific region accounts for approximately 38% of South Korean revenues as the leading 6G technology research economy, with Japan, China, and India each maintaining substantial independent 6G programmes.
Europe 6G Market Insights
Europe is a significant 6G research and standardisation participant, with the EU's Hexa-X and Smart Networks and Services Joint Undertaking programme committing billions of euros to 6G technology research across academic and industrial partners in all major EU member states. Nokia and Ericsson, headquartered in Finland and Sweden respectively, are among the world's most technically advanced 6G research organisations and will be major 6G commercial equipment suppliers globally. Germany, Finland, Sweden, and France lead European 6G research investment, while the European Telecommunications Standards Institute plays a central role in international 6G standardisation processes that will determine the global interoperability framework for commercial 6G deployments.
Middle East & Africa and Latin America 6G Market Insights
MEA and Latin America are establishing their 6G research positions through spectrum policy studies and academic research programmes, with the UAE and Saudi Arabia's advanced digital economy investments creating the commercial foundation for early 6G adoption when commercial deployments begin. UAE's Telecommunications and Digital Government Regulatory Authority has initiated 6G spectrum studies, while Saudi Arabia's Vision 2030 digital economy objectives include 6G readiness planning. Brazil leads Latin American 6G engagement through ANATEL's spectrum policy research and academic collaboration with international 6G research programmes, aiming to position Brazil as an early adopter of commercial 6G services when South American deployment cycles begin in the early 2030s.
Market Growth Drivers:
Exponential growth of connected devices, autonomous systems, and immersive digital experiences creating application demand that exceeds 5G's fundamental capability boundaries: The primary structural growth driver for the 6G Market is the emerging recognition that 5G, despite its transformative capabilities relative to 4G, cannot support the full performance requirements of the most demanding applications expected to define the digital economy of the 2030s and beyond. Autonomous vehicle operation requiring millisecond-latency cloud processing of multi-sensor data at every moment, holographic communication transmitting full-parallax 3D holograms in real time, digital twin synchronisation of physical infrastructure with virtual models at every scale from industrial plant to city, and the tactile internet enabling real-time remote manipulation at microsecond human-perception timescales each require capabilities that 6G's 10x to 100x improvements in latency, bandwidth, reliability, and connectivity density over 5G uniquely enable.
The convergence of national 6G programme investments across the U.S. NextG Initiative, EU Smart Networks and Services Joint Undertaking, South Korea's 6G R&D programme targeting 2028 commercial launch, Japan's Beyond 5G Promotion Consortium, and China's IMT-2030 Group collectively represents an unprecedented concentration of coordinated government and industry investment in a single wireless generation transition that reflects the extraordinary strategic and commercial importance attached to 6G technology leadership.
Market Restraints
Terahertz propagation challenges, massive infrastructure investment requirements, spectrum governance complexity, and 5G deployment completion diverting near-term investment
A significant restraint on the 6G Market is the formidable technical challenge of commercialising terahertz frequency communication, where the extremely high signal attenuation, atmospheric absorption, and limited penetration of THz waves through physical obstacles requires densely deployed base stations at spacings of tens of meters that impose massive infrastructure build costs beyond those of 5G small cell densification. The continuing global deployment of 5G networks that is consuming the majority of telecom operator capital expenditure budgets creates a direct competition for investment that will delay 6G infrastructure spending until 5G deployments reach sufficient maturity and return on investment to free capital for next-generation investment. International spectrum governance complexity, requiring 3GPP standardisation processes, ITU World Radiocommunication Conference frequency allocation decisions, and national spectrum policy coordination to align 6G spectrum access frameworks across 190-plus countries, creates multi-year policy timelines that constrain early commercial deployment flexibility.
Market Opportunities
AI-native network service management, non-terrestrial network integration, and 6G-enabled digital twin infrastructure development: The development of AI-native network management software for 6G represents the highest-margin commercial opportunity in the 6G ecosystem, as the integration of machine learning throughout the 6G protocol stack enables autonomous network optimisation services commanding premium subscription pricing relative to managed 5G network services. Non-terrestrial network integration, connecting 6G terrestrial networks with LEO satellite constellations and HAPS platforms, creates a truly global coverage layer that addresses the fundamental coverage gap of terrestrial cellular infrastructure and opens the 70% of Earth's surface currently without cellular service to 6G connectivity, expanding the addressable market for 6G services beyond urban and suburban populations. Digital twin infrastructure enabling real-time virtual replicas of cities, industrial plants, and transportation systems requires the ubiquitous, ultra-low-latency wireless connectivity that 6G provides, creating a large-scale government and industrial investment market for 6G network deployment as the enabling infrastructure for next-generation digital city governance and industrial automation.
Recent Developments:
-
2025: South Korea advanced its 6G R&D programme with increased funding for terahertz component development and AI-native network research, maintaining its commitment to commercial 6G launch by 2028 to 2029 as the world's most aggressive national 6G deployment timeline.
-
2025: Nokia and Ericsson released their respective 6G white papers and technology research reports advancing the technical framework for AI-native network architecture, terahertz communication, and non-terrestrial network integration as core 6G system design principles.
-
2025: Qualcomm demonstrated its latest terahertz communication research results at IEEE conference, advancing the physical layer modulation and beam management technology required for commercial THz-band 6G operation at practical base station densities.
6G Market Key Players
Some of the 6G Market Companies are:
-
Nokia Corporation
-
Ericsson AB
-
Huawei Technologies Co. Ltd.
-
Samsung Electronics Co. Ltd.
-
Qualcomm Technologies Inc.
-
Intel Corporation
-
AT&T Inc.
-
Verizon Communications Inc.
-
T-Mobile US Inc.
-
Deutsche Telekom AG
-
SK Telecom Co. Ltd.
-
NTT Corporation
-
ZTE Corporation
-
KDDI Corporation
-
Orange S.A.
-
Vodafone Group plc
-
Apple Inc.
-
Microsoft Corporation
-
NVIDIA Corporation
-
InterDigital Inc.
6G Market Report Scope:
| Report Attributes | Details |
|---|---|
| Market Size in 2025 | USD 8.97 Billion |
| Market Size by 2035 | USD 119.78 Billion |
| CAGR | CAGR of 29.59% From 2026 to 2035 |
| Base Year | 2025 |
| Forecast Period | 2026-2035 |
| Historical Data | 2022-2024 |
| Report Scope & Coverage | Market Size, Segments Analysis, Competitive Landscape, Regional Analysis, DROC & SWOT Analysis, Forecast Outlook |
| Key Segments | • By Component (Hardware, Software, Services) • By Communication Type (Wired, Wireless) • By Network Infrastructure (Base Stations, Small Cells, Edge Computing, Cloud Core, Others) • By End-User Industry (Telecommunications, Media and Entertainment, Automotive, Healthcare, Industrial and Manufacturing, Defense and Government, Others) |
| Regional Analysis/Coverage | North America (US, Canada), Europe (Germany, UK, France, Italy, Spain, Russia, Poland, Rest of Europe), Asia Pacific (China, India, Japan, South Korea, Australia, ASEAN Countries, Rest of Asia Pacific), Middle East & Africa (UAE, Saudi Arabia, Qatar, South Africa, Rest of Middle East & Africa), Latin America (Brazil, Argentina, Mexico, Colombia, Rest of Latin America). |
| Company Profiles | Nokia Corporation; Ericsson AB; Huawei Technologies Co. Ltd.; Samsung Electronics Co. Ltd.; Qualcomm Technologies Inc.; Intel Corporation; AT&T Inc.; Verizon Communications Inc.; T-Mobile US Inc.; Deutsche Telekom AG; SK Telecom Co. Ltd.; NTT Corporation; ZTE Corporation; KDDI Corporation; Orange S.A.; Vodafone Group plc; Apple Inc.; Microsoft Corporation; NVIDIA Corporation |
Frequently Asked Questions
Ans: North America dominated the 6G Market in 2025, led by the United States with approximately 81% of North American revenues.
Ans: Edge Computing is expected to register the fastest network infrastructure CAGR through 2035, supporting real-time data processing and ultra-low latency delivery for autonomous mobility, digital twin, and immersive XR applications.
Ans: Hardware dominated the 6G Market in 2025, reflecting the capital-intensive nature of 6G research testbed construction, terahertz component development, massive MIMO antenna system design, and base station prototype manufacturing that constitutes the primary commercial activity in the current pre-commercial 6G investment phase.
Ans: The 6G Market was valued at USD 8.97 billion in 2025.
Ans: The 6G Market is expected to grow at a CAGR of 29.59% from 2026 to 2035.
Get in Touch
