AI in Diagnostics Market Size Analysis:
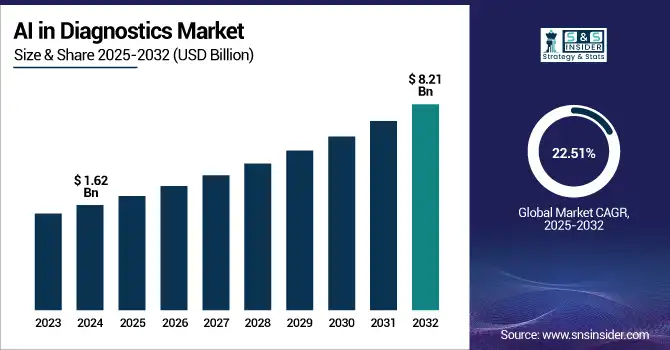
The AI in Diagnostics Market size was valued at USD 1.62 billion in 2024 and is expected to reach USD 8.21 billion by 2032, growing at a CAGR of 22.51% over the forecast period of 2025-2032.
Technological growth coupled with the growing demand for diagnostics globally, the AI in diagnostics market is soaring. As imaging data is projected to increase by over 50% annually, AI algorithms hold the key to organizing and interpreting such vast data; they can minimize the diagnostic turnaround time by up to 60%. In addition, AI models currently show 94% identification accuracy of pathologies in radiology and dermatology, which greatly advances early spotting and patient recovery. The U.S. AI in diagnostics market continues to be a major shareholder, accounting for academic hospitals and national R&D programs. R&D investment has been on the rise, with leading institutions dedicating 10–15% more budget to develop AI tools for diagnostics. Regulatory bodies have responded by implementing evaluation principles to ensure transparency, safety, and efficacy, allowing for expedited approvals of AI devices and software.
To Get more information on AI in Diagnostics Market - Request Free Sample Report
In March 2025, Mayo Clinic announced a collaboration with AI company SandboxAQ to explore the role of quantum sensing and AI with applications to medical diagnostics.
A growing incidence of chronic conditions and a graying population will also contribute to the demand, which is projected to boost diagnostic testing by an additional 20–25% over the coming years. On the other hand, supply-side growth is characterized by a growth in AI-enabled devices approvals, especially in the field of oncology, cardiology, and neurology diagnostics. Better infrastructure, cloud deployment, and standardization of interoperability are other factors enabling massive deployment. The amount of venture capital pouring into AI diagnostics companies is in the billions, reflecting positive sentiment and ensuring even more for the AI in diagnostics market growth in the future. Meanwhile, high-profile partnerships between tech titans and health systems are also propelling AI into healthcare globally.
In February 2025, Harrison. Ai announced an AI language model tuned for radiology. The tool efficiently facilitates the interpretation of imaging data, which is an important factor for radiologists when creating reports, alleviating diagnostic backlogs and increasing overall efficiency – important factors for the U.S. AI diagnostics market and broader global adoption.
AI in Diagnostics Market Dynamics:
Drivers:
-
Advancing Technology, Clinical Demand, and Strategic Collaborations Fueling AI Integration
The diagnosis AI market is driven by fast technological advancements, increasing clinical workloads, and a surge in strategic healthcare-tech collaborations. With growing patient numbers and a declining number of available physicians, the need for quicker, more precise diagnostic tools is heightened. More than 70% of healthcare providers suffer from diagnostic and administrative fatigue, leaving room for AI-based automation. On the supply side, there has been a flood of investment, more than USD 5 billion raised globally in 2024 by AI-focused health startups. Then, in January 2025, GE HealthCare unveiled a new multimodal diagnostic imaging effort, which would be infused by NVIDIA’s AI platform, highlighting increased ties between the tech and med-tech industries.
Legal institutions are also accelerating the integration speed of artificial intelligence. For instance, the FDA’s 2024 draft strategy for driving transparency and enhancing the credibility of AI/ML-based software as a medical device seeks to streamline AI approvals while preserving safety. R&D expenditure is climbing, leading diagnostics companies were devote over 12% of their annual budgets to AI-driven product development as of 2024. Meanwhile, in specialties such as oncology, cardiology, and neurology, AI technologies are already operating at clinical-grade levels of 90 %+ diagnostic accuracy. AI’s ability to save time, increase efficiency, and improve results role it in as a critical role in contemporary diagnostics. These aspects are also fundamental to the increasing uptake among hospitals, labs, and imaging centers.
Restraints:
-
Regulatory Ambiguity, Data Fragmentation, and Clinical Adoption Hurdles Market Growth
The difficult part so far has been the absence of cohesive global regulations for AI, although the FDA is making strides around AI oversight, other countries generally are not; approvals are delayed, and the path will not be consistent. In addition, AI algorithms need huge amounts of quality annotated data for training, but data silos and non-interoperable systems create obstacles to seamless integration. In a survey conducted in 2024, 61% of healthcare organizations said they find it difficult to integrate AI tools with EHR and imaging platforms. Clinician credibility is another obstacle; only 21% of healthcare executives said that AI is integrated in diagnostic workflows, citing model transparency and liability as challenges. Further, the interpretation of AI decisions represents a significant obstacle, particularly in high-risk environments such as oncology or pediatrics. That freedom of fabs is another demand restraint, and the fact that mega companies dwarf small, innovative startups in their R&D budgets and the lack of R&D funding parity constrain market democratization.
Global investment is increasing, but early-stage AI companies continue to confront difficulties in gaining access to clinical data and securing ethical clearances. Finally, data privacy legislations such as GDPR and HIPAA restrict what can and cannot be done with data, but they also limit AI model training and real-world testing. These shared challenges impose a huge but surmountable challenge to the which access to AI will be adopted for diagnoses.
AI in Diagnostics Market Segmentation Analysis:
By Component
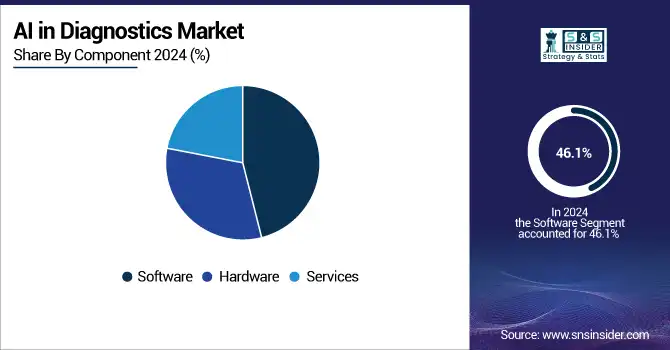
In 2024, the market was led by the software segment with a revenue AI in diagnostics market share of 46.1% in the AI in diagnostics market. This leadership is directly linked to the rise of AI-based diagnostic platforms helping analyze images, predict outcomes, and provide decision support. Growing acceptance of cloud-based solutions, deep learning algorithms, and scalable diagnostic applications in medical facilities is expected to accelerate the deployment of software. Hospitals and centers for diagnosis are looking for interoperable software that can be seamlessly integrated with electronic health records (EHRs) and imaging systems, thus increasing efficiency in terms of operations and diagnosis.
The hardware segment is expected to grow significantly during the forecast period as there is an increasing use of AI-optimized imaging devices and edge computing chips, and diagnostic sensors. There is increasing demand for high-performance GPUs and AI accelerators for real-time diagnostic and inference at the point of care, which is driving investment in this area. The developments in hardware are vital for powering new-generation AI-based diagnostic systems. The research for hardware becomes increasingly important to realize the functionalities and scalability of future AI diagnostic platforms.
By Diagnosis
The neurology segment contributed a major revenue AI in diagnostics market share in 2024, due to the increasing use of AI in analyzing intricate neuroimaging data to facilitate early detection of diseases that include Alzheimer's, epilepsy, and stroke. Given the high volume and the necessity for quick and accurate reads of neurological images, AI has become an absolute game-changer in neurology. Artificial intelligence (AI) tools can pick up even small differences in brain structure and performance, which could pave the way to early treatment and improved patient outcomes.
The oncology segment is forecasted to see the fastest growth over the forecast period. This is due mainly to the rising use of AI, for instance, in cancer diagnosis, pathology slide analysis, interpretation of genomic data, and diagnostics of breast, lung, and skin cancers. AI models have shown high sensitivity and specificity for identifying malignancies, reducing diagnostic turnaround time, and enabling personalized treatment planning. Rising incidence of cancer globally, coupled with increasing awareness about AI-led precision oncology, is further accelerating the adoption in this segment.
Regional Insights:
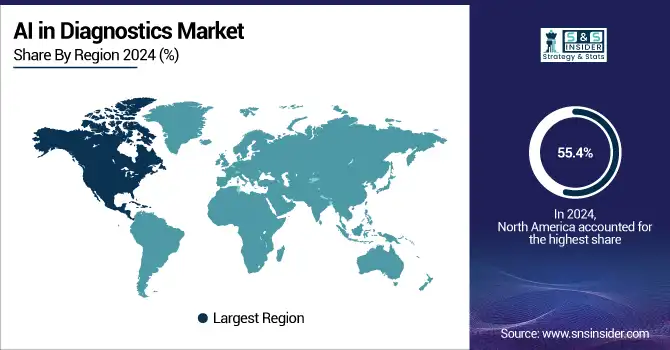
North America held the largest revenue share in the global AI in diagnostics market in 2024, with 55.4%. The U.S. AI in diagnostics market size was valued at USD 0.68 billion in 2024 and is expected to reach USD 3.17 billion by 2032, growing at a CAGR of 21.31% over the forecast period of 2025-2032, due to the country’s superior healthcare infrastructure and investment in AI R&D, and the presence of several leaders in major AI in diagnostics companies. This is also being driven by widespread regulatory support, such as FDA clearances for AI-based medical devices and diagnostic software. Canada is already participating in the growing digital health effort and AI institutes of innovation. Mexico is also stepping out with increasing telemedicine and digital diagnostics, but it is a smaller player. The U.S. is still leading thanks to high-level funding, a large number of patients suffering from disease, and its pro-active regulatory environment that allows AI technologies to be integrated in clinical workflows promptly.
Europe is the second fastest-growing AI in diagnostics market, driven by the increasing focus on digitalization in healthcare, increasing investments in AI technologies by the public and private sectors, and collaborative research in AI across countries. Germany and the UK emerge as frontrunner nations: Germany has a strong healthcare system and government investment in AI-driven innovation, and is considered to be a leader in the W.H.O AI global observatory project, while the UK gains from the NHS AI Lab and accelerates diagnostics through AI adoption. France and Italy also make significant contributions, though France is conducting more AI regulation and Italy is seeing greater AI adoption in pathology and radiology services. The fragmented nature of healthcare in Europe and strict case-control health privacy regulations are factors influencing the market scenario, favoring the proliferation of safe and ethical AI use in diagnostics.
The Asia Pacific region is projected to register the highest CAGR during the forecast period owing to the rapid digitization of healthcare across the region, increasing healthcare spending, and growing prevalence of chronic diseases. China is the region’s leader, with government programs such as “Healthy China 2030,” heavy AI investments, and a large patient population favoring less cost-intensive diagnostics. Close on its heels is India, with its increasing healthcare infrastructure and adoption of AI-driven diagnostic tools in urban and semi-urban areas. Japan and South Korea are also big contributors, boasting well-developed technology ecosystems and high R&D investment. Singapore is positioning itself as a regional AI hub of innovation. AI in diagnostics market growth is being driven by the growth of the middle class in the APAC region and the growing awareness around the potential for diagnostics using AI.
The Middle East and Africa are also emerging in the AI diagnostics market due to growing healthcare modernization initiatives, surging government investments, and the adoption of AI to combat the shortage of the healthcare workforce. The AI in diagnostics market in Latin America is growing at a steady rate, owing to increasing investments in healthcare digitization and spiking demand for advanced diagnostic products. Brazil is the leading country in the region and has a larger patient pool, rising healthcare spending, and government initiatives toward the implementation of AI-based tools for medical diagnosis.
Get Customized Report as per Your Business Requirement - Enquiry Now
AI in Diagnostics Market Key Players:
Leading AI in diagnostics companies operating in the market include Siemens Healthineers, Zebra Technologies Corp., Riverain Technologies, Vuno Inc., Aidoc, NovaSignal Corporation, Imagen, Digital Diagnostics Inc., GE Healthcare, AliveCor Inc., and F. Hoffmann-La Roche Ltd.
Recent Developments in the AI in Diagnostics Market:
-
In March 2025, Tandem Health introduced an AI-powered medical scribe in the UK to alleviate the administrative burden on doctors. This AI assistant transcribes patient consultations in real-time, generating clinical notes that can be reviewed and saved in patient records.
-
In February 2025, Cardio Diagnostics Holdings, Inc. announced partnerships with seven new provider organizations across the U.S. These collaborations aim to broaden access to their AI-powered blood tests, Epi+Gen CHD and PrecisionCHD, which combine genetic and epigenetic data to assess coronary heart disease risk.
| Report Attributes | Details |
|---|---|
| Market Size in 2024 | USD 1.62 Billion |
| Market Size by 2032 | USD 8.21 Billion |
| CAGR | CAGR of 22.51% From 2025 to 2032 |
| Base Year | 2024 |
| Forecast Period | 2025-2032 |
| Historical Data | 2021-2023 |
| Report Scope & Coverage | Market Size, Segments Analysis, Competitive Landscape, Regional Analysis, DROC & SWOT Analysis, Forecast Outlook |
| Key Segments | • By Component (Software, Hardware, and Services) |
| • By Diagnosis (Cardiology, Oncology, Pathology, Radiology, Chest and Lung, Neurology, and Others) | |
| Regional Analysis/Coverage | North America (US, Canada, Mexico), Europe (Germany, France, UK, Italy, Spain, Poland, Turkey, Rest of Europe), Asia Pacific (China, India, Japan, South Korea, Singapore, Australia, Rest of Asia Pacific), Middle East & Africa (UAE, Saudi Arabia, Qatar, South Africa, Rest of Middle East & Africa), Latin America (Brazil, Argentina, Rest of Latin America) |
| Company Profiles | Siemens Healthineers, Zebra Technologies Corp., Riverain Technologies, Vuno Inc., Aidoc, NovaSignal Corporation, Imagen, Digital Diagnostics Inc., GE Healthcare, AliveCor Inc., and F. Hoffmann-La Roche Ltd. |
Get in Touch
