Revenue Cycle Management (RCM) Market Size & Overview:

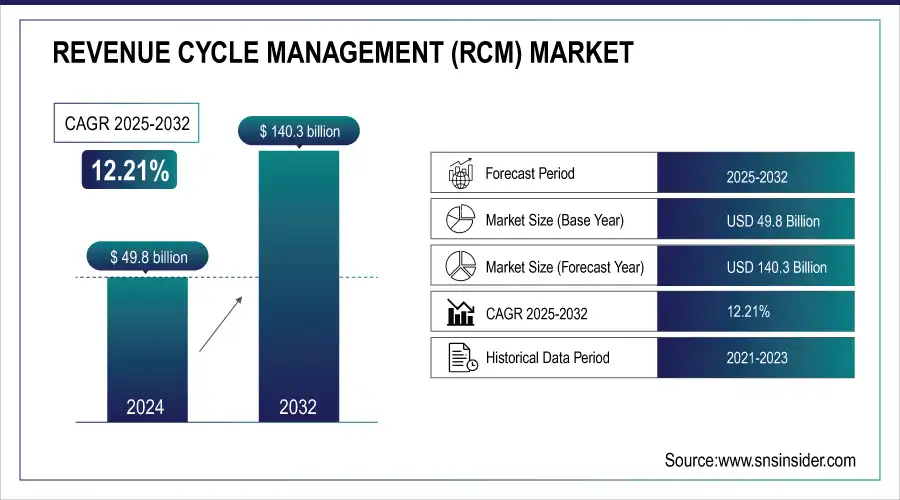
The Revenue Cycle Management Market was valued at USD 49.8 billion in 2024 and is expected to reach USD 140.3 billion by 2032, growing at a CAGR of 12.21% from 2025-2032.

Healthcare IT spending is rising rapidly due to these government initiatives, with North America leading the charge. For example, the U.S. government has committed over $30 billion in incentives under programs like the Health Information Technology for Economic and Clinical Health (HITECH) Act to encourage the adoption of digital health technologies, which includes RCM solutions. These investments are aimed at improving efficiency, reducing costs, and enhancing care quality. In addition, the expansion of public and private insurance coverage has caused the increase of insurance claims submitted, with various organizations requiring sophisticated RCM systems capable of handling such claims. 

Revenue Cycle Management Market Revenue Analysis

To get more information on Revenue Cycle Management (RCM) Market - Request Sample Report

Market data supports the trend of the increasing RCM market. Cloud-based RCM solutions are also becoming increasingly popular due to such benefits as real-time data accessibility, scalability, and reduced costs. 

Revenue-Cycle-Management-RCM-Market-US

Key Revenue Cycle Management Market Trends

  • Increasing adoption of AI and automation for coding, billing, and claims processing.

  • Growing focus on denial management and predictive analytics to reduce revenue leakage.

  • Rising demand for patient financial engagement solutions (price transparency, payment plans).

  • Expansion of telehealth and virtual care billing support due to changing care models.

  • Heightened emphasis on data security, HIPAA compliance, and cybersecurity in RCM systems.

  • Shift from fee-for-service to value-based reimbursement and risk-sharing contracts.

  • Stronger EHR–RCM integration and interoperability to streamline workflows.

  • Increasing trend of RCM outsourcing to manage staffing shortages and cost pressures.

Revenue Cycle Management Market Growth Drivers

  • The shift toward digital healthcare technologies is driving demand for RCM solutions that streamline billing and revenue management processes.

  • Incentives to modernize healthcare infrastructure, like the HITECH Act, are encouraging the adoption of advanced RCM systems.

  • The adoption of cloud-based RCM systems is increasing due to their scalability, cost-effectiveness, and real-time data access.

The growing adoption of cloud-based Revenue Cycle Management (RCM) systems is transforming how healthcare organizations manage their financial processes. A key advantage of these cloud solutions is their scalability, which allows healthcare providers to easily adapt their operations to changing patient volumes and business needs. This flexibility is essential in the healthcare environment, where requirements can fluctuate due to seasonal patterns or unforeseen circumstances. Another important benefit of cloud-based RCM systems is their cost-effectiveness. By minimizing dependence on extensive on-premises infrastructure and reducing maintenance expenses, healthcare organizations can allocate their resources more efficiently. Many cloud solutions operate on a subscription basis, enabling predictable budgeting and simplified financial management.

Furthermore, real-time data access greatly improves RCM efficiency. Healthcare providers can quickly access up-to-date information on billing, claims status, and financial performance, facilitating faster decision-making and enhancing cash flow. This immediate access to data also promotes better interdepartmental collaboration, leading to more accurate billing and fewer errors. Overall, the shift to cloud-based RCM systems is driven by these benefits, making them increasingly attractive for healthcare organizations looking to optimize their revenue cycle management.

Incentives aimed at modernizing healthcare infrastructure, such as those provided by the Health Information Technology for Economic and Clinical Health (HITECH) Act, are significantly accelerating the adoption of advanced Revenue Cycle Management (RCM) systems. Established in 2009, the HITECH Act seeks to enhance healthcare delivery through the meaningful utilization of electronic health records (EHR) and other health IT solutions. By offering financial incentives to healthcare providers who successfully implement and utilize these technologies, the Act encourages a transition from traditional, often inefficient, billing and claims processes to more sophisticated and automated systems.

Advanced RCM systems are specifically designed to improve the financial operations of healthcare organizations by enhancing billing accuracy, reducing claim denials, and streamlining revenue collection. The push for modernized infrastructure underscores the importance of integrating financial management with clinical operations, leading to a more cohesive and efficient healthcare delivery system. As healthcare organizations strive to meet the requirements of the HITECH Act and other regulatory standards, the demand for advanced RCM solutions continues to rise.

Benefits of Integrating Financial Management with Clinical Operations

Benefit Description
Improved Efficiency Streamlines processes, reducing redundancy and delays in billing and claims management.
Enhanced Data Accuracy Integrates clinical and financial data, minimizing errors in billing and coding.
Better Decision-Making Provides comprehensive insights, allowing healthcare organizations to make informed financial decisions.

This trend not only improves financial performance but also positively impacts overall patient care, making it a crucial focus for healthcare providers navigating the fast-evolving landscape of healthcare technology.

Revenue Cycle Management Market Restraints

  • Navigating the ever-changing landscape of healthcare regulations can be challenging, leading to reluctance in adopting new RCM technologies.

  • Increasing cyber threats and data breaches in healthcare raise concerns about the security of sensitive financial information in RCM systems.

  • A shortage of skilled professionals trained in advanced RCM solutions can limit effective implementation and management.

One of the most critical challenges healthcare organizations face when trying to improve their financial operations is the lack of skilled professionals in advanced Revenue Cycle Management solutions. Implementation and management of RCM systems require technological knowledge of billing, coding, and compliance with a range of healthcare regulations. When an organization’s staff are not trained in any one of these vital aspects, the timely collection of revenue effectively becomes impossible. As a result, the use of advanced RCM solutions may result in overly bureaucratic and inefficient billing practices, an increased number of claim denials, and lower rates of revenue collection. The use of highly specialized coding standards such as ICD-10 means that facilities are at the risk of not being able to stay updated and losing money in fines. Moreover, the fast pace of healthcare technology development makes the budgeting and planning of additional education and training of existing personnel challenging. Consequently, professionals who struggle to interact effectively with the implemented RCM systems may jeopardize the financial stability of the healthcare provider and fail to contribute to improving patient outcomes. With the increasing demand for advanced RCM solutions, healthcare organizations must address this challenge and seek suitable solutions.

Revenue Cycle Management Market Segment Analysis

By Product

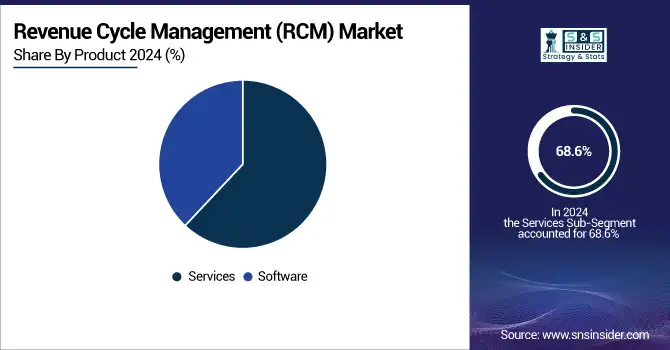
In 2024, the services segment dominated the market and represented over 68.6% revenue share. Primarily due to the increasing trend of outsourcing these services in healthcare facilities. This shift toward outsourcing is driven by the necessity for specialized resources and expertise required for the effective implementation of RCM solutions. Organizations can choose to outsource either the entire RCM process or specific components through long-term contracts, ensuring that healthcare procedures achieve maximum returns on their investments. Additionally, the growing amount of data generated across various healthcare functions is fueling the demand for process digitalization and streamlined workflows, which ultimately enhance efficiency and improve patient care. The rising prevalence of unstructured data underscores the need for consolidation, further driving the demand for RCM software solutions. The presence of multiple data silos can hinder accurate data analysis and increase the risk of data loss.

The software segment of the Revenue Cycle Management (RCM) market is projected to experience significant growth, driven by a growing demand for automated billing solutions and enhanced data analytics capabilities. As healthcare organizations aim to improve operational efficiency and reduce errors, the adoption of advanced RCM software is rapidly increasing. Furthermore, the move towards cloud-based solutions is likely to enhance both accessibility and scalability.

Revenue-Cycle-Management-RCM-Market-By-Product

By Type

In 2024, the integrated segment dominated the market, securing the largest revenue share at 71.48%, primarily due to a rising preference for volume-based payments over value-based alternatives. Integrated solutions offer a unified platform for various financial activities, enabling standardized data collection and analysis. These systems significantly improve revenue cycle management by providing numerous benefits, including enhanced collections and innovative payment and reimbursement strategies. Effective integration efforts allow healthcare professionals to boost productivity, reduce costs, increase collections, and enhance net operating margins. The integrated segment is projected to achieve the highest compound annual growth rate (CAGR) throughout the forecast period, driven by the increasing demand for efficient healthcare systems, the growth of healthcare facilities, and escalating healthcare costs. Moreover, the emphasis on minimizing human errors and streamlining administrative processes is expected to further support the expansion of integrated services.

By Delivery Mode

In 2024, the web-based segment dominated the market, accounting for the largest revenue share of 53.2%, driven by the growing adoption of web-based solutions. These solutions are increasingly favored for their cost-effectiveness and ease of deployment. Unlike on-premises alternatives, web-based options do not necessitate additional hardware or storage, permitting off-site installation and management by third parties. This shift has led to a stronger preference for web-based solutions compared to traditional on-premises systems.

The cloud-deployed segment is anticipated to grow at the fastest compound annual growth rate (CAGR) during the forecast period, owing to its superior flexibility and cost efficiency for end users. Cloud-based solutions streamline secure medical data sharing, automate backend processes, and aid in the development and safeguarding of telehealth applications. Additionally, these solutions empower healthcare institutions to effectively manage patient portals, electronic medical records, big data analytics, and mobile applications, all while eliminating the extra costs tied to server maintenance. Designed to enhance resource procurement, improve infrastructure reliability, and strengthen operational efficiency, cloud-based products are becoming increasingly vital in the healthcare sector.

By End-Use

In 2024, the physician back-office segment accounted for the largest market share of 38.2% mainly due to the increased focus on expanding the number of physicians and medical centers in the region. Private physician practices face multiple economic challenges, such as difficulties with reimbursement, increased operational costs, and worries about patient satisfaction. However, to meet these challenges, many private practices continue to outsource Revenue Cycle Management solutions and services which better fit their medical and financial needs.

The hospital segment is anticipated to show the highest CAGR during the forecast period. This trend can be explained by the fact that an increasing number of protocols and guidelines offered by regulatory bodies and aiming to improve patient safety require hospitals to adopt RCM solutions. In addition to this, the need for streamlined workflows and higher productivity is driving RCM adoption in hospitals. In general, hospital RCM systems are integrated and unified on a single platform by customers and providers. Such systems allow patients, providers, payers, and other entities to keep abreast of billed medications at the same time maintaining the comprehensive database of patient purchase history.

Revenue Cycle Management Market Regional Analysis

North America Revenue Cycle Management Market Insights

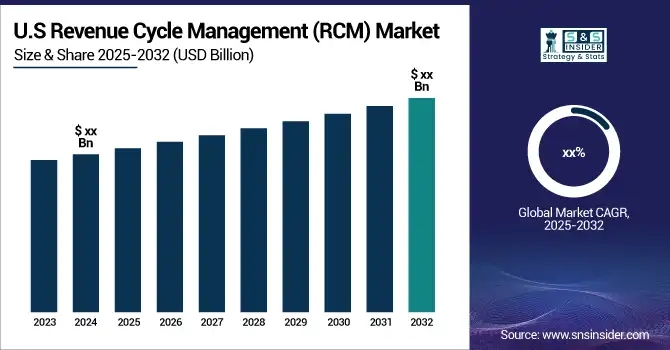
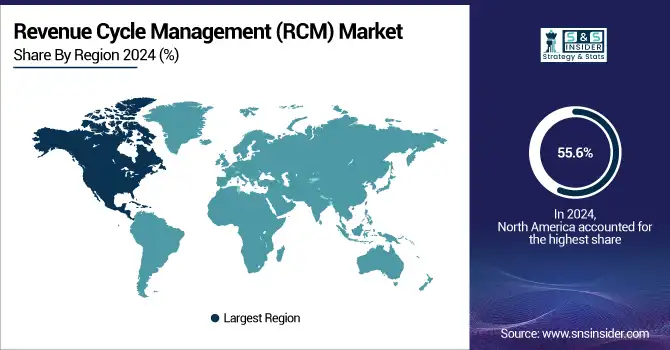
In 2024, North America dominated the market, securing the largest revenue share of 55.6%, mainly due to the rising number of physician offices in the U.S. Regulatory changes, such as the updates to ICD-10, have accelerated a digital transformation in healthcare systems, leading to a substantial increase in demand for healthcare IT solutions, including RCM systems, aimed at enhancing efficiency and improving care delivery. Moreover, the presence of large, reputable hospitals and well-established facilities, combined with the growing need to lower healthcare costs and favorable regulations, provides attractive growth opportunities in the region.

Revenue-Cycle-Management-RCM-Market-By-Region

Do you need any custom research on Revenue Cycle Management (RCM) Market - Enquiry Now

Europe Revenue Cycle Management Market Insights

In Europe, the revenue cycle management market is anticipated to experience a significant compound annual growth rate (CAGR) throughout the forecast period, fueled by supportive government policies. For instance, the European Commission's Digital Single Market Strategy facilitates consumer and business access to online services and goods across Europe, fostering an environment where digital networks and services can thrive and maximizing the growth potential of the European economy.

Germany Revenue Cycle Management Market Insights

Germany's revenue cycle management market is one of the largest in Europe, largely due to the country's high number of hospitals. The efficient and streamlined healthcare delivery system in Germany supports this growth. According to the Commonwealth Fund, about 85% of the German population is covered by Social Health Insurance (SHI), with 10% opting for substitutive private health insurance. The rising demand for digitalization, along with increased support from government and private initiatives, is expected to further drive market growth.

Asia Pacific Revenue Cycle Management Market Insights

In 2024, the Asia Pacific Revenue Cycle Management (RCM) market held nearly 20% of the global share, making it one of the fastest-growing regions. The growth is driven by rapid digital healthcare adoption, government-backed e-health programs, and rising demand for AI- and cloud-based billing solutions across key economies like China, India, and Japan. Expanding private hospital networks, increasing medical tourism, and higher healthcare spending are also fueling adoption, as providers seek cost-efficient tools to streamline billing, improve cash flows, and enhance patient financial engagement. This momentum positions Asia Pacific as a critical growth hub for RCM vendors in the coming years.

Latin America (LATAM) & Middle East & Africa (MEA) Revenue Cycle Management Market Insights

In contrast, Latin America and the Middle East & Africa (MEA) together contributed a smaller yet steadily expanding market base in 2024, Latin America’s growth is concentrated in countries like Brazil and Mexico, where hospitals are modernizing billing systems and outsourcing revenue cycle functions to improve efficiency. Meanwhile, MEA’s growth is being led by the Gulf Cooperation Council (GCC) nations, where governments are actively investing in digital health infrastructure and automation to reduce revenue leakage and strengthen healthcare delivery. Though their overall global share remains modest compared to Asia Pacific, both regions are expected to see accelerating demand for RCM solutions as healthcare providers continue to prioritize digital transformation and financial optimization.

Revenue Cycle Management Market Competitive Landscape

R1 RCM Inc.
R1 RCM Inc. is a leading provider of technology-driven revenue cycle management solutions for healthcare organizations, offering services that enhance financial performance and patient outcomes.

  • In January 2024, R1 RCM Inc. completed the acquisition of Acclara from Providence, a health systems provider. This strategic move is designed to strengthen R1’s market presence and accelerate the adoption of advanced technology solutions, ultimately improving operational efficiency and delivering better results for both patients and clients.

TELCOR
TELCOR is a prominent provider of revenue cycle management software solutions, specializing in laboratory billing and financial process optimization.

  • In July 2023, TELCOR unveiled version 21.3 of its RCM software. The release introduced enhanced web application programming interfaces (APIs), a new Report Designer, and an Executive Module, all aimed at boosting laboratory productivity, streamlining workflows, and improving collection outcomes.

Revenue Cycle Management Market Key Players

  • Optum360 - (Revenue Cycle Services, Claims Management)

  • Cerner Corporation - (RCM Solutions, Patient Billing Services)

  • McKesson Corporation - (Billing and Accounts Receivable Management, Claims Management)

  • Change Healthcare - (Revenue Cycle Analytics, Claims Lifecycle Management)

  • Athenahealth - (Cloud-Based RCM Services, Patient Engagement Solutions)

  • eClinicalWorks - (RCM Services, Revenue Cycle Optimization)

  • NextGen Healthcare - (Integrated RCM Services, Medical Billing Solutions)

  • Quest Diagnostics - (Revenue Cycle Management Services, Lab Billing Solutions)

  • Conifer Health Solutions - (Healthcare Revenue Cycle Services, Patient Access Solutions)

  • R1 RCM - (Comprehensive RCM Services, Analytics and Insights)

  • Kareo - (Medical Billing Services, RCM Solutions for Small Practices)

  • Cognizant Technology Solutions - (Healthcare RCM Services, Analytics and Consulting)

  • GeBBS Healthcare Solutions - (End-to-End RCM Services, Medical Coding Solutions)

  • Zotec Partners - (Revenue Cycle Management Solutions, Analytics and Technology)

  • NaviNet - (Healthcare RCM Solutions, Claims Management)

  • MedAptus - (RCM Software Solutions, Charge Capture Solutions)

  • Vyaire Medical - (Revenue Cycle Optimization, Patient Financial Services)

  • Streamline Healthcare Solutions - (Managed RCM Services, Medical Coding Services)

  • Vitus Health - (Complete RCM Solutions, Telehealth Billing Services)

  • Sunknowledge Services Inc. -(Healthcare RCM Services, Medical Billing and Coding)

Revenue Cycle Management (RCM) Market Report Scope:

Report Attributes Details
Market Size in 2024  USD 55.87billion
Market Size by 2032  USD 140.30 billion
CAGR   CAGR of 12.20% From 2025 to 2032
Base Year  2024
Forecast Period  2025-2032
Historical Data  2021-2023
Report Scope & Coverage Market Size, Segments Analysis, Competitive  Landscape, Regional Analysis, DROC & SWOT Analysis, Forecast Outlook
Key Segments • By Product (Software, Services)
• By Type (Integrated, Standalone)
• By Delivery Mode (Web-based, Cloud-based, On-premise)
• By End-use (Physician Back Offices, Hospitals, Diagnostic Laboratories, Other)
Regional Analysis/Coverage North America (US, Canada), Europe (Germany, France, UK, Italy, Spain, Poland, Russsia, Rest of Europe), Asia Pacific (China, India, Japan, South Korea, Australia,ASEAN Countries, Rest of Asia Pacific), Middle East & Africa (UAE, Saudi Arabia, Qatar, Egypt, South Africa, Rest of Middle East & Africa), Latin America (Brazil, Argentina,    Mexico,     Colombia Rest of Latin America)
Company Profiles Optum360, Cerner Corporation, McKesson Corporation, Change Healthcare, Athenahealth, eClinicalWorks, NextGen Healthcare, Quest Diagnostics, Conifer Health Solutions, R1 RCM, Kareo, Cognizant Technology Solutions, GeBBS Healthcare Solutions, Zotec Partners, NaviNet, MedAptus, Vyaire Medical, Streamline Healthcare Solutions, Vitus Health, Sunknowledge Services Inc.

Table Of Contents

1. Introduction

1.1 Market Definition & Scope

 1.2 Research Assumptions & Abbreviations

 1.3 Research Methodology

2. Executive Summary

2.1 Market Snapshot

 2.2 Market Absolute $ Opportunity Assessment & Y-o-Y Analysis, 2021–2032

 2.3 Market Size & Forecast, By Segmentation, 2021–2032

  2.3.1 Market Size By Product

  2.3.2 Market Size By Delivery Mode 

         2.3.3 Market Size By Type 

         2.3.4 Market Size By End-Use

 2.4 Market Share & BPS Analysis By Region, 2024

 2.5 Industry Growth Scenarios – Conservative, Likely & Optimistic

 2.6 Industry CxO’s Perspective

3. Market Overview

3.1 Market Dynamics

  3.1.1 Drivers

  3.1.2 Restraints

  3.1.3 Opportunities

  3.1.4 Key Market Trends

 3.2 Industry PESTLE Analysis

 3.3 Key Industry Forces (Porter’s) Impacting Market Growth

 3.4 Industry Life Cycle Assessment

 3.5 Parent Market Overview

 3.6 Market Risk Assessment

4. Statistical Insights & Trends Reporting

4.1 RCM Technology Evolution & Digital Maturity Roadmap

     4.2 Regulatory & Compliance Intelligence

4.3 Payer–Provider Dynamics & Reimbursement Landscape

    4.4 Operational Pain Points & Best Practices Benchmarking

    4.5 Patient-Centric Financial Engagement Models

    5. Revenue Cycle Management Market Segmental Analysis & Forecast, By Product, 2021 – 2032, Value (USD Billion)

5.1 Introduction

 5.2 Software

  5.2.1 Key Trends

  5.2.2 Market Size & Forecast, 2021 – 2032

 5.3 Services

  5.3.1 Key Trends

  5.3.2 Market Size & Forecast, 2021 – 2032

   6. Revenue Cycle Management Market Segmental Analysis & Forecast, By Delivery Mode, 2021 – 2032, Value (USD Billion)

    6.1 Introduction

 6.2 Web-based

  6.2.1 Key Trends

  6.2.2 Market Size & Forecast, 2021 – 2032

 6.3 Cloud-based

  6.3.1 Key Trends

  6.3.2 Market Size & Forecast, 2021 – 2032

    6.4 On-premise

  6.4.1 Key Trends

  6.4.2 Market Size & Forecast, 2021 – 2032

7. Revenue Cycle Management Market Segmental Analysis & Forecast, By Type , 2021 – 2032, Value (USD Billion)

    7.1 Introduction

 7.2 Integrated

  7.2.1 Key Trends

  7.2.2 Market Size & Forecast, 2021 – 2032

 7.3 Standalone

  7.3.1 Key Trends

  7.3.2 Market Size & Forecast, 2021 – 2032

8. Revenue Cycle Management Market Segmental Analysis & Forecast, By End-Use, 2021 – 2032, Value (USD Billion)

    8.1 Introduction

 8.2 Physician Back Offices

  8.2.1 Key Trends

  8.2.2 Market Size & Forecast, 2021 – 2032

 8.3 Hospitals

  8.3.1 Key Trends

  8.3.2 Market Size & Forecast, 2021 – 2032

 8.4 Diagnostic Laboratories

  8.4.1 Key Trends

  8.4.2 Market Size & Forecast, 2021 – 2032

 8.5 Other

  8.5.1 Key Trends

  8.5.2 Market Size & Forecast, 2021 – 2032

 9. Revenue Cycle Management Market Segmental Analysis & Forecast by Region, 2021 – 2025, Value (USD Billion)

9.1 Introduction

9.2 North America

 9.2.1 Key Trends

 9.2.2 Revenue Cycle Management Market Size & Forecast, By Product, 2021 – 2032

 9.2.3 Revenue Cycle Management Market Size & Forecast, By Delivery Mode  , 2021 – 2032

 9.2.4 Revenue Cycle Management Market Size & Forecast, By Type,  2021 – 2032

 9.2.5 Revenue Cycle Management Market Size & Forecast, By End-Use, 2021 – 2032

 9.2.6 Revenue Cycle Management Market Size & Forecast, By Country, 2021 – 2032

  9.2.6.1 USA

   9.2.6.1.1 Revenue Cycle Management Market Size & Forecast, By Product, 2021 – 2032

   9.2.6.1.2 Revenue Cycle Management Market Size & Forecast, By Delivery Mode  , 2021 – 2032

   9.2.6.1.3 Revenue Cycle Management Market Size & Forecast, By Type,  2021 – 2032

   9.2.6.1.4 Revenue Cycle Management Market Size & Forecast, By End-Use, 2021 – 2032

  9.2.6.2 Canada

   9.2.6.2.1 Revenue Cycle Management Market Size & Forecast, By Product, 2021 – 2032

   9.2.6.2.2 Revenue Cycle Management Market Size & Forecast, By Delivery Mode  , 2021 – 2032

   9.2.6.2.3 Revenue Cycle Management Market Size & Forecast, By Type,  2021 – 2032

   9.2.6.2.4 Revenue Cycle Management Market Size & Forecast, By End-Use, 2021 – 2032

9.3 Europe

 9.3.1 Key Trends

 9.3.2 Revenue Cycle Management Market Size & Forecast, By Product, 2021 – 2032

 9.3.3 Revenue Cycle Management Market Size & Forecast, By Delivery Mode  , 2021 – 2032

 9.3.4 Revenue Cycle Management Market Size & Forecast, By Type,  2021 – 2032

 9.3.5 Revenue Cycle Management Market Size & Forecast, By End-Use, 2021 – 2032

 9.3.6 Revenue Cycle Management Market Size & Forecast, By Country, 2021 – 2032

  9.3.6.1 Germany

   9.3.6.1.1 Revenue Cycle Management Market Size & Forecast, By Product, 2021 – 2032

   9.3.6.1.2 Revenue Cycle Management Market Size & Forecast, By Delivery Mode  , 2021 – 2032

   9.3.6.1.3 Revenue Cycle Management Market Size & Forecast, By Type,  2021 – 2032

   9.3.6.1.4 Revenue Cycle Management Market Size & Forecast, By End-Use, 2021 – 2032

  9.3.6.2 UK

   9.3.6.2.1 Revenue Cycle Management Market Size & Forecast, By Product, 2021 – 2032

   9.3.6.2.2 Revenue Cycle Management Market Size & Forecast, By Delivery Mode  , 2021 – 2032

   9.3.6.2.3 Revenue Cycle Management Market Size & Forecast, By Type,  2021 – 2032

   9.3.6.2.4 Revenue Cycle Management Market Size & Forecast, By End-Use, 2021 – 2032

  9.3.6.3 France

   9.3.6.3.1 Revenue Cycle Management Market Size & Forecast, By Product, 2021 – 2032

   9.3.6.3.2 Revenue Cycle Management Market Size & Forecast, By Delivery Mode  , 2021 – 2032

   9.3.6.3.3 Revenue Cycle Management Market Size & Forecast, By Type,  2021 – 2032

   9.3.6.3.4 Revenue Cycle Management Market Size & Forecast, By End-Use, 2021 – 2032

  9.3.6.4 Italy

   9.3.6.4.1 Revenue Cycle Management Market Size & Forecast, By Product, 2021 – 2032

   9.3.6.4.2 Revenue Cycle Management Market Size & Forecast, By Delivery Mode  , 2021 – 2032

   9.3.6.4.3 Revenue Cycle Management Market Size & Forecast, By Type,  2021 – 2032

   9.3.6.4.4 Revenue Cycle Management Market Size & Forecast, By End-Use, 2021 – 2032

  9.3.6.5 Spain

   9.3.6.5.1 Revenue Cycle Management Market Size & Forecast, By Product, 2021 – 2032

   9.3.6.5.2 Revenue Cycle Management Market Size & Forecast, By Delivery Mode  , 2021 – 2032

   9.3.6.5.3 Revenue Cycle Management Market Size & Forecast, By Type,  2021 – 2032

   9.3.6.5.4 Revenue Cycle Management Market Size & Forecast, By End-Use, 2021 – 2032

  9.3.6.6 Russia

   9.3.6.6.1 Revenue Cycle Management Market Size & Forecast, By Product, 2021 – 2032

   9.3.6.6.2 Revenue Cycle Management Market Size & Forecast, By Delivery Mode  , 2021 – 2032

   9.3.6.6.3 Revenue Cycle Management Market Size & Forecast, By Type,  2021 – 2032

   9.3.6.6.4 Revenue Cycle Management Market Size & Forecast, By End-Use, 2021 – 2032

  9.3.6.7 Poland

   9.3.6.7.1 Revenue Cycle Management Market Size & Forecast, By Product, 2021 – 2032

   9.3.6.7.2 Revenue Cycle Management Market Size & Forecast, By Delivery Mode  , 2021 – 2032

   9.3.6.7.3 Revenue Cycle Management Market Size & Forecast, By Type,  2021 – 2032

   9.3.6.7.4 Revenue Cycle Management Market Size & Forecast, By End-Use, 2021 – 2032

  9.3.6.8 Rest of Europe

   9.3.6.8.1 Revenue Cycle Management Market Size & Forecast, By Product, 2021 – 2032

   9.3.6.8.2 Revenue Cycle Management Market Size & Forecast, By Delivery Mode  , 2021 – 2032

   9.3.6.8.3 Revenue Cycle Management Market Size & Forecast, By Type,  2021 – 2032

   9.3.6.8.4 Revenue Cycle Management Market Size & Forecast, By End-Use, 2021 – 2032   

9.4 Asia-Pacific

 9.4.1 Key Trends

 9.4.2 Revenue Cycle Management Market Size & Forecast, By Product, 2021 – 2032

 9.4.3 Revenue Cycle Management Market Size & Forecast, By Delivery Mode  , 2021 – 2032

 9.4.4 Revenue Cycle Management Market Size & Forecast, By Type,  2021 – 2032

 9.4.5 Revenue Cycle Management Market Size & Forecast, By End-Use, 2021 – 2032

 9.4.6 Revenue Cycle Management Market Size & Forecast, By Country, 2021 – 2032

  9.4.6.1 China

   9.4.6.1.1 Revenue Cycle Management Market Size & Forecast, By Product, 2021 – 2032

   9.4.6.1.2 Revenue Cycle Management Market Size & Forecast, By Delivery Mode  , 2021 – 2032

   9.4.6.1.3 Revenue Cycle Management Market Size & Forecast, By Type,  2021 – 2032

   9.4.6.1.4 Revenue Cycle Management Market Size & Forecast, By End-Use, 2021 – 2032

  9.4.6.2 India

   9.4.6.2.1 Revenue Cycle Management Market Size & Forecast, By Product, 2021 – 2032

   9.4.6.2.2 Revenue Cycle Management Market Size & Forecast, By Delivery Mode  , 2021 – 2032

   9.4.6.2.3 Revenue Cycle Management Market Size & Forecast, By Type,  2021 – 2032

   9.4.6.2.4 Revenue Cycle Management Market Size & Forecast, By End-Use, 2021 – 2032

  9.4.6.3 Japan

   9.4.6.3.1 Revenue Cycle Management Market Size & Forecast, By Product, 2021 – 2032

   9.4.6.3.2 Revenue Cycle Management Market Size & Forecast, By Delivery Mode  , 2021 – 2032

   9.4.6.3.3 Revenue Cycle Management Market Size & Forecast, By Type,  2021 – 2032

   9.4.6.3.4 Revenue Cycle Management Market Size & Forecast, By End-Use, 2021 – 2032

  9.4.6.4 South Korea

   9.4.6.4.1 Revenue Cycle Management Market Size & Forecast, By Product, 2021 – 2032

   9.4.6.4.2 Revenue Cycle Management Market Size & Forecast, By Delivery Mode  , 2021 – 2032

   9.4.6.4.3 Revenue Cycle Management Market Size & Forecast, By Type,  2021 – 2032

   9.4.6.4.4 Revenue Cycle Management Market Size & Forecast, By End-Use, 2021 – 2032

  9.4.6.5 Australia

   9.4.6.5.1 Revenue Cycle Management Market Size & Forecast, By Product, 2021 – 2032

   9.4.6.5.2 Revenue Cycle Management Market Size & Forecast, By Delivery Mode, 2021 – 2032

   9.4.6.5.3 Revenue Cycle Management Market Size & Forecast, By Type, 2021 – 2032

   9.4.6.5.4 Revenue Cycle Management Market Size & Forecast, By End-Use, 2021 – 2032

  9.4.6.6 ASEAN Countries

   9.4.6.6.1 Revenue Cycle Management Market Size & Forecast, By Product, 2021 – 2032

   9.4.6.6.2 Revenue Cycle Management Market Size & Forecast, By Delivery Mode, 2021 – 2032

   9.4.6.6.3 Revenue Cycle Management Market Size & Forecast, By Type,  2021 – 2032

   9.4.6.6.4 Revenue Cycle Management Market Size & Forecast, By End-Use, 2021 – 2032

  9.4.6.7 Rest of Asia-Pacific

   9.4.6.7.1 Revenue Cycle Management Market Size & Forecast, By Product, 2021 – 2032

   9.4.6.7.2 Revenue Cycle Management Market Size & Forecast, By Delivery Mode  , 2021 – 2032

   9.4.6.7.3 Revenue Cycle Management Market Size & Forecast, By Type,  2021 – 2032

   9.4.6.7.4 Revenue Cycle Management Market Size & Forecast, By End-Use, 2021 – 2032

9.5 Latin America

 9.5.1 Key Trends

 9.5.2 Revenue Cycle Management Market Size & Forecast, By Product, 2021 – 2032

 9.5.3 Revenue Cycle Management Market Size & Forecast, By Delivery Mode  , 2021 – 2032

 9.5.4 Revenue Cycle Management Market Size & Forecast, By Type,  2021 – 2032

 9.5.5 Revenue Cycle Management Market Size & Forecast, By End-Use, 2021 – 2032

 9.5.6 Revenue Cycle Management Market Size & Forecast, By Country, 2021 – 2032

  9.5.6.1 Brazil

   9.5.6.1.1 Revenue Cycle Management Market Size & Forecast, By Product, 2021 – 2032

   9.5.6.1.2 Revenue Cycle Management Market Size & Forecast, By Delivery Mode  , 2021 – 2032

   9.5.6.1.3 Revenue Cycle Management Market Size & Forecast, By Type,  2021 – 2032

   9.5.6.1.4 Revenue Cycle Management Market Size & Forecast, By End-Use, 2021 – 2032

  9.5.6.2 Argentina

   9.5.6.2.1 Revenue Cycle Management Market Size & Forecast, By Product, 2021 – 2032

   9.5.6.2.2 Revenue Cycle Management Market Size & Forecast, By Delivery Mode  , 2021 – 2032

   9.5.6.2.3 Revenue Cycle Management Market Size & Forecast, By Type,  2021 – 2032

   9.5.6.2.4 Revenue Cycle Management Market Size & Forecast, By End-Use, 2021 – 2032

  9.5.6.3 Mexico

   9.5.6.3.1 Revenue Cycle Management Market Size & Forecast, By Product, 2021 – 2032

   9.5.6.3.2 Revenue Cycle Management Market Size & Forecast, By Delivery Mode  , 2021 – 2032

   9.5.6.3.3 Revenue Cycle Management Market Size & Forecast, By Type,  2021 – 2032

   9.5.6.3.4 Revenue Cycle Management Market Size & Forecast, By End-Use, 2021 – 2032

  9.5.6.4 Colombia

   9.5.6.4.1 Revenue Cycle Management Market Size & Forecast, By Product, 2021 – 2032

   9.5.6.4.2 Revenue Cycle Management Market Size & Forecast, By Delivery Mode  , 2021 – 2032

   9.5.6.4.3 Revenue Cycle Management Market Size & Forecast, By Type,  2021 – 2032

   9.5.6.4.4 Revenue Cycle Management Market Size & Forecast, By End-Use, 2021 – 2032

  9.5.6.5 Rest of Latin America

   9.5.6.5.1 Revenue Cycle Management Market Size & Forecast, By Product, 2021 – 2032

   9.5.6.5.2 Revenue Cycle Management Market Size & Forecast, By Delivery Mode, 2021 – 2032

   9.5.6.5.3 Revenue Cycle Management Market Size & Forecast, By Type, 2021 – 2032

   9.5.6.5.4 Revenue Cycle Management Market Size & Forecast, By End-Use, 2021 – 2032

9.6 Middle East & Africa

 9.6.1 Key Trends

 9.6.2 Revenue Cycle Management Market Size & Forecast, By Product, 2021 – 2032

 9.6.3 Revenue Cycle Management Market Size & Forecast, By Delivery Mode, 2021 – 2032

 9.6.4 Revenue Cycle Management Market Size & Forecast, By Type,  2021 – 2032

 9.6.5 Revenue Cycle Management Market Size & Forecast, By End-Use, 2021 – 2032

 9.6.6 Revenue Cycle Management Market Size & Forecast, By Country, 2021 – 2032

  9.6.6.1 UAE

   9.6.6.1.1 Revenue Cycle Management Market Size & Forecast, By Product, 2021 – 2032

   9.6.6.1.2 Revenue Cycle Management Market Size & Forecast, By Delivery Mode, 2021 – 2032

   9.6.6.1.3 Revenue Cycle Management Market Size & Forecast, By Type, 2021 – 2032

   9.6.6.1.4 Revenue Cycle Management Market Size & Forecast, By End-Use, 2021 – 2032

  9.6.6.2 Saudi Arabia

   9.6.6.2.1 Revenue Cycle Management Market Size & Forecast, By Product, 2021 – 2032

   9.6.6.2.2 Revenue Cycle Management Market Size & Forecast, By Delivery Mode , 2021 – 2032

   9.6.6.2.3 Revenue Cycle Management Market Size & Forecast, By Type, 2021 – 2032

   9.6.6.2.4 Revenue Cycle Management Market Size & Forecast, By End-Use, 2021 – 2032

  9.6.6.3 Qatar

   9.6.6.3.1 Revenue Cycle Management Market Size & Forecast, By Product, 2021 – 2032

   9.6.6.3.2 Revenue Cycle Management Market Size & Forecast, By Delivery Mode, 2021 – 2032

   9.6.6.3.3 Revenue Cycle Management Market Size & Forecast, By Type, 2021 – 2032

   9.6.6.3.4 Revenue Cycle Management Market Size & Forecast, By End-Use, 2021 – 2032

  9.6.6.4 Egypt

   9.6.6.4.1 Revenue Cycle Management Market Size & Forecast, By Product, 2021 – 2032

   9.6.6.4.2 Revenue Cycle Management Market Size & Forecast, By Delivery Mode, 2021 – 2032

   9.6.6.4.3 Revenue Cycle Management Market Size & Forecast, By Type, 2021 – 2032

   9.6.6.4.4 Revenue Cycle Management Market Size & Forecast, By End-Use, 2021 – 2032

  9.6.6.5 South Africa

   9.6.6.5.1 Revenue Cycle Management Market Size & Forecast, By Product, 2021 – 2032

   9.6.6.5.2 Revenue Cycle Management Market Size & Forecast, By Delivery Mode, 2021 – 2032

   9.6.6.5.3 Revenue Cycle Management Market Size & Forecast, By Type, 2021 – 2032

   9.6.6.5.4 Revenue Cycle Management Market Size & Forecast, By End-Use, 2021 – 2032

  9.6.6.6 Rest of Middle East & Africa

   9.6.6.6.1 Revenue Cycle Management Market Size & Forecast, By Product, 2021 – 2032

   9.6.6.6.2 Revenue Cycle Management Market Size & Forecast, By Delivery Mode, 2021 – 2032

   9.6.6.6.3 Revenue Cycle Management Market Size & Forecast, By Type, 2021 – 2032

   9.6.6.6.4 Revenue Cycle Management Market Size & Forecast, By End-Use, 2021 – 2032

10. Competitive Landscape

 10.1 Key Players' Positioning

 10.2 Competitive Developments

  10.2.1 Key Strategies Adopted (%), By Key Players, 2024

  10.2.2 Year-Wise Strategies & Development, 2021 – 2025

  10.2.3 Number of Strategies Adopted by Key Players, 2024

 10.3 Market Share Analysis, 2024

 10.4 Product/Service & End-Use Industry Benchmarking

  10.4.1 Product/Service Specifications & Features By Key Players

  10.4.2 Product/Service Heatmap By Key Players

  10.4.3 End-Use Industry Heatmap By Key Players

 10.5 Industry Start-Up & Innovation Landscape

10.6 Key Company Profiles

 10.6.1 Optum360

  10.6.1.1 Company Overview & Snapshot

  10.6.1.2 Product/Service Portfolio

  10.6.1.3 Key Company Financials

  10.6.1.4 SWOT Analysis

 10.6.2 Cerner Corporation

  10.6.2.1 Company Overview & Snapshot

  10.6.2.2 Product/Service Portfolio

  10.6.2.3 Key Company Financials

  10.6.2.4 SWOT Analysis

 10.6.3 McKesson Corporation

  10.6.3.1 Company Overview & Snapshot

  10.6.3.2 Product/Service Portfolio

  10.6.3.3 Key Company Financials

  10.6.3.4 SWOT Analysis

 10.6.4 Change Healthcare

  10.6.4.1 Company Overview & Snapshot

  10.6.4.2 Product/Service Portfolio

  10.6.4.3 Key Company Financials

  10.6.4.4 SWOT Analysis

 10.6.5 Athenahealth

  10.6.5.1 Company Overview & Snapshot

  10.6.5.2 Product/Service Portfolio

  10.6.5.3 Key Company Financials

  10.6.5.4 SWOT Analysis

 10.6.6 eClinicalWorks

  10.6.6.1 Company Overview & Snapshot

  10.6.6.2 Product/Service Portfolio

  10.6.6.3 Key Company Financials

  10.6.6.4 SWOT Analysis

 10.6.7 NextGen Healthcare

  10.6.7.1 Company Overview & Snapshot

  10.6.7.2 Product/Service Portfolio

  10.6.7.3 Key Company Financials

  10.6.7.4 SWOT Analysis

 10.6.8 Quest Diagnostics

  10.6.8.1 Company Overview & Snapshot

  10.6.8.2 Product/Service Portfolio

  10.6.8.3 Key Company Financials

  10.6.8.4 SWOT Analysis

 10.6.9 Conifer Health Solutions

  10.6.9.1 Company Overview & Snapshot

  10.6.9.2 Product/Service Portfolio

  10.6.9.3 Key Company Financials

  10.6.9.4 SWOT Analysis

 10.6.10 R1 RCM

  10.6.10.1 Company Overview & Snapshot

  10.6.10.2 Product/Service Portfolio

  10.6.10.3 Key Company Financials

  10.6.10.4 SWOT Analysis

 10.6.11 Kareo

  10.6.11.1 Company Overview & Snapshot

  10.6.11.2 Product/Service Portfolio

  10.6.11.3 Key Company Financials

  10.6.11.4 SWOT Analysis

 10.6.12 Cognizant Technology Solutions

  10.6.12.1 Company Overview & Snapshot

  10.6.12.2 Product/Service Portfolio

  10.6.12.3 Key Company Financials

  10.6.12.4 SWOT Analysis

 10.6.13 GeBBS Healthcare Solutions

  10.6.13.1 Company Overview & Snapshot

  10.6.13.2 Product/Service Portfolio

  10.6.13.3 Key Company Financials

  10.6.13.4 SWOT Analysis

10.6.14 Zotec Partners

  10.6.14.1 Company Overview & Snapshot

  10.6.14.2 Product/Service Portfolio

  10.6.14.3 Key Company Financials

  10.6.14.4 SWOT Analysis

 10.6.15 NaviNet

  10.6.15.1 Company Overview & Snapshot

  10.6.15.2 Product/Service Portfolio

  10.6.15.3 Key Company Financials

  10.6.15.4 SWOT Analysis

 10.6.16 MedAptus

  10.6.16.1 Company Overview & Snapshot

  10.6.16.2 Product/Service Portfolio

  10.6.16.3 Key Company Financials

  10.6.16.4 SWOT Analysis

 10.6.17 Vyaire Medical

  10.6.17.1 Company Overview & Snapshot

  10.6.17.2 Product/Service Portfolio

  10.6.17.3 Key Company Financials

  10.6.17.4 SWOT Analysis

 10.6.18 Streamline Healthcare Solutions

  10.6.18.1 Company Overview & Snapshot

  10.6.18.2 Product/Service Portfolio

  10.6.18.3 Key Company Financials

  10.6.18.4 SWOT Analysis

 10.6.19 Vitus Health

  10.6.19.1 Company Overview & Snapshot

  10.6.19.2 Product/Service Portfolio

  10.6.19.3 Key Company Financials

  10.6.19.4 SWOT Analysis

 10.6.20 Sunknowledge Services Inc.

  10.6.20.1 Company Overview & Snapshot

  10.6.20.2 Product/Service Portfolio

  10.6.20.3 Key Company Financials

  10.6.20.4 SWOT Analysis

11. Analyst Recommendations

 11.1 SNS Insider Opportunity Map

 11.2 Industry Low-Hanging Fruit Assessment

 11.3 Market Entry & Growth Strategy

 11.4 Analyst Viewpoint & Suggestions On Market Growth

12. Assumptions

13. Disclaimer

14. Appendix

 14.1 List Of Tables

 14.2 List Of Figures

Key Segments:

By Product

  • Software

  • Services

 By Delivery Mode  

  • Web-based

  • Cloud-based

  • On-premise

 By Type

  • Integrated

  • Standalone

By End-Use

  • Physician Back Offices

  • Hospitals

  • Diagnostic Laboratories

  • Other


Request for Segment Customization as per your Business Requirement: Segment Customization Request


Regional Coverage: 

North America

  • US

  • Canada

Europe

  • Germany

  • UK

  • France

  • Italy

  • Spain

  • Russia

  • Poland

  • Rest of Europe

Asia Pacific

  • China

  • India

  • Japan

  • South Korea

  • ASEAN Countries

  • Australia

  • Rest of Asia Pacific

Latin America

  • Brazil

  • Argentina

  • Mexico

  • Colombia

  • Rest of Latin America

Middle East & Africa

  • UAE

  • Saudi Arabia

  • Qatar

  • Egypt

  • South Africa

  • Rest of Middle East & Africa

Request for Country Level Research Report: Country Level Customization Request

Available Customization 

With the given market data, SNS Insider offers customization as per the company’s specific needs. The following customization options are available for the report: 

  • Detailed Volume Analysis 

  • Criss-Cross segment analysis (e.g. Product X Application) 

  • Competitive Product Benchmarking 

  • Geographic Analysis 

  • Additional countries in any of the regions 

  • Customized Data Representation 

  • Detailed analysis and profiling of additional market players

An accurate research report requires proper strategizing as well as implementation. There are multiple factors involved in the completion of good and accurate research report and selecting the best methodology to compete the research is the toughest part. Since the research reports we provide play a crucial role in any company’s decision-making process, therefore we at SNS Insider always believe that we should choose the best method which gives us results closer to reality. This allows us to reach at a stage wherein we can provide our clients best and accurate investment to output ratio.

Each report that we prepare takes a timeframe of 350-400 business hours for production. Starting from the selection of titles through a couple of in-depth brain storming session to the final QC process before uploading our titles on our website we dedicate around 350 working hours. The titles are selected based on their current market cap and the foreseen CAGR and growth.


The 5 steps process:

Step 1: Secondary Research:

Secondary Research or Desk Research is as the name suggests is a research process wherein, we collect data through the readily available information. In this process we use various paid and unpaid databases which our team has access to and gather data through the same. This includes examining of listed companies’ annual reports, Journals, SEC filling etc. Apart from this our team has access to various associations across the globe across different industries. Lastly, we have exchange relationships with various university as well as individual libraries.

Secondary Research

Step 2: Primary Research

When we talk about primary research, it is a type of study in which the researchers collect relevant data samples directly, rather than relying on previously collected data.  This type of research is focused on gaining content specific facts that can be sued to solve specific problems. Since the collected data is fresh and first hand therefore it makes the study more accurate and genuine.

We at SNS Insider have divided Primary Research into 2 parts.

Part 1 wherein we interview the KOLs of major players as well as the upcoming ones across various geographic regions. This allows us to have their view over the market scenario and acts as an important tool to come closer to the accurate market numbers. As many as 45 paid and unpaid primary interviews are taken from both the demand and supply side of the industry to make sure we land at an accurate judgement and analysis of the market.

This step involves the triangulation of data wherein our team analyses the interview transcripts, online survey responses and observation of on filed participants. The below mentioned chart should give a better understanding of the part 1 of the primary interview.

Primary Research

Part 2: In this part of primary research the data collected via secondary research and the part 1 of the primary research is validated with the interviews from individual consultants and subject matter experts.

Consultants are those set of people who have at least 12 years of experience and expertise within the industry whereas Subject Matter Experts are those with at least 15 years of experience behind their back within the same space. The data with the help of two main processes i.e., FGDs (Focused Group Discussions) and IDs (Individual Discussions). This gives us a 3rd party nonbiased primary view of the market scenario making it a more dependable one while collation of the data pointers.

Step 3: Data Bank Validation

Once all the information is collected via primary and secondary sources, we run that information for data validation. At our intelligence centre our research heads track a lot of information related to the market which includes the quarterly reports, the daily stock prices, and other relevant information. Our data bank server gets updated every fortnight and that is how the information which we collected using our primary and secondary information is revalidated in real time.

Data Bank Validation

Step 4: QA/QC Process

After all the data collection and validation our team does a final level of quality check and quality assurance to get rid of any unwanted or undesired mistakes. This might include but not limited to getting rid of the any typos, duplication of numbers or missing of any important information. The people involved in this process include technical content writers, research heads and graphics people. Once this process is completed the title gets uploader on our platform for our clients to read it.

Step 5: Final QC/QA Process:

This is the last process and comes when the client has ordered the study. In this process a final QA/QC is done before the study is emailed to the client. Since we believe in giving our clients a good experience of our research studies, therefore, to make sure that we do not lack at our end in any way humanly possible we do a final round of quality check and then dispatch the study to the client.