AI Laptop Market Report Scope & Overview:
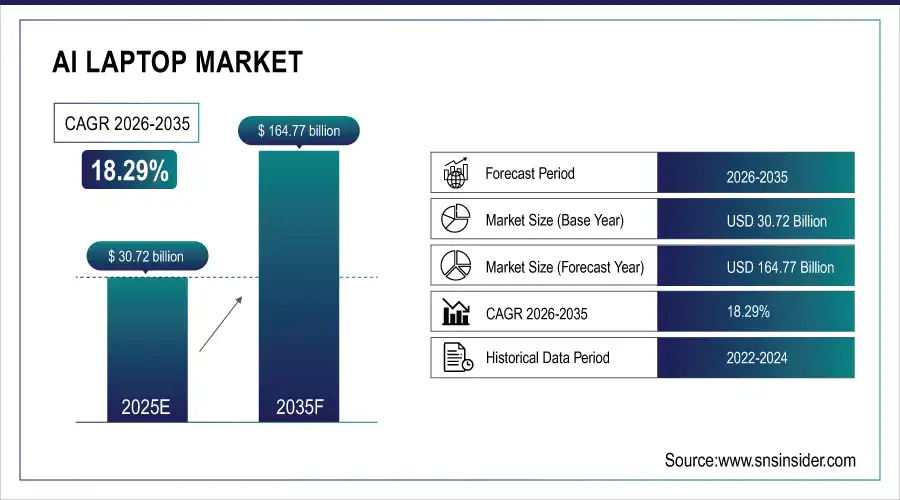
The AI Laptop Market was valued at USD 30.72 billion in 2025 and is expected to reach USD 164.77 billion by 2035, growing at a CAGR of 18.29% from 2026-2035.
AI Laptop Market growth is fueled by driven by the increasing incorporation of on-device artificial intelligence capabilities, including generative AI processing, real-time language translation, facial recognition, intelligent power management, and more. Heavyweights such as Intel, AMD, NVIDIA, and Qualcomm are integrating NPUs (Neural Processing Units) into their chipsets, which will allow support for a wider range of AI workloads on-device and not cloud-based. In creative industries, gaming, education, and enterprise space, the demand is also to seize productivity enhancement, personalization, and performance.
AI Laptop Market Size and Forecast
-
Market Size in 2025: USD 30.72 Billion
-
Market Size by 2035: USD 164.77 Billion
-
CAGR: 18.29% from 2026 to 2035
-
Base Year: 2025
-
Forecast Period: 2026–2035
-
Historical Data: 2022–2024
To Get more information On AI Laptop Market - Request Free Sample Report
AI Laptop Market Trends
-
Rising demand for high-performance computing and AI-enabled applications is driving the AI laptop market.
-
Growing adoption in gaming, content creation, data science, and enterprise AI workloads is boosting market growth.
-
Expansion of machine learning, deep learning, and edge AI applications is fueling deployment.
-
Increasing focus on enhanced processing power, energy efficiency, and portability is shaping adoption trends.
-
Advancements in AI chips, GPUs, and neural processing units (NPUs) are improving performance and user experience.
-
Rising investments in AI research, remote work, and digital learning are supporting market expansion.
-
Collaborations between laptop manufacturers, AI hardware providers, and software developers are accelerating innovation and global adoption.
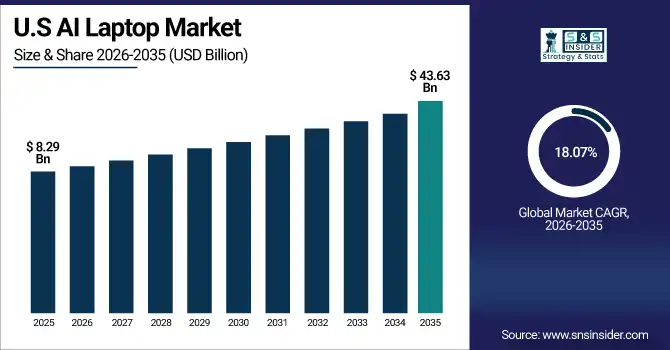
U.S. AI Laptop Market was valued at USD 8.29 billion in 2025 and is expected to reach USD 43.63 billion by 2035, growing at a CAGR of 18.07% from 2026-2035. In the U.S., the AI Laptop Market trend is driven by robust demand for on-device generative AI, edge computing, and productivity tools, spanning across education and enterprise end-use sectors.
AI Laptop Market Growth Drivers:
-
Integration of NPUs Is Accelerating On-Device AI Adoption
Increasing integration of purpose-specific NPUs in chipsets by manufacturers like Intel (Core Ultra), AMD, Apple (M-series), and Qualcomm is rapidly boosting the AI laptop market. NPUs allow AI processing, including transcription enhancement in real-time, image enhancement, predictive for the system breaks, etc, in an on-device, high-efficiency manner. The paradigm shift of edge AI frees the reliance on cloud, thereby enhancing latency, performance, and data confidentiality. As generative AI and AI-powered creative tools become more mainstream – particularly among professionals and those creating content – laptops with embedded AI have become the go-to option. This trend is in line with enterprise demand for both secure and responsive computing and is pushing OEMs to innovate while also creating standard features surrounding AI for consumer and business-grade laptops.
Intel reported that over 80% of its newly launched laptops in 2024 (featuring Core Ultra processors) include built-in NPUs, capable of delivering up to 11 TOPS (trillions of operations per second) of AI compute on-device.
AI Laptop Market Restraints:
-
High Hardware Costs Are Limiting Mass-Market Accessibility
Modern laptops have integrated higher-end hardware to support AI features, and thus, AI laptops are way more expensive than traditional models. The additional manufacturing costs associated with embedding the specialized components needed for this kind of performance (e.g., NPUs, high-performance GPUs, AI-optimized SSDs) are then transferred to consumers. That creates a barrier to adoption for budget users, especially in price-sensitive areas or the student segment. In addition, there is a cost differential, and a lot of users may not yet use the AI functions enough to explain the cost difference. This restricts the potential market penetration rate and rapid democratization of AI capabilities in computing.
AI laptops cost 30–40% more to manufacture than standard laptops, largely due to dedicated NPUs, high-end GPUs, and advanced cooling solutions—leading typical AI-ready models to start around $1,200, nearly double entry-level device price points
AI Laptop Market Opportunities:
-
Enterprise AI Adoption Is Fueling Demand for Intelligent Computing
With massive scale demand from creative professionals and enterprises for generating content, programming, data analysis, and working remotely, AI laptop opportunities are increasing. Tools including Adobe's Firefly and Microsoft 365 Copilot, along with AI-assisted video editing, demand heavy local AI processing that AI laptops can now provide. Intelligent document summarization, meeting transcription, and predictive analytics, available for enterprise users, enhance productivity and decision-making. It is anticipated that demand will increase in areas such as architecture, marketing, software development, and design as AI processes become normalized.
Intel’s survey of over 5,000 business and IT leaders shows that while 87% plan to transition to AI PCs, only 35% of employees understand AI’s business value.
AI Laptop Market Challenges:
-
Lack of Software Optimization Is Reducing AI Performance Benefits
Software-hardware optimization is a big challenge in the AI laptop space. While there are powerful NPUs and AI-ready processors on the market, most applications are not yet optimized to fully utilize these AI accelerators. There's only so much it can do for real performance, and thus for user quality of life and value (where the pants come off). In addition, software developers have to adapt and continually revise their tools to get inspired by the ever-changing hardware benchmarks. And cross-platform compatibility and integration with other operating systems, such as Windows, macOS, Linux, complicate that as well.
AI Laptop Market Segmentation Analysis:
By Processor Type:
In 2025, the AI-optimized CPU segment dominated the AI laptop market and accounted for 38% of revenue share. Its dominance is driven by wide OEM adoption, the ability to utilize current software and efficiency for AI workloads, making it hard to beat. CPUs optimized for AI can be a pointed balance of performance and power and can fit to consumer and enterprise laptops. The segment will continue doing well through incorporation into mainstream laptop models throughout the world.
NPU segment is expected to register the fastest CAGR due to the NPUs enabling high-speed, on-device AI tasks such as real-time translation and image generation without the need for cloud reliance. The continued privacy concerns, quicker AI execution, and the upcoming rollout of AI assistants (like Copilot and Firefly) will accelerate the integration of NPUs within AI laptops, assuming that developers will start optimizing their software to take advantage of the full potential offered by the various neural engines.
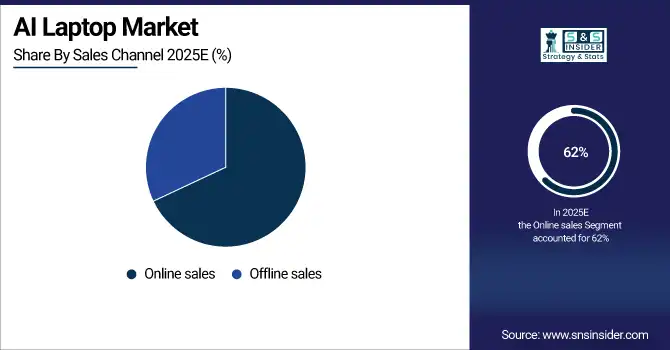
By Sales Channel:
In 2025, the online sales segment dominated the market and accounted for 62% of the AI laptop market share. Convenience offered by e-commerce platforms, surging demand for laptop products, novel AI laptop launches, and competitive promotional pricing have driven the dominance of this segment. Consumers are moving towards online channels for detailed specs comparison and doorstep delivery. Moreover, the collaboration of OEMs with big online players further accelerates this trend.
The offline sales segment is expected to register the fastest CAGR. The consumer choice of physical retail can be attributed to personalized support, real-time demonstrations of AI functions, and after-purchase services. It is also growing in newer markets where online penetration is relatively small.
By End User:
In 2025, the consumer segment dominated the AI laptop market and accounted for a significant revenue share. The dominance is attributed to a rise in demand for AI-enabled functionalities such as virtual assistants, smart battery management, and real-time translations. AI adoption among everyday users is driven by more moderate prices with AI models offered in bundles. This segment will still be leading when AI is a native component of flagship laptops.
The content creators (designers, developers, video editors) segment is expected to register the fastest CAGR in the AI Laptop Market. Driven by high-performance workloads such as video editing, design rendering, and generative AI tools, Advanced NPUs and GPUs in AI laptops make it easier to generate content and automate. The demand is being driven by rising freelance and creator economy trends and the adoption of tools such as Adobe Firefly and Runway ML.
By Operating System:
In 2025, the Windows segment dominated AI laptop market and accounted for a significant revenue share. Windows leads due to it having a wider user base, strong OEM partnerships, and it incorporated AI features like the Microsoft Copilot months before. It provides a wide catering AI applications in the ecosystem for consumers to enterprises, and developers. Lisa Su joins Panos Panay on stage for an AMD/Windows collab. Intel, AMD, and Qualcomm will all stay partnered with Windows as they further push the envelope with AI laptops.
The macOS segment is expected to register the fastest CAGR during the forecast period. Major Apple hardware releases, such as the M-series that come with high-powered on-device AI capabilities, are only accelerating macOS adoption. Real-time editing of photos and voice recognition excite professionals and creatives, and there are dozens of tools focused on AI for developers. And with Apple's integrated hardware-software approach, macOS is picking up steam as a platform for performance-hungry power users who want to deploy machine learning-driven workflows to reach their goals.
AI Laptop Market Regional Outlook:
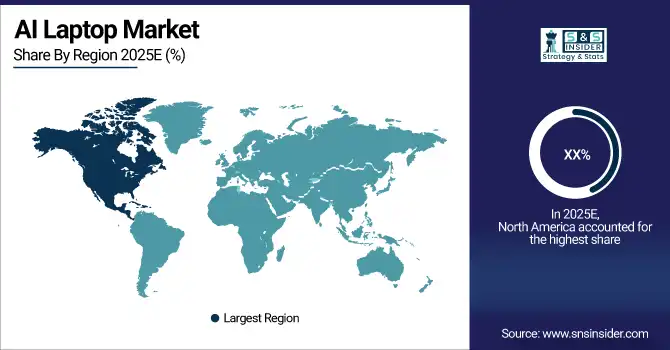
North America AI Laptop Market Insights
In 2025, the North America region dominated the market in AI laptop market and accounted for a significant revenue share. North America leads due to a robust tech infrastructure, a larger concentration of AI PC operations, and industry giants like Microsoft, Intel, and Apple. Combined with record enterprise demand, AI integration evolving faster than expected in both other education and business sectors, and a favorable consumer-spending backdrop, its AI laptop proposition seems well-positioned to drive further sector-wide adoption.
Get Customized Report as per Your Business Requirement - Enquiry Now
Asia Pacific AI Laptop Market Insights
According to an AI laptop market analysis, the Asia-Pacific region is expected to register the fastest CAGR in the AI laptop market and accounted for a significant revenue share. supported by growing digital transformation across nations like China, India, Japan, and South Korea. Demand is being driven by government AI initiatives, a large gaming and creator communities and/or youth populations becoming tech-savvy. Regional adoption certainly is hot, especially with local OEMs as well as low-cost AI laptop models.
Europe AI Laptop Market Insights
Europe’s AI laptop growth is fueled by the appetite for enterprise AI, including AI-driven capabilities for creative industries, along with the increased push for digital education initiatives, which is fuelling Europe’s AI laptop growth. Adoption is fueled by government support for the augmentation of AI and sustainable tech practices. There has been a consistent increase in market growth as the focus relies on edge computing towards 2032.
Germany dominated the European AI Laptop Market. Due to its unique industrial base, tech innovation, and early enterprise digitalization, Germany had the largest market for AI Laptops in Europe. Take-up is being accelerated by strong demand from SMEs, the development of automotive AI, and sectors with AI-driven design. Investment in the development of AI research and local business will keep the momentum going.
Middle East & Africa and Latin America AI Laptop Market Insights
The Middle East & Africa and Latin America AI Laptop Market is witnessing rapid growth driven by rising demand for high-performance computing, AI-enabled applications, and remote work solutions. Increasing adoption in education, enterprises, and creative industries, along with advancements in machine learning, edge computing, and energy-efficient processors, is boosting market expansion. Growing digitalization, supportive government initiatives, and rising consumer awareness of AI capabilities further propel adoption across these regions.
AI Laptop Market Competitive Landscape:
Microsoft
Microsoft drives AI integration in personal computing with its Copilot+ PC lineup, combining Surface hardware with built-in AI acceleration, local Copilot features, and enhanced connectivity options like 5G. These devices target business users, content creators, and enterprises seeking on-device AI productivity. Microsoft continues expanding access through lower-priced models, ensuring broad adoption of AI capabilities while leveraging hardware-software synergy for advanced workflows and real-time intelligent assistance across its Surface portfolio.
-
2024: Microsoft launched Copilot+ PCs, including Surface Laptop 7th Edition and Surface Pro 11, featuring AI acceleration and local Copilot functionality, available for preorder July 11, 2024.
-
2025: Microsoft announced AI-powered Surface Copilot+ PCs with built-in 5G at GITEX Global 2025, boosting on-device AI performance for business users.
-
2025: Microsoft is releasing lower-priced Surface AI laptops with Snapdragon X Plus chips, broadening access to Copilot+ AI features.
ASUS
ASUS develops AI-capable laptops across Vivobook and premium segments, integrating AMD chipsets and Copilot+ support to enhance on-device intelligence. Its AI PCs target creators, gamers, and professionals seeking real-time productivity and adaptive computing experiences. ASUS focuses on expanding its AI ecosystem through hardware optimization, software integration, and versatile form factors, delivering responsive AI features for multitasking, automation, and creative workflows.
-
2025: ASUS expanded its AI PC portfolio with Vivobook S14 and Vivobook 14 Copilot+ laptops powered by AMD chipsets.
Acer
Acer integrates AI features across Predator, Aspire, and Chromebook lines, leveraging Intel, AMD, and MediaTek AI hardware to enhance performance and user experiences. Its devices support Microsoft Copilot+, AI-assisted productivity, and gaming optimizations. Acer aims to deliver scalable AI solutions across price segments, combining hardware acceleration, energy efficiency, and cloud connectivity to empower creators, students, and business users while maintaining a strong presence in global AI-ready PC markets.
-
2025: Acer debuted Predator Helios 18P AI and Chromebook Plus Spin with AI hardware at IFA 2025.
-
2025: Acer unveiled six new Aspire AI laptops supporting Microsoft Copilot+ and advanced AI features across Intel, AMD, and Qualcomm platforms.
Framework
Framework emphasizes modular, repairable laptops with AI-centric hardware, combining Intel Core Ultra or AMD Ryzen AI processors with user-upgradable components. Its laptops target developers, creators, and professionals seeking performance flexibility and on-device AI acceleration. By integrating modular design with AI capabilities, Framework enables sustainable computing while supporting emerging AI workloads, developer customization, and adaptive workflows, positioning itself as a niche leader in sustainable, high-performance AI-ready personal computing.
-
2024: Framework announced Laptop 13 with Intel Core Ultra Series 1 processors, offering modular design and AI support.
-
2025: Framework updated Laptop 13 with AMD Ryzen AI 300 series, improving AI performance and modular capabilities.
Key Players
Some of the AI Laptop Market Companies
-
Apple
-
HP
-
Lenovo
-
ASUS
-
Acer
-
Microsoft
-
Samsung
-
MSI
-
Razer
-
Huawei
-
LG
-
Gigabyte
-
AMD
-
NVIDIA
-
Qualcomm
-
MediaTek
-
Google
-
Framework
|
Report Attributes |
Details |
|---|---|
|
Market Size in 2025 |
USD 30.72 Billion |
|
Market Size by 2035 |
USD 164.77 Billion |
|
CAGR |
CAGR of 18.29 % From 2026 to 2035 |
|
Base Year |
2025 |
|
Forecast Period |
2026-2035 |
|
Historical Data |
2022-2024 |
|
Report Scope & Coverage |
Market Size, Segments Analysis, Competitive Landscape, Regional Analysis, DROC & SWOT Analysis, Forecast Outlook |
|
Key Segments |
• By Type (AI-Optimized CPU, NPU, Integrated GPU, Discrete GPU) |
|
Regional Analysis/Coverage |
North America (US, Canada), Europe (Germany, France, UK, Italy, Spain, Poland, Rest of Europe), Asia Pacific (China, India, Japan, South Korea, ASEAN Countries, Australia, Rest of Asia Pacific), Middle East & Africa (UAE, Saudi Arabia, Qatar,Egypt, South Africa, Rest of Middle East & Africa), Latin America (Brazil, Argentina, Mexico, Colombia, Rest of Latin America) |
|
Company Profiles |
Apple, Dell, HP, Lenovo, ASUS, Acer, Microsoft, Samsung, MSI, Razer, Huawei, LG, Gigabyte, Intel, AMD, NVIDIA, Qualcomm, MediaTek, Google, Framework and others in the report |
Frequently Asked Questions
Ans- The North America region dominated the AI Laptop Market with 34% of revenue share in 2025.
Ans- In 2025, the AI-optimized CPU segment dominated the AI laptop market and accounted for 38% of revenue share
Ans- Integration of NPUs Is Accelerating On-Device AI Adoption
Ans- The AI Laptop Market was valued at USD 30.72 billion in 2025 and is expected to reach USD 164.77 billion by 2035.
Ans- The expected CAGR of the AI Laptop Market over 2026-2035 is 18.29%.
Get in Touch
