Air Filter Market Report Scope & Overview:
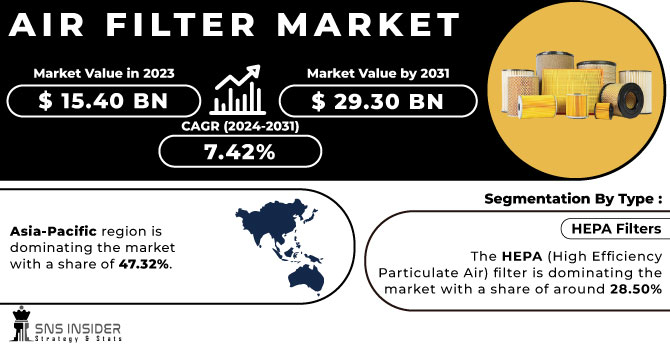
The Air Filter Market was valued at USD 15.73 billion in 2023 and is anticipated to grow to USD 28.95 billion by 2032, displaying a compound annual growth rate (CAGR) of 7.01% during the forecast Period 2024 -2032. The report offers a detailed insight into key aspects of the Air Filter Market, focusing on regional manufacturing output & utilization rate. It focuses on maintenance and downtime metrics to assess operational efficiency, as well as technology adoption trends, showcasing the shift toward advanced filtration technologies. It also provides information on exports and imports, which helps readers understand international trade patterns and market trends. These unique offerings provide a comprehensive understanding of performance and innovation in the air filtration sector.

Get More Information on Air Filter Market - Request Sample Report
Air Filter Market Dynamics:
Drivers
-
Rising air pollution is driving the demand for advanced air filtration solutions to improve air quality and protect public health.
Rising air pollution, especially in urban and industrial areas, is a significant driver for the growth of the air filter market. With the ever-increasing environmental pollution, air quality issues have raised serious concerns regarding its effect on public health, hence there is an upsurge for effective air filtration solutions. Pollutants like particulate matter (PM), volatile organic compounds (VOCs), and nitrogen oxides can threaten public health, leading to a growing demand for better filtration systems in homes and industries alike. Such increasing awareness has also resulted in the growing adoption of air purifiers, HVAC filters, and automotive air filters. According to industry trends, high-efficiency filters like HEPA and activated carbon are becoming more preferred among consumers looking for better air quality. Additionally, with increasing government regulations on air quality standards, the air filter market is expected to expand. The global push for cleaner air is expected to fuel further growth, particularly in emerging markets with rising urbanization.
Restraint
-
The high initial costs of advanced air filtration systems can discourage small businesses and individuals from investing in them.
The high initial costs associated with advanced air filtration systems can be a significant barrier for small businesses and individuals. These systems, especially those with advanced technologies like HEPA filters, activated carbon, or smart filtration solutions, can carry a significant cost. For small businesses and homeowners alike, the initial cost of becoming part of the community solar solution might be hard to justify, especially when compared to cheaper, less-effective options. Moreover, the costs do not always appear essential to businesses that do not directly work with hazardous airborne pollutants, or to people who may have not completely understood the long-term health benefits of high-performance filtration. This financial hurdle can delay or limit the adoption of such systems, especially in regions or sectors with limited budgets. While the systems provide long-term health and environmental benefits, the initial capital required often leads to cautious decision-making, especially for cost-sensitive segments.
Opportunities
-
The automotive industry's focus on improving cabin air quality, especially in electric vehicles, creates significant growth opportunities for air filter manufacturers.
The automotive industry's growing emphasis on enhancing cabin air quality presents a substantial opportunity for air filter manufacturers, particularly with the rise of electric vehicles (EVs). With the growing awareness of health concerns linked to air pollution, automakers are taking the development of advanced filtration solutions more seriously than ever before to promote cleaner air inside the cars they sell. In EVs, where you've eschewed engine exhaust that contributes to indoor pollution, cabin air filtration plays an even more important role in enhancing the overall driving experience. The demand for these disabilities is forcing manufacturers to come up with more efficient air filters, which are capable of removing allergens, dust, unwanted pollen, and harmful pollutants. In addition, increasing vehicle emissions and indoor air quality regulations are fostering automotive manufacturers to check high-performance filters in traditional and electric vehicles. As the automotive sector continues to grow, particularly with the adoption of EVs, air filter manufacturers stand to benefit from the increased need for advanced cabin air filtration systems.
Challenges
-
The development of advanced air filtration technologies involves complex integration of multiple stages, smart features, and regulatory compliance, requiring significant R&D investment and innovation.
The development of advanced air filtration technologies, such as multi-stage filters and air purifiers, presents significant technological complexity. These systems need to combine different filtration stages, focused on separate pollutants (particulate, chemicals, microorganisms). The interactions between multiple filter materials, airflow patterns, and how to optimize performance all play a role in the design of these systems. Also, features like smart sensors and IoT integration make these solutions more sophisticated. The R&D investment in developing such FR systems is resource-intensive; it requires a huge investment in technology, experimentation, and innovation. Furthermore, to guarantee that these products adhere to expensive regulatory economic standards for air quality and efficiency requires accurate engineering technology and constant improvements. This complexity can pose a barrier for smaller companies and increase the cost of manufacturing, ultimately affecting pricing and market accessibility. The need for constant innovation to stay competitive further exacerbates the challenges in this field.
Air Filter Market Segmentation Analysis:
By Type
Dust Collectors segment dominated with a market share of over 32% in 2023, owing to their extensive application in multiple industries. They are specifically designed to trap and filter larger particles, dust, and contaminants from the air, and are essential to the manufacturing, construction, and mining sectors. Their core purpose is to further enhance the air quality of a working environment by the elimination of harmful airborne dust. There, Dust Collectors are essential equipment for a wide range of industries dealing with significant dust volumes, like cement processing, metal processing, and woodworking. The ability to use what would otherwise be hazardous materials, and compliance with environmental standards also greatly enhances their market share. As industrial activities continue to grow, the demand for dust collectors remains robust, solidifying their market dominance.
By End-User
The industrial segment dominated with a market share of over 35% in 2023, driven by high demand across various sectors such as manufacturing, automotive, and heavy industries. Industries benefit from a highly efficient air filtration system to ensure top-conditioned air quality that protects employees, equipment and meets the strictest environmental standards. Industrial air filters play a critical role in eliminating air-borne pollutants, dust, fumes, and toxic substances to ensure employee safety and to reduce manufacturers' operational costs by ensuring the optimal functioning of machines. The need for clean air in industrial environments is increasingly recognized as vital for both process integrity and longevity of equipment, contributing to the dominance of this segment in the air filter market.
Air Filter Market Regional Outlook:
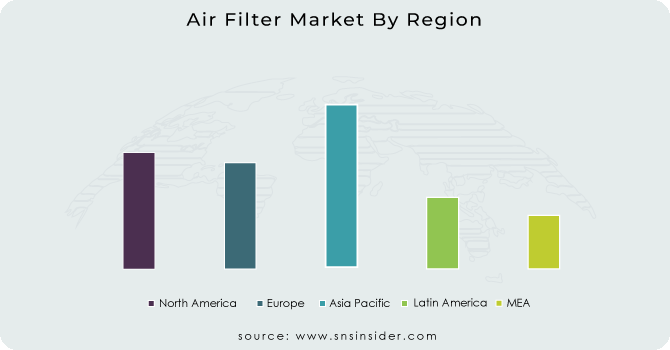
North America region dominated with a market share of over 42% in 2023, primarily driven by several factors. With the increasing industrialization in the region, the need for more advanced filtration systems is also growing for smog caused due to manufacturing processes. Demand for air filters to comply with all necessary regulations is also bolstered in the U.S. and Canada by strict air quality regulations and environmental policies. Moreover, growing awareness regarding health issues due to air quality has fostered demand for air filtration systems for residential and commercial sectors. With a well-established infrastructure and a strong focus on technological advancements, North America continues to lead the market, particularly in industries such as automotive, HVAC, and healthcare.
Asia-Pacific is the fastest-growing region in the air filter market, fueled by rapid urbanization and industrialization, particularly in countries like China and India. With the rapid growth of these economies, the demand for Air Filtration Systems has also multiplied in residential, commercial, and industrial applications. Significant pollution levels in the region have added to the concerns over air quality, which is further fuelling the uptake of air filters. In support of these drivers, growing awareness of health risks associated with degraded air quality has driven significantly increased demand for clean air solutions. Furthermore, governments in the region are setting stringent environmental regulations, which increase demand for advanced air filtration technologies, establishing Asia-Pacific as a primary market for air filter manufacturers and suppliers.

Get Customized Report as per your Business Requirement - Request For Customized Report
Some of the major key players in the Air Filter Market:
-
Honeywell International, Inc.: (HEPA Filters, Activated Carbon Filters, Electronic Air Cleaners)
-
IQAir: (HyperHEPA Filters, Air Purifiers, Gas & Odor Filters)
-
Unilever PLC: (Blueair Air Purifiers, HEPA Filters)
-
Sharp Electronics Corporation: (Plasmacluster Air Purifiers, HEPA Filters)
-
Samsung Electronics Co., Ltd.: (HEPA Air Purifiers, PM 2.5 Filters)
-
LG Electronics: (360° HEPA Air Purifiers, PM 1.0 Filters)
-
Panasonic Corporation: (Nanoe Air Purifiers, HEPA Composite Filters)
-
Whirlpool Corporation: (HEPA Air Purifiers, Carbon Filters)
-
Dyson: (HEPA Air Purifiers, Activated Carbon Filters)
-
Daikin Industries, Ltd.: (Streamer Technology Air Purifiers, Electrostatic HEPA Filters)
-
Camfil: (HEPA Filters, Molecular Air Filters, Industrial Air Purification Systems)
-
MANN+HUMMEL: (NanoWave Filters, Cabin Air Filters, Industrial Air Filtration)
-
Parker Hannifin Corp: (HVAC Filters, HEPA/ULPA Filters, Gas Phase Filters)
-
Cummins, Inc.: (Fleetguard Air Filters, High-Efficiency Filtration Systems)
-
Donaldson Company, Inc.: (Industrial Air Filters, Engine Air Filtration, HEPA Filters)
-
Freudenberg Filtration Technologies SE & Co. KG: (Viledon Air Filters, Automotive Cabin Filters)
-
Absolent Group AB (publ): (Mist Filters, Oil Smoke Filters, Dust Filters)
-
Lydall Gutsche GmbH & Co. Kg: (HVAC Filters, Industrial Air Filtration, HEPA/ULPA Media)
-
Purafil, Inc.: (Gas Phase Air Filtration, Molecular Air Filters, Odor Control Filters)
-
Philips: (NanoProtect HEPA Filters, Activated Carbon Filters)
Suppliers for (Air filtration systems, dust collectors, and specialized filter elements) on the Air Filter Market
-
Sigma Air Filters
-
Standard Air Filters Pvt. Ltd.
-
Luft Filtration
-
Space Care Air Filters
-
RPS Filters Pvt. Ltd.
-
United Filters Industries Pvt. Ltd.
-
Freudenberg Filtration Technologies India
-
MTB Filter Industries
-
Sutez Filters
-
Padmavati Filt Fab Pvt. Ltd.
Recent Development:
In January 2024: 3M introduced a new high-efficiency pleated air filter designed for commercial and industrial use, offering extended lifespan and enhanced energy efficiency.
In February 2023: Samsung Electronics unveiled an advanced air filter technology that captures particulate matter (PM), decomposes Volatile Organic Compounds (VOCs), and provides a 20-year lifespan with simple water washing maintenance.
| Report Attributes | Details |
|---|---|
|
Market Size in 2023 |
USD 15.73 Billion |
|
Market Size by 2032 |
USD 28.95 Billion |
|
CAGR |
CAGR of 7.01% From 2024 to 2032 |
|
Base Year |
2023 |
|
Forecast Period |
2024-2032 |
|
Historical Data |
2020-2022 |
|
Report Scope & Coverage |
Market Size, Segments Analysis, Competitive Landscape, Regional Analysis, DROC & SWOT Analysis, Forecast Outlook |
|
Key Segments |
• By Type (Cartridge Filters, Dust Collector, HEPA Filters, Baghouse Filters, Others (Mist Filters)) |
|
Regional Analysis/Coverage |
North America (US, Canada, Mexico), Europe (Eastern Europe [Poland, Romania, Hungary, Turkey, Rest of Eastern Europe] Western Europe] Germany, France, UK, Italy, Spain, Netherlands, Switzerland, Austria, Rest of Western Europe]), Asia Pacific (China, India, Japan, South Korea, Vietnam, Singapore, Australia, Rest of Asia Pacific), Middle East & Africa (Middle East [UAE, Egypt, Saudi Arabia, Qatar, Rest of Middle East], Africa [Nigeria, South Africa, Rest of Africa], Latin America (Brazil, Argentina, Colombia, Rest of Latin America) |
|
Company Profiles |
Honeywell International, Inc., IQAir, Unilever PLC, Sharp Electronics Corporation, Samsung Electronics Co., Ltd., LG Electronics, Panasonic Corporation, Whirlpool Corporation, Dyson, Daikin Industries, Ltd., Camfil, MANN+HUMMEL, Parker Hannifin Corp, Cummins, Inc., Donaldson Company, Inc., Freudenberg Filtration Technologies SE & Co. KG, Absolent Group AB (publ), Lydall Gutsche GmbH & Co. Kg, Purafil, Inc., Philips. |

