Air Powered Vehicle Market Report Scope & Overview:
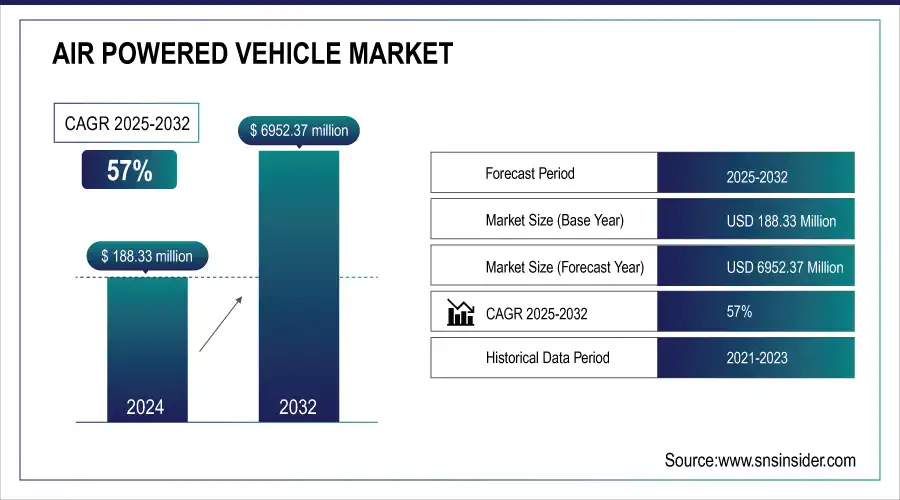
The Air Powered Vehicle Market Size was valued at USD 188.33 million in 2024 and is expected to reach USD 6952.37 million by 2032 and grow at a CAGR of 57% over the forecast period 2025-2032.
An air-powered vehicle utilizes compressed air and non-polluting fuel as its power source. The increase in the price of fossil fuel as a result of its limited supply and availability, as well as the rise in the demand for emission-free vehicles, has led to the creation of air-powered vehicles. In comparison to the other available alternatives to the internal combustion engine vehicle, the air-powered vehicle has a longer lifespan, a higher energy density of the compressed air, and a lower level of toxicity. Air-powered vehicles are one form of vehicle that emits little or no pollution. As environmental concerns and the quest for cleaner alternatives intensify, air-powered vehicles have emerged as a frontrunner in the race towards greener transportation solutions. The rising demand for these vehicles can be attributed to their eco-friendly credentials, harnessing compressed air as a power source to drive engines with minimal emissions. This innovation not only aligns with global efforts to reduce carbon footprints but also addresses the growing need for energy-efficient modes of transportation. The air-powered vehicle market is not merely a response to environmental challenges; it represents a bold stride towards redefining the future of transportation, offering a breath of fresh air for the planet and those who traverse it.

Get more information on Air Powered Vehicle Market - Request Sample Report
The pressurized atmospheric gas provides the motivation for the air-powered vehicle. Since the vehicle uses compressed air rather than fuel for propulsion, it is regarded as an environmentally beneficial mode of transportation. In addition to this, the vehicle moves forward by the release and expansion of pneumatic pressure with the assistance of a pneumatic motor. An air injector is used to supply the engine of a vehicle that is powered by air with atmospheric pressure. A compact chamber is created by forcing air down into it; this further drives the crankshaft, which in turn powers the vehicle.
Market Size and Forecast:
-
Market Size in 2024 USD 188.33 Million
-
Market Size by 2032 USD 6952.377 Million
-
CAGR of 57% From 2025 to 2032
-
Base Year 2024
-
Forecast Period 2025-2032
-
Historical Data 2021-2023
Key Air Powered Vehicle Market Trends:
-
Growing consumer and industry awareness about environmental impact is accelerating the adoption of air-powered vehicles as a sustainable mobility solution.
-
Strict government regulations and global emission standards are compelling automakers to invest in clean, air-powered transportation technologies.
-
Rising fuel prices make air-powered vehicles an economically attractive alternative to conventional internal combustion engine vehicles.
-
Advancements in compressed air technology are enhancing efficiency, performance, and viability of air-powered vehicles across diverse applications.
-
Government initiatives, such as subsidies and investment in public transportation projects, are strengthening market growth and encouraging large-scale adoption.
Air Powered Vehicle Market Growth Drivers:
Air-powered vehicles, harnessing the power of compressed air as a clean and renewable energy source, are poised to redefine the way we traverse our world. This innovative market not only aligns with the global push towards environmental consciousness but also offers a practical solution to the economic challenges posed by escalating fuel costs. As advancements in technology continue to propel the development of air-powered vehicles, enthusiasts and eco-conscious consumers alike anticipate a skyward trajectory for this market.
Air Powered Vehicle Market Restraints:
The air-powered vehicle market faces certain challenges, including the limited availability of refueling infrastructure and the relatively slow speed of air-powered cars, which may hinder widespread adoption. However, rising gasoline costs are expected to act as a strong growth driver, encouraging both consumers and manufacturers to explore this eco-friendly alternative. Balancing these challenges with economic and environmental benefits will be crucial for the market’s sustained expansion.
Air Powered Vehicle Market Opportunities:
Recognizing the imperative need for sustainable transportation solutions, various nations have amplified their efforts to support and promote air-powered vehicles as an environmentally friendly alternative. Take, for instance, the innovative approach adopted by the Dutch government. In a visionary move, they have invested significantly in the development and promotion of air-powered public transportation, aiming to reduce carbon emissions and foster a greener urban environment. Such proactive measures not only underscore a growing global awareness of the ecological impact of conventional vehicles but also showcase the pivotal role that governments play in steering industries towards sustainable innovations.
Air Powered Vehicle Market Segment Analysis:
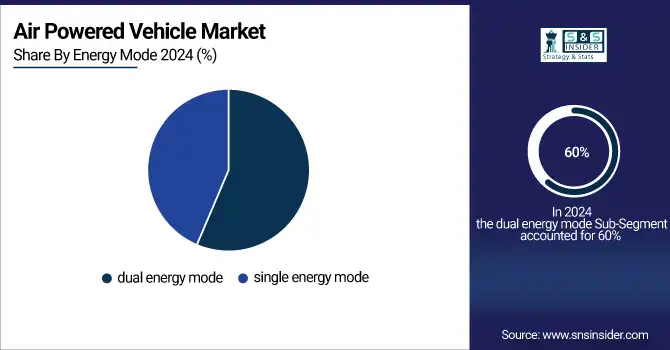
By Energy Mode:
In 2024, the dual energy mode segment dominated With 60 %,the air-powered vehicle market due to its enhanced efficiency and ability to combine compressed air with conventional fuel, offering better performance and longer driving ranges. However, the single energy mode segment is expected to witness the fastest CAGR from 2025 to 2032, driven by advancements in compressed air technology, growing focus on zero-emission mobility, and rising government support for sustainable transportation solutions that operate solely on clean, renewable energy sources.
By Vehicle Type:
In 2024, passenger vehicles dominated the air-powered vehicle market, supported by rising consumer demand for eco-friendly personal mobility solutions and increasing adoption of sustainable technologies in urban transportation. Meanwhile, the commercial vehicles segment is projected to grow at the fastest CAGR from 2025 to 2032, fueled by the need for cost-effective, low-emission alternatives in logistics, public transport, and delivery fleets as governments and businesses prioritize reducing carbon footprints in large-scale operations.
Air Powered Vehicle Market Regional Analysis:
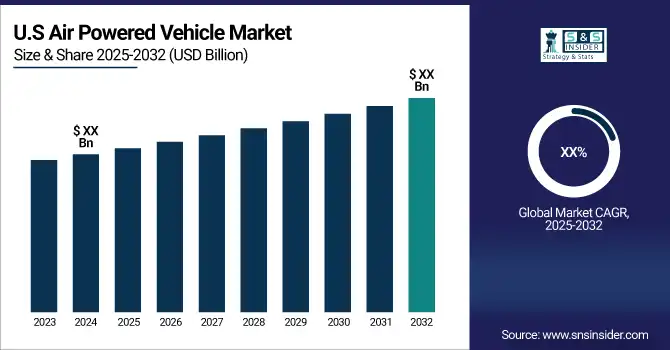
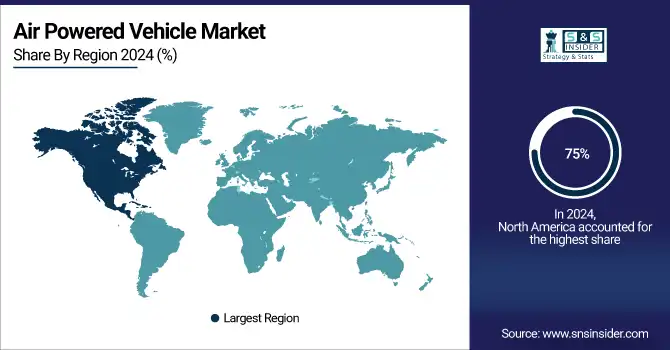
North America Air Powered Vehicle Market Insights
The Global Air Powered Vehicle Market is expected to be dominated by North America. The United States dominates the market in this region, providing about 75% of the total income. Market growth in this region is fueled by the development of clean energy for automobiles and an increasing focus on environmental sustainability.
Asia Pacific Air Powered Vehicle Market Insights
The Asia Pacific area is expected to have the highest CAGR of any market worldwide. Emerging economies like China and India, both of which have large automotive markets, are found in this region. In addition, governments and environmental authorities are increasing their environmental protection efforts, which is fueling the demand for air-powered vehicles in the region. Because of its low production costs and plenty of both experienced and inexpensive labor, as well as its technologically superior infrastructure, this region is well-known as a significant exporter of air-powered vehicles.
Europe Air Powered Vehicle Market Insights
Europe’s air-powered vehicle market is driven by strict emission regulations, government-backed sustainability initiatives, and growing consumer preference for eco-friendly mobility solutions. Strong investments in green automotive technologies, rising fuel costs, and the presence of leading automakers advancing alternative propulsion systems are supporting adoption. Urban congestion policies and clean transportation incentives further strengthen market opportunities across the region.
Latin America (LATAM) and Middle East & Africa (MEA) Air Powered Vehicle Market Insights
The LATAM and MEA air-powered vehicle markets are emerging, fueled by increasing environmental awareness, rising fuel expenses, and supportive government initiatives for sustainable transport. In LATAM, urban air pollution concerns encourage adoption of eco-friendly vehicles, while in MEA, efforts to diversify energy reliance and reduce emissions are driving demand. These regions offer growth potential through infrastructure development and cost-effective green mobility solutions.

Get Customized Report as per your Business Requirement - Request For Customized Report
Air Powered Vehicle Market Key Players:
Some of the Air Powered Vehicle Market Companies are
-
Tata Motors
-
Magnetic Air Car Inc
-
Motor Development International SA
-
Honda Motor Company, Ltd.
-
Matrix Comsec
-
APUQ
-
Groupe PSA
-
Engineair Pty Ltd
-
Phinergy
-
Toyota Motor Corporation
-
Hyundai Motor Company
-
General Motors
-
Ford Motor Company
-
Nissan Motor Corporation
-
BMW AG
-
Daimler AG (Mercedes-Benz)
-
Volkswagen AG
-
Mahindra & Mahindra Ltd.
-
Suzuki Motor Corporation
-
BYD Company Limited
Competitive Landscape for Air Powered Vehicle Market:
Tesla, Inc. is a global leader in electric mobility and clean energy innovation, focusing on sustainable transportation solutions. While primarily recognized for its electric vehicles, Tesla’s advancements in renewable energy, battery technology, and green innovation align closely with the principles driving the air-powered vehicle market, emphasizing eco-friendly alternatives to traditional combustion engines.
-
Tesla, renowned for its electric vehicles, has ventured into the air-powered domain with groundbreaking innovations, unveiling a prototype that seamlessly integrates air propulsion technology with their signature electric powertrain.
Airbus is a leading aerospace manufacturer actively engaged in sustainable mobility innovations. While best known for its aircraft, the company also explores alternative propulsion technologies, including eco-friendly and zero-emission concepts. Airbus’s focus on advanced engineering and green transportation aligns with the air-powered vehicle market’s vision of reducing carbon emissions and promoting cleaner mobility.
-
Airbus, a stalwart in the aerospace industry, has unveiled a concept for an air-powered urban mobility solution, pushing the boundaries of innovation in the vertical take-off and landing (VTOL) sector.
Motor Development International SA-Company Financial Analysis

Report Attributes | Details |
---|---|
Market Size in 2024 | USD 188.33 Million |
Market Size by 2032 | USD 6952.37 Billion |
CAGR | CAGR of 57% From 2025 to 2032 |
Base Year | 2024 |
Forecast Period | 2025-2032 |
Historical Data | 2021-2023 |
Report Scope & Coverage | Market Size, Segments Analysis, Competitive Landscape, Regional Analysis, DROC & SWOT Analysis, Forecast Outlook |
Key Segments | • by Energy Mode (Dual Energy Mode, Single Energy Mode) • by Vehicle Type (Passenger Vehicles, Commercial vehicles) |
Regional Analysis/Coverage | North America (US, Canada), Europe (Germany, UK, France, Italy, Spain, Russia, Poland, Rest of Europe), Asia Pacific (China, India, Japan, South Korea, Australia, ASEAN Countries, Rest of Asia Pacific), Middle East & Africa (UAE, Saudi Arabia, Qatar, South Africa, Rest of Middle East & Africa), Latin America (Brazil, Argentina, Mexico, Colombia, Rest of Latin America). |
Company Profiles |
Tata Motors, Magnetic Air Car Inc, Motor Development International SA, Honda Motor Company Ltd., Matrix Comsec, APUQ, Groupe PSA, Engineair Pty Ltd, Phinergy, Toyota Motor Corporation, Hyundai Motor Company, General Motors, Ford Motor Company, Nissan Motor Corporation, BMW AG, Daimler AG (Mercedes-Benz), Volkswagen AG, Mahindra & Mahindra Ltd., Suzuki Motor Corporation, BYD Company Limited. |
Table Of Contents
1. Introduction
1.1 Market Definition & Scope
1.2 Research Assumptions & Abbreviations
1.3 Research Methodology
2. Executive Summary
2.1 Market Snapshot
2.2 Market Absolute $ Opportunity Assessment & Y-o-Y Analysis, 2021–2032
2.3 Market Size & Forecast, By Segmentation, 2021–2032
2.3.1 Market Size By Energy Mode
2.3.2 Market Size By Vehicle Type
2.4 Market Share & Bps Analysis By Region, 2024
2.5 Industry Growth Scenarios – Conservative, Likely & Optimistic
2.6 Industry CxO’s Perspective
3. Market Overview
3.1 Market Dynamics
3.1.1 Drivers
3.1.2 Restraints
3.1.3 Opportunities
3.1.4 Key Market Trends
3.2 Industry PESTLE Analysis
3.3 Key Industry Forces (Porter’s) Impacting Market Growth
3.4 Industry Supply Chain Analysis
3.4.1 Raw Material Suppliers
3.4.2 Manufacturers
3.4.3 Distributors/Suppliers
3.4.4 Customers/End-Users
3.5 Industry Life Cycle Assessment
3.6 Parent Market Overview
3.7 Market Risk Assessment
4. Statistical Insights & Trends Reporting
4.1 Efficiency & Performance Metrics
4.1.1 Average driving range (km) per full compressed air tank
4.1.2 Average refueling/recharging time (minutes) for air-powered vehicles
4.1.3 Energy efficiency improvement (%) compared to conventional ICE vehicles
4.2 Adoption & Application Trends
4.2.1 Percentage share of adoption by vehicle type (passenger cars, two-wheelers, commercial vehicles)
4.2.2 Year-on-year growth (%) in prototype testing and pilot projects worldwide
4.2.3 Share of urban mobility vs. long-distance applications in total deployments (%)
4.3 Technology & Design Metrics
4.3.1 Distribution (%) of air-powered vehicles using single-energy vs. hybrid (air + electric) systems
4.3.2 Average tank pressure capacity (bar) across different vehicle prototypes
4.3.3 Share of lightweight materials (aluminum, carbon fiber composites) used in vehicle design (%)
4.4 Sustainability & Cost Efficiency Benchmarks
4.4.1 Average reduction in CO₂ emissions (%) compared to gasoline/diesel vehicles
4.4.2 Average operating cost savings (%) per km compared to ICE vehicles
4.4.3 Share of government-funded R&D projects and subsidies supporting air-powered mobility (%)
Air Powered Vehicle Market Segmental Analysis & Forecast, By Energy Mode, 2021 – 2032, Value (USD Million)
5.1 Introduction
5.2 Dual Energy Mode
5.2.1 Key Trends
5.2.2 Market Size & Forecast, 2021 – 2032
5.3 Single Energy Mode
6. Air Powered Vehicle Market Segmental Analysis & Forecast, By Vehicle Type, 2021 – 2032, Value (USD Million)
6.1 Introduction
6.2 Passenger vehicles
6.2.1 Key Trends
6.2.2 Market Size & Forecast, 2021 – 2032
6.3 Commercial vehicles
7. Air Powered Vehicle Market Segmental Analysis & Forecast By Region, 2021 – 2025, Value (USD Million)
7.1 Introduction
7.2 North America
7.2.1 Key Trends
7.2.2 Air Powered Vehicle Market Size & Forecast, By Energy Mode, 2021 – 2032
7.2.3 Air Powered Vehicle Market Size & Forecast, By Vehicle Type, 2021 – 2032
7.2.4 Air Powered Vehicle Market Size & Forecast, By Country, 2021 – 2032
7.2.4.1 USA
7.2.4.1.1 Air Powered Vehicle Market Size & Forecast, By Energy Mode, 2021 – 2032
7.2.4.1.2 Air Powered Vehicle Market Size & Forecast, By Vehicle Type, 2021 – 2032
7.2.4.2 Canada
7.2.4.2.1 Air Powered Vehicle Market Size & Forecast, By Energy Mode, 2021 – 2032
7.2.4.2.2 Air Powered Vehicle Market Size & Forecast, By Vehicle Type, 2021 – 2032
7.3 Europe
7.3.1 Key Trends
7.3.2 Air Powered Vehicle Market Size & Forecast, By Energy Mode, 2021 – 2032
7.3.3 Air Powered Vehicle Market Size & Forecast, By Vehicle Type, 2021 – 2032
7.3.4 Air Powered Vehicle Market Size & Forecast, By Country, 2021 – 2032
7.3.4.1 Germany
7.3.4.1.1 Air Powered Vehicle Market Size & Forecast, By Energy Mode, 2021 – 2032
7.3.4.1.2 Air Powered Vehicle Market Size & Forecast, By Vehicle Type, 2021 – 2032
7.3.4.2 UK
7.3.4.2.1 Air Powered Vehicle Market Size & Forecast, By Energy Mode, 2021 – 2032
7.3.4.2.2 Air Powered Vehicle Market Size & Forecast, By Vehicle Type, 2021 – 2032
7.3.4.3 France
7.3.4.3.1 Air Powered Vehicle Market Size & Forecast, By Energy Mode, 2021 – 2032
7.3.4.3.2 Air Powered Vehicle Market Size & Forecast, By Vehicle Type, 2021 – 2032
7.3.4.4 Italy
7.3.4.4.1 Air Powered Vehicle Market Size & Forecast, By Energy Mode, 2021 – 2032
7.3.4.4.2 Air Powered Vehicle Market Size & Forecast, By Vehicle Type, 2021 – 2032
7.3.4.5 Spain
7.3.4.5.1 Air Powered Vehicle Market Size & Forecast, By Energy Mode, 2021 – 2032
7.3.4.5.2 Air Powered Vehicle Market Size & Forecast, By Vehicle Type, 2021 – 2032
7.3.4.6 Russia
7.3.4.6.1 Air Powered Vehicle Market Size & Forecast, By Energy Mode, 2021 – 2032
7.3.4.6.2 Air Powered Vehicle Market Size & Forecast, By Vehicle Type, 2021 – 2032
7.3.4.7 Poland
7.3.4.7.1 Air Powered Vehicle Market Size & Forecast, By Energy Mode, 2021 – 2032
7.3.4.7.2 Air Powered Vehicle Market Size & Forecast, By Vehicle Type, 2021 – 2032
7.3.4.8 Rest of Europe
7.3.4.8.1 Air Powered Vehicle Market Size & Forecast, By Energy Mode, 2021 – 2032
7.3.4.8.2 Air Powered Vehicle Market Size & Forecast, By Vehicle Type, 2021 – 2032
7.4 Asia-Pacific
7.4.1 Key Trends
7.4.2 Air Powered Vehicle Market Size & Forecast, By Energy Mode, 2021 – 2032
7.4.3 Air Powered Vehicle Market Size & Forecast, By Vehicle Type, 2021 – 2032
7.4.4 Air Powered Vehicle Market Size & Forecast, By Country, 2021 – 2032
7.4.4.1 China
7.4.4.1.1 Air Powered Vehicle Market Size & Forecast, By Energy Mode, 2021 – 2032
7.4.4.1.2 Air Powered Vehicle Market Size & Forecast, By Vehicle Type, 2021 – 2032
7.4.4.2 India
7.4.4.2.1 Air Powered Vehicle Market Size & Forecast, By Energy Mode, 2021 – 2032
7.4.4.2.2 Air Powered Vehicle Market Size & Forecast, By Vehicle Type, 2021 – 2032
7.4.4.3 Japan
7.4.4.3.1 Air Powered Vehicle Market Size & Forecast, By Energy Mode, 2021 – 2032
7.4.4.3.2 Air Powered Vehicle Market Size & Forecast, By Vehicle Type, 2021 – 2032
7.4.4.4 South Korea
7.4.4.4.1 Air Powered Vehicle Market Size & Forecast, By Energy Mode, 2021 – 2032
7.4.4.4.2 Air Powered Vehicle Market Size & Forecast, By Vehicle Type, 2021 – 2032
7.4.4.5 Australia
7.4.4.5.1 Air Powered Vehicle Market Size & Forecast, By Energy Mode, 2021 – 2032
7.4.4.5.2 Air Powered Vehicle Market Size & Forecast, By Vehicle Type, 2021 – 2032
7.4.4.6 ASEAN Countries
7.4.4.6.1 Air Powered Vehicle Market Size & Forecast, By Energy Mode, 2021 – 2032
7.4.4.6.2 Air Powered Vehicle Market Size & Forecast, By Vehicle Type, 2021 – 2032
7.4.4.7 Rest of Asia-Pacific
7.4.4.7.1 Air Powered Vehicle Market Size & Forecast, By Energy Mode, 2021 – 2032
7.4.4.7.2 Air Powered Vehicle Market Size & Forecast, By Vehicle Type, 2021 – 2032
7.5 Latin America
7.5.1 Key Trends
7.5.2 Air Powered Vehicle Market Size & Forecast, By Energy Mode, 2021 – 2032
7.5.3 Air Powered Vehicle Market Size & Forecast, By Vehicle Type, 2021 – 2032
7.5.4 Air Powered Vehicle Market Size & Forecast, By Country, 2021 – 2032
7.5.4.1 Brazil
7.5.4.1.1 Air Powered Vehicle Market Size & Forecast, By Energy Mode, 2021 – 2032
7.5.4.1.2 Air Powered Vehicle Market Size & Forecast, By Vehicle Type, 2021 – 2032
7.5.4.2 Argentina
7.5.4.2.1 Air Powered Vehicle Market Size & Forecast, By Energy Mode, 2021 – 2032
7.5.4.2.2 Air Powered Vehicle Market Size & Forecast, By Vehicle Type, 2021 – 2032
7.5.4.3 Mexico
7.5.4.3.1 Air Powered Vehicle Market Size & Forecast, By Energy Mode, 2021 – 2032
7.5.4.3.2 Air Powered Vehicle Market Size & Forecast, By Vehicle Type, 2021 – 2032
7.5.4.4 Colombia
7.5.4.4.1 Air Powered Vehicle Market Size & Forecast, By Energy Mode, 2021 – 2032
7.5.4.4.2 Air Powered Vehicle Market Size & Forecast, By Vehicle Type, 2021 – 2032
7.5.4.5 Rest of Latin America
7.5.4.5.1 Air Powered Vehicle Market Size & Forecast, By Energy Mode, 2021 – 2032
7.5.4.5.2 Air Powered Vehicle Market Size & Forecast, By Vehicle Type, 2021 – 2032
7.6 Middle East & Africa
7.6.1 Key Trends
7.6.2 Air Powered Vehicle Market Size & Forecast, By Energy Mode, 2021 – 2032
7.6.3 Air Powered Vehicle Market Size & Forecast, By Vehicle Type, 2021 – 2032
7.6.4 Air Powered Vehicle Market Size & Forecast, By Country, 2021 – 2032
7.6.4.1 UAE
7.6.4.1.1 Air Powered Vehicle Market Size & Forecast, By Energy Mode, 2021 – 2032
7.6.4.1.2 Air Powered Vehicle Market Size & Forecast, By Vehicle Type, 2021 – 2032
7.6.4.2 Saudi Arabia
7.6.4.2.1 Air Powered Vehicle Market Size & Forecast, By Energy Mode, 2021 – 2032
7.6.4.2.2 Air Powered Vehicle Market Size & Forecast, By Vehicle Type, 2021 – 2032
7.6.4.3 Qatar
7.6.4.3.1 Air Powered Vehicle Market Size & Forecast, By Energy Mode, 2021 – 2032
7.6.4.3.2 Air Powered Vehicle Market Size & Forecast, By Vehicle Type, 2021 – 2032
7.6.4.4 Egypt
7.6.4.4.1 Air Powered Vehicle Market Size & Forecast, By Energy Mode, 2021 – 2032
7.6.4.4.2 Air Powered Vehicle Market Size & Forecast, By Vehicle Type, 2021 – 2032
7.6.4.5 South Africa
7.6.4.5.1 Air Powered Vehicle Market Size & Forecast, By Energy Mode, 2021 – 2032
7.6.4.5.2 Air Powered Vehicle Market Size & Forecast, By Vehicle Type, 2021 – 2032
7.6.4.6 Rest of Middle East & Africa
7.6.4.6.1 Air Powered Vehicle Market Size & Forecast, By Energy Mode, 2021 – 2032
7.6.4.6.2 Air Powered Vehicle Market Size & Forecast, By Vehicle Type, 2021 – 2032
8. Competitive Landscape
8.1 Key Players' Positioning
8.2 Competitive Developments
8.2.1 Key Strategies Adopted (%), By Key Players, 2024
8.2.2 Year-Wise Strategies & Development, 2021 – 2025
8.2.3 Number Of Strategies Adopted By Key Players, 2024
8.3 Market Share Analysis, 2024
8.4 Product/Service & Application Benchmarking
8.4.1 Product/Service Specifications & Features By Key Players
8.4.2 Product/Service Heatmap By Key Players
8.4.3 Application Heatmap By Key Players
8.5 Industry Start-Up & Innovation Landscape
8.6 Key Company Profiles
8.6.1 Tata Motors
8.6.1.1 Company Overview & Snapshot
8.6.1.2 Product/Service Portfolio
8.6.1.3 Key Company Financials
8.6.1.4 SWOT Analysis
8.6.2 Magnetic Air Car Inc
8.6.3 Motor Development International SA
8.6.4 Honda Motor Company, Ltd.
8.6.5 Matrix Comsec
8.6.6 APUQ
8.6.7 Groupe PSA
8.6.8 Engineair Pty Ltd
8.6.9 Phinergy
8.6.10 Toyota Motor Corporation
8.6.11 Hyundai Motor Company
8.6.12 General Motors
8.6.13 Ford Motor Company
8.6.14 Nissan Motor Corporation
8.6.15 BMW AG
8.6.16 Daimler AG (Mercedes-Benz)
8.6.17 Volkswagen AG
8.6.18 Mahindra & Mahindra Ltd.
8.6.19 Suzuki Motor Corporation
8.6.20 BYD Company Limited
9. Analyst Recommendations
9.1 SNS Insider Opportunity Map
9.2 Industry Low-Hanging Fruit Assessment
9.3 Market Entry & Growth Strategy
9.4 Analyst Viewpoint & Suggestions On Market Growth
10. Assumptions
11. Disclaimer
12. Appendix
12.1 List Of Tables
12.2 List Of Figures
An accurate research report requires proper strategizing as well as implementation. There are multiple factors involved in the completion of good and accurate research report and selecting the best methodology to compete the research is the toughest part. Since the research reports we provide play a crucial role in any company’s decision-making process, therefore we at SNS Insider always believe that we should choose the best method which gives us results closer to reality. This allows us to reach at a stage wherein we can provide our clients best and accurate investment to output ratio.
Each report that we prepare takes a timeframe of 350-400 business hours for production. Starting from the selection of titles through a couple of in-depth brain storming session to the final QC process before uploading our titles on our website we dedicate around 350 working hours. The titles are selected based on their current market cap and the foreseen CAGR and growth.
The 5 steps process:
Step 1: Secondary Research:
Secondary Research or Desk Research is as the name suggests is a research process wherein, we collect data through the readily available information. In this process we use various paid and unpaid databases which our team has access to and gather data through the same. This includes examining of listed companies’ annual reports, Journals, SEC filling etc. Apart from this our team has access to various associations across the globe across different industries. Lastly, we have exchange relationships with various university as well as individual libraries.

Step 2: Primary Research
When we talk about primary research, it is a type of study in which the researchers collect relevant data samples directly, rather than relying on previously collected data. This type of research is focused on gaining content specific facts that can be sued to solve specific problems. Since the collected data is fresh and first hand therefore it makes the study more accurate and genuine.
We at SNS Insider have divided Primary Research into 2 parts.
Part 1 wherein we interview the KOLs of major players as well as the upcoming ones across various geographic regions. This allows us to have their view over the market scenario and acts as an important tool to come closer to the accurate market numbers. As many as 45 paid and unpaid primary interviews are taken from both the demand and supply side of the industry to make sure we land at an accurate judgement and analysis of the market.
This step involves the triangulation of data wherein our team analyses the interview transcripts, online survey responses and observation of on filed participants. The below mentioned chart should give a better understanding of the part 1 of the primary interview.

Part 2: In this part of primary research the data collected via secondary research and the part 1 of the primary research is validated with the interviews from individual consultants and subject matter experts.
Consultants are those set of people who have at least 12 years of experience and expertise within the industry whereas Subject Matter Experts are those with at least 15 years of experience behind their back within the same space. The data with the help of two main processes i.e., FGDs (Focused Group Discussions) and IDs (Individual Discussions). This gives us a 3rd party nonbiased primary view of the market scenario making it a more dependable one while collation of the data pointers.
Step 3: Data Bank Validation
Once all the information is collected via primary and secondary sources, we run that information for data validation. At our intelligence centre our research heads track a lot of information related to the market which includes the quarterly reports, the daily stock prices, and other relevant information. Our data bank server gets updated every fortnight and that is how the information which we collected using our primary and secondary information is revalidated in real time.

Step 4: QA/QC Process
After all the data collection and validation our team does a final level of quality check and quality assurance to get rid of any unwanted or undesired mistakes. This might include but not limited to getting rid of the any typos, duplication of numbers or missing of any important information. The people involved in this process include technical content writers, research heads and graphics people. Once this process is completed the title gets uploader on our platform for our clients to read it.
Step 5: Final QC/QA Process:
This is the last process and comes when the client has ordered the study. In this process a final QA/QC is done before the study is emailed to the client. Since we believe in giving our clients a good experience of our research studies, therefore, to make sure that we do not lack at our end in any way humanly possible we do a final round of quality check and then dispatch the study to the client.