Antimony in Semiconductor Market Size & Trends:
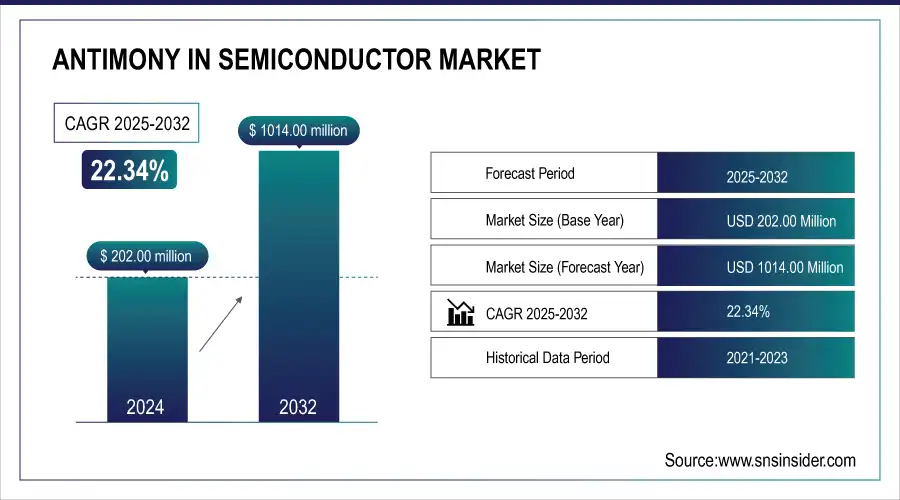
The Antimony in Semiconductor Market size was valued at USD 202.00 million in 2024 and is expected to reach USD 1014.00 million by 2032, growing at a CAGR of 22.34% over the forecast period 2025-2032. A key driver for antimony in semiconductor market growth is the rapid expansion of 5G and IoT technologies. These applications demand high-performance, miniaturized components, boosting the use of antimony-based semiconductors for their excellent conductivity, thermal stability, and efficiency in advanced electronic and optoelectronic devices.
To Get more information On Antimony in Semiconductor Market - Request Free Sample Report
Antimony is one of the key compounds that are used to enhance the performance of the electronic components, which in turn is boosting the growth of the semiconductor market in Antimony. Antimony primarily serves as a semiconductive dopant, contributing to higher conductivity and enhanced stability in diodes, infrared detectors, and hall-effect sensors. Antimony, for use in compound semiconductors like indium antimonide and gallium antimonide, is useful for optoelectronics and thermoelectric devices. As the need for high-speed electronics, high-powered smart devices, and efficient communication systems continuously increases, demand for semiconducting materials will be high, giving antimony a strategically favourable situation.
In 2024, global antimony production reached approximately 600,000 tons, marking a slight increase from previous years. China remained the leading producer, contributing 47% of the total output, followed by Russia and Tajikistan.
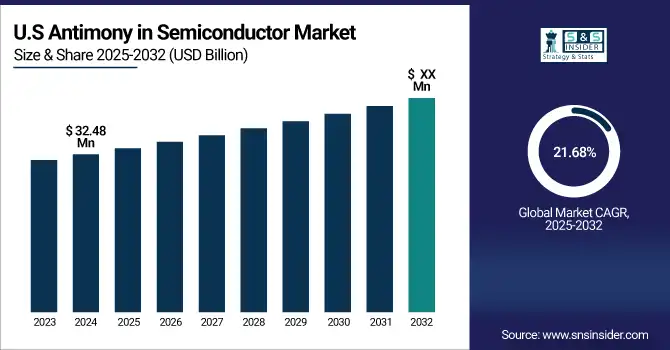
The U.S. antimony in semiconductor market size is estimated to be USD 32.48 million in 2024 and is projected to grow at a CAGR of 21.68%. As China has increasingly restricted exports of critical minerals, including antimony, the U.S. is now looking to develop its domestic source of production, creating a U.S. antimony semiconductor market. The boosting of domestic supply chains is evident with projects, such as Perpetua Resources' Stibnite Gold Project in Idaho, that could source 35% of U.S. antimony demand.
Antimony in Semiconductor Market Dynamics:
Key Drivers:
-
Antimony Powers Next-Gen Semiconductors with Speed, Sensitivity, and Efficiency Boost
The necessity of highly productive electronic components and complex optoelectronic devices is one of the major factors boosting the usage of antimony in semiconductor industry. Alloyed with indium to form ternary semiconductors such as InSb, antimony greatly increases electron mobility and infrared sensitivity, making it indispensable for infrared detectors, Hall-effect devices, and thermoelectric applications. Furthermore, the expanding consumer electronics, automotive electronics, and industrial automation trends create enormous pressure on manufacturers to adopt materials with higher speed, better thermal stability, and energy efficiency, which leads to the rising adoption of antimony-based semiconductors.
-
As of 2024, over 13 billion IoT devices are in use globally, many requiring compact, high-efficiency semiconductors, driving demand for specialized materials like antimony alloys. Additionally, modern vehicles include 100+ electronic control units (ECUs) on average, increasing the use of high-performance semiconductor materials.
Restraints:
-
Supply Risks and Environmental Concerns Challenge Antimony’s Semiconductor Market Stability
Antimony is mainly sourced from China, which is one of the key restraints that concern the antimony semiconductor market, as supply is limited, and major sources are concentrated in a small geographic area. Over-reliance on a single region also puts the supply chain at risk of export restrictions, fluctuating prices, and geopolitical tensions. Moreover, the extraction and processing of antimony carries severe threats to the environment and human health, which has resulted in stringent prohibitions and operational difficulties for mining companies, disrupting production and consequently, availability.
Opportunities:
-
Antimony Unlocks Future Tech Potential in Quantum, 5G, and Green Electronics
Next-generation quantum computing and emerging low-power electronics are expected to drive the rapid adoption of Antimony in Semiconductor Market trends, which in turn will provide substantial growth opportunities. The distinct electronic characteristics of antimony could pave the way for its potential in nanotechnology and compound semiconductors as the demand for miniaturized and energy-efficient devices continues to expand. In addition, the adoption of 5G and the rising allotment for defense and aerospace systems that require antimony-doped infrared sensors present numerous profitable avenues for the stakeholders in the market.
Leading research labs and companies (like IBM and Google) are developing quantum processors that require materials with high electron mobility and low power consumption. InSb nanowires (an antimony compound) are being actively explored for topological qubits due to their strong spin–orbit interaction and superconducting properties.
Challenges:
-
Overcoming Integration and Recycling Hurdles to Advance Antimony Semiconductor Applications
Another difficulty stems from the lack of a method of integrating antimony-based materials with standard semiconductor fabrication processes due to technological limitations. Although antimony provides excellent electron mobility, adjacent junction compatibility with existing CMOS is more limited, requiring additional R&D investments. In addition to this, there are currently no efficient industrial-scale systems for recycling antimony from end-of-life electronics, as this is still in its infancy. To unlock the full potential of antimony, these technical and environmental challenges need to be addressed before practical implementations in advanced semiconductor applications are achieved.
Antimony in Semiconductor Market Segmentation Analysis:
By Type
In 2024, antimony trioxide accounted for 46.3% of the total market due to its usage as a flame-retardant synergist and a glass clarifying agent in semiconductor fabrication processes. Due to its unique physical characteristics, antimony trioxide is additionally used as a raw material to manufacture high-purity compounds required for infrared sensors, diodes, and optoelectronic applications, as it forms a vital material in the manufacturing of electronic and semiconductor devices.
During 2025-2032, antimony pentachloride is expected to exhibit the highest growth rate. The segment’s growth is mainly attributed to its potential use in producing antimony-based compound semiconductors, including gallium antimonide and indium antimonide, which have already gained traction for use in next-generation technologies, such as 5G, IoT, and advanced imaging systems.
By Application
In 2024, integrated circuits (ICs) accounted for the largest share of 38.4% of global antimony in the semiconductor market, as ICs are the basic building blocks containing systems that are the widely used devices found in most electronic devices, such as smartphones, computers, automotive electronics, and industrial systems. Antimony Applications have been focused on semiconductor dopants and compound materials utilized for IC products that serve to enhance thermal stability and electrical conductivity.
The power electronics segment is projected to experience the fastest growth in the antimony in semiconductor market during 2025-2032. This growth can be traced back to the requirements for high-performance power management systems used in electric vehicles (EVs), sustainable infrastructure, and industrial automation. Gallium antimonide and other compounds based on antimony have become the object of renewed interest in the power semiconductor devices domain because of their beneficial properties, enabling reliable operation at high voltages and especially high temperatures.
By End-User Industry
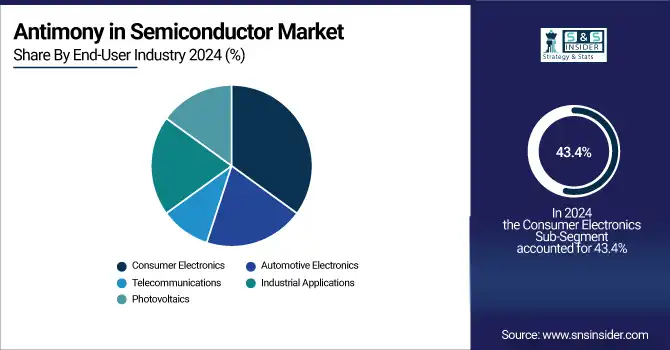
The antimony in the semiconductor market was dominated by the consumer electronics segment, which accounted for a leading share of 43.4% in 2024. This significance owes its weightage to the comprehensive integration of semiconductors in almost every device we use today, including smartphones, laptops, tablets, and iconic wearable technologies.
During 2025-2032, the automotive electronics segment is predicted to develop with the fastest CAGR. The big push toward electric vehicles (EVs), self-driving technologies, and advanced driver-assistance systems (ADAS) is generating strong demand for durable, thermally stable, or high-performance semiconductors. The strong characteristics of antimony-based materials make them ideal for use in sensors, power management systems, and communication modules of the vehicle, making them one of the most recommended materials to be incorporated in future automotive electronics.
Antimony in Semiconductor Market Regional Analysis:
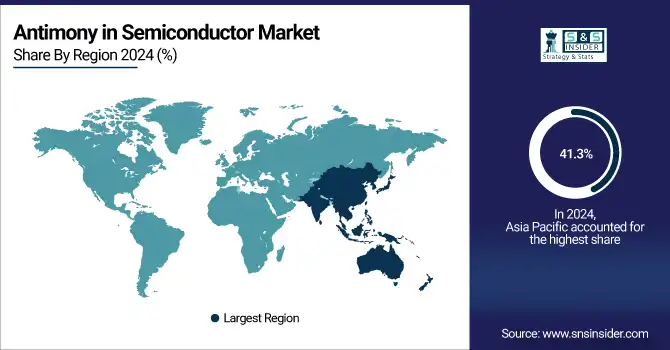
The antimony in semiconductor market share was led by Asia Pacific and accounted for a share of 41.3% in 2024, and is projected to grow at the fastest CAGR during the forecast period. The impressive growth momentum in Asia is underpinned by a robust semiconductor manufacturing ecosystem, fast technology adoption, and the expanding electronics and automotive industries here. Internationally, China, South Korea, Taiwan, and Japan have targeted global technology leadership in semiconductor fabrication, investing in next-generation sectors, such as 5G, AI, and EVs that require semiconductor materials with advanced performance, including antimonide-based compounds.
Get Customized Report as per Your Business Requirement - Enquiry Now
Although China is set to impose export controls on antimony in 2024, it is also the biggest producer and consumer of minerals globally, which is infused into infrared detectors, LEDs, and thermoelectric devices. Meanwhile, more advanced materials are required for high-end chip making owing to the increasing demand from South Korea’s Samsung Electronics and Taiwan’s TSMC.
-
China, the world's largest producer of antimony, accounting for approximately 48% of global supply in 2023, implemented export restrictions on the mineral starting September 15, 2024, citing national security concerns
Demand for North American antimony is gradual, with growing investment for advanced electronics, national security, and the need to limit foreign critical mineral supply. Demand for improved infrared detectors, power semiconductors, and thermoelectric devices is expected to support the increased antimony functionality within these sectors, including defense, aerospace, and automotive applications. The U.S. government supply chain policies, which also serve as a key driver of growth, promise funding and incentives, further ensuring that all the facets of supply chain infrastructure develop domestically in the years to come.
North America is currently headed by the U.S., with a significant technological lead and ongoing proactive measures to establish domestic antimony mining and refining operations to lessen imports and firm up its competitive role in semiconductor and other advanced electronics applications.
There is a steady growth in the European antimony market in the semiconductor industry as the region is emphasizing technological sovereignty, environmental sustainability, and secure supply chains. As demand for high-performance semiconductors expands in electric vehicles, renewable energy systems, and industrial automation, the antimony-based compound serves as a crucial material for applications, such as infrared detection, thermoelectric devices, and power electronics.
Europe's semiconductor market for antimony was dominated by Germany in 2024, owing to the presence of a mature electronics sector and substantial investments in high-purity applications of antimony. Its standing was bolstered not only by the country's increased efforts to recycle domestically, and ship fewer recyclables to China.
The Middle East & Africa antimony in the semiconductor market is backed by increasing electronics manufacturing and the development of critical minerals. Within the Middle East, it is the United Arab Emirates (UAE), ahead of other countries, which is strategically positioning itself to diversify its tech and industrial base. South Africa has heavy resources and mining structures for antimony, and it is the only African country that is a leader in antimony. With global supply chains turning the tide, both regions are making claims to alternative sources and processing centres of Antimony utilised for semiconductor and defence technologies.
Antimony in Semiconductor Companies are:
Some of the major antimony in semiconductor market companies are AMG Advanced Metallurgical Group N.V., United States Antimony Corporation, Mandalay Resources Ltd., Korea Zinc Co., Ltd., Umicore S.A., Huachang Antimony Industry, Hunan Gold Corporation Limited, Nihon Seiko Co., Ltd., Recyclex S.A., and GeoProMining Ltd.
Recent News:
-
In April 2025, the U.S. Antimony Corporation announced expansion plans for its Thompson Falls, Montana, smelter, aiming to double current production. The move supports U.S. supply chain resilience amid growing antimony demand and Chinese export restrictions.
-
In April 2024, Alkane Resources and Mandalay Resources announced a merger of equals to form a diversified gold and antimony producer.
| Report Attributes | Details |
|---|---|
| Market Size in 2024 | USD 202.00 Million |
| Market Size by 2032 | USD 1014.00 Million |
| CAGR | CAGR of 22.34% From 2025 to 2032 |
| Base Year | 2024 |
| Forecast Period | 2025-2032 |
| Historical Data | 2021-2023 |
| Report Scope & Coverage | Market Size, Segments Analysis, Competitive Landscape, Regional Analysis, DROC & SWOT Analysis, Forecast Outlook |
| Key Segments | • By Product (Antimony Trioxide, Antimony Pentachloride, Antimony Alloys, Antimony Sulfide) • By Application (Integrated Circuits (ICs), Power Electronics, Optoelectronics, Transistor Fabrication, Photovoltaics, Other Niche Applications) • By End-User Industry (Consumer Electronics, Automotive Electronics, Industrial Applications, Telecommunications, Photovoltaics) |
| Regional Analysis/Coverage | North America (US, Canada, Mexico), Europe (Germany, France, UK, Italy, Spain, Poland, Turkey, Rest of Europe), Asia Pacific (China, India, Japan, South Korea, Singapore, Australia, Rest of Asia Pacific), Middle East & Africa (UAE, Saudi Arabia, Qatar, South Africa, Rest of Middle East & Africa), Latin America (Brazil, Argentina, Rest of Latin America) |
| Company Profiles | AMG Advanced Metallurgical Group N.V., United States Antimony Corporation, Mandalay Resources Ltd., Korea Zinc Co., Ltd., Umicore S.A., Huachang Antimony Industry, Hunan Gold Corporation Limited, Nihon Seiko Co., Ltd., Recyclex S.A., GeoProMining Ltd. |
Get in Touch
