Infrared Detector Market Size:
Get more information on Infrared Detector Market - Request Sample Report
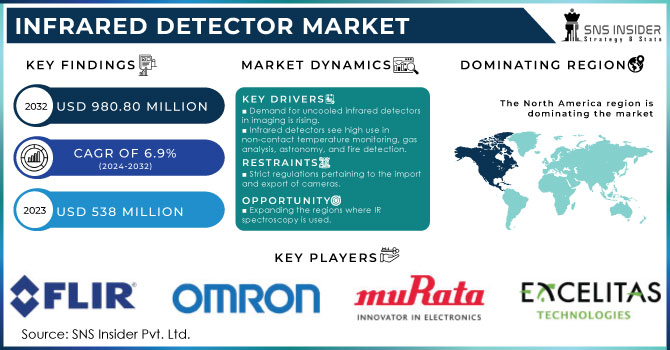
The Infrared Detector Market Size was valued at USD 538 million in 2023 and is expected to reach USD 980.80 million by 2032 and grow at a CAGR of 6.9% over the forecast period 2024-2032.
Infrared detector is used to detect infrared radiation to measure temperature and detect movement. It is integrated with various devices used for monitoring, automobile, testing, detection and measurement. Infrared sensors that convert infrared radiation into electrical signals are one of the most important sensor groups in the defense system. These dictators also play a key role in programs such as medical, automotive, industrial, security, and consumer electronics. The fast-growing industrial sector, government investment, and the economic incentives of the defense sector continue to support the growth of the global infrared detector market. These work very well compared to other detectors for safety and monitoring purposes because of their compact size and ability to detect infrared light from a distance.
Infrared Detector Market Dynamics:
KEY DRIVERS:
-
Uncooled infrared detectors are becoming more and more common, and demand for infrared detectors for imaging applications is rising.
-
Applications for non-contact temperature monitoring, gas analysis, astronomy, and fire detection have a high infrared detector penetration rate.
-
Infrared detectors are being used more and more in motion and people-sensing solutions.
RESTRAINTS:
-
Strict regulations pertaining to the import and export of cameras.
OPPORTUNITIES:
-
Expanding the regions where IR spectroscopy is used.
-
Infrared detector demand is increasing in developing nations.
CHALLENGES:
-
Access to alternative technology.
-
Detection of materials/objects positioned outside the wavelength range.
IMPACT OF COVID-19:
COVID-19 has had a severe impact on the global economy as well as all industries. To stop the plague from spreading, governments in several countries have established borders. The initial phase of the epidemic's global shutdown in many countries has had a significant influence on people's lives and quality of life. As a result, the global supply chain has been shattered. The global economy has shrunk as commodity demand has decreased considerably. Due to the outbreak, which has caused a lack of immature materials, production in all industries has been slowed. Productivity declines are caused by variables such as depreciation and supply chain disruption. In the most realistic scenario, the infrared detector market is expected to grow at a CAGR of 7.1% between 2023-2030
Infrared Detector Market Segment Overveiw:
Based on Technology, the infrared detector market is segmented into cooled and uncooled. Infrared detectors made using materials such as mercury cadmium telluride (HgCdTe) and indium antimonide (InSb) require mechanical cooling to increase their signal-noise level at usable levels. Indium gallium arsenide (InGaAs)-based detectors show similar sensitivity to HgCdTe- and InSb-based detectors at room temperature; however, they can be cooled to increase their sensitivity. Infrared coolers are usually cooled thermoelectrically or cryogenically. In some cases, liquid nitrogen is also used to cool detectors. Cooling reduces the temperature of the detector, allowing us to reduce the noise caused by heat to a minimum and improve its efficiency. However, cooled infrared coolers are more expensive than non-cooled, which prevents their mass gain. Cool infrared detectors receive applications in scientific research, astronomy, safety and observation, and spectroscopy, among others, where high accuracy is paramount.
Based on Wavelength, the infrared detector market is segmented into Medium Wavelength Infrared (MWIR), Long-wave infrared (LWIR) and Near-infrared (NIR) & Short Wavelength Infrared (SWIR).
Nearby infrared light is called light intensity within a wavelength range of 12,500–4,000 cm. The near-infrared spectrum (NIR) typically ranges from 0.7 to 1.0 μm. Immediate infrared light absorption is based on vibration of the object. However, it is much weaker in strength compared to absorbing infrared light as it is based on tones and tones integrated into a medium infrared light source. Therefore, measuring samples that include weak absorption is difficult, but the fact that samples can be measured without purification is an advantage. Short-wavelength infrared frequency (SWIR) ranges from 1 μm to 3 μm. Also known as infrared display. Infrared radiation from a light source reflects an object in the same way as radiation in a visible distance. The MWIR and LWIR lights are removed from the objects. SWIR is similar to visible light, in which photons are displayed or absorbed by an object, providing the strong brightness needed for high-resolution imagery.
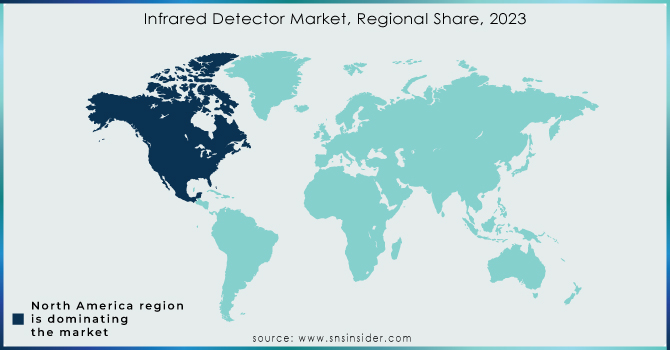
Infrared Detector Market Regional Analysis:
The infrared detector market in North America has been subdivided into the US, Canada, and Mexico. Regional market growth is dominated by large companies such as Excelitas Technologies (US), Texas Instruments (US), Honeywell International (US), and FLIR Systems (US). These companies strive to increase their presence in emerging markets such as APAC In order to diversify their product offerings and increase their market share, well-known infrared detector manufacturers also gain profit from working with, collaborating with, and partnering with organizations from a variety of sectors, including automotive, military, and defense.
Get Customized Report as per your Business Requirement - Request For Customized Report
KEY PLAYERS:
The key players in the infrared detector market are FLIR Systems, Murata Manufacturing, EXCELITAS Technologies, Omron Corporation, TE Connectivity, Hamamatsu Photonics, Texas Instruments, Nippon Ceramic, INFRATEC & Other Players.
| Report Attributes | Details |
|---|---|
| Market Size in 2023 | US$ 538 Million |
| Market Size by 2032 | US$ 980.80 Million |
| CAGR | CAGR of 6.9% From 2024 to 2032 |
| Base Year | 2023 |
| Forecast Period | 2024-2032 |
| Historical Data | 2020-2022 |
| Report Scope & Coverage | Market Size, Segments Analysis, Competitive Landscape, Regional Analysis, DROC & SWOT Analysis, Forecast Outlook |
| Key Segments | • By Type (Indium Gallium Arsenide, Thermopile, Mercury Cadmium Telluride, Pyroelectric, Microbolometer, Others) • By Technology (Cooled, Uncooled) • By Wavelength (Medium Wavelength Infrared (MWIR), Long-Wave Infrared (LWIR), Near-Infrared (NIR) & Short Wavelength Infrared (SWIR)) • By Application (Temperature Measurement, Gas & Fire Detection, Scientific Applications, People And Motion Sensing, Security And Surveillance, Spectroscopy And Biomedical Imaging) • By Vertical (Industrial, Nonindustrial) |
| Regional Analysis/Coverage | North America (US, Canada, Mexico), Europe (Eastern Europe [Poland, Romania, Hungary, Turkey, Rest of Eastern Europe] Western Europe] Germany, France, UK, Italy, Spain, Netherlands, Switzerland, Austria, Rest of Western Europe]), Asia Pacific (China, India, Japan, South Korea, Vietnam, Singapore, Australia, Rest of Asia Pacific), Middle East & Africa (Middle East [UAE, Egypt, Saudi Arabia, Qatar, Rest of Middle East], Africa [Nigeria, South Africa, Rest of Africa], Latin America (Brazil, Argentina, Colombia, Rest of Latin America) |
| Company Profiles | FLIR Systems, Murata Manufacturing, EXCELITAS Technologies, Omron Corporation, TE Connectivity, Hamamatsu Photonics, Texas Instruments, Nippon Ceramic, INFRATEC |
| Key Drivers | • Uncooled infrared detectors are becoming more and more common, and demand for infrared detectors for imaging applications is rising. • Applications for non-contact temperature monitoring, gas analysis, astronomy, and fire detection have a high infrared detector penetration rate. • Infrared detectors are being used more and more in motion and people sensing solutions. |
| Restraints | • Strict regulations pertaining to import and export of cameras. |
Frequently Asked Questions
Manufacturers, Consultants, Association, Research Institutes, private and university libraries, suppliers, and distributors of the product.
Top-down research, bottom-up research, qualitative research, quantitative research, and Fundamental research.
Due to the covid-19 outbreak, which has caused a lack of immature materials, production in all industries has been slowed. Productivity declines are caused by variables such as depreciation and supply chain disruption.
The market has been segmented with respect to type, technology, wavelength and application.
The Infrared Detector Market size was valued at USD 538 million in 2023 and is expected to reach USD 980.80 million by 2032 and grow at a CAGR of 6.9% over the forecast period 2024-2032.
Get in Touch
