Aromatic Solvents Market Size Analysis
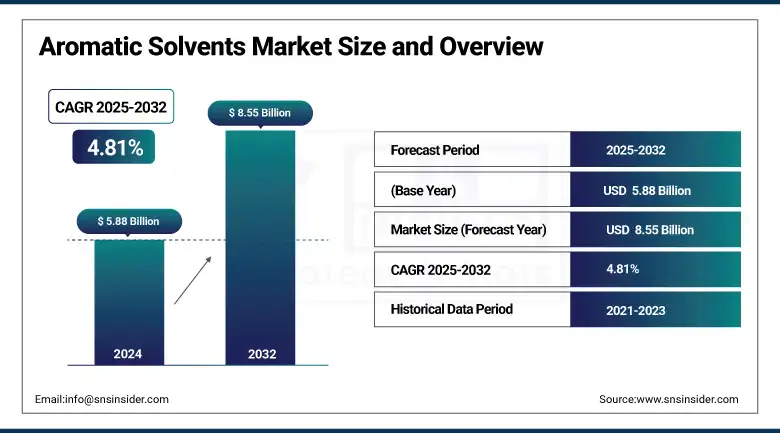
The Aromatic Solvents Market size was valued at USD 5.88 billion in 2024 and is expected to reach USD 8.55 billion by 2032, growing at a CAGR of 4.81% over the forecast period of 2025-2032.
The aromatic solvents market is expanding due to rising demand in paints, coatings, adhesives, and industrial cleaning products, driven by urbanization and stricter low-VOC regulations. Key players are adopting circular technologies and data-driven process optimization, while innovations in toluene and benzene derivatives support sustainable formulations. Cleaner production methods and strategic alliances further strengthen market positions.
According to the U.S. EPA, toluene is primarily produced by 21 companies via petroleum refining. In July 2024, the American Chemistry Council and API formed the Naphthalene Workgroup to address benzene derivative regulations. With stricter safety measures for benzene, toluene, styrene, ethylbenzene, and xylenes, the market is poised for steady growth across major applications and regions, reflecting a forward-moving, sustainable trajectory.
Aromatic Solvents Market Size and Forecast
-
Market Size in 2024: USD 5.88 Billion
-
Market Size by 2032: USD 8.55 Billion
-
CAGR: 4.81% from 2025 to 2032
-
Base Year: 2024
-
Forecast Period: 2025–2032
-
Historical Data: 2022–2023
To Get more information On Aromatic Solvents Market - Request Free Sample Report
Aromatic Solvents Market Trends:
-
Rising demand from paints & coatings is driving market growth, with the segment accounting for over 45% of total aromatic solvent consumption globally.
-
Expansion of the automotive and construction sectors is supporting solvent usage, as global construction output is projected to grow at 4–5% annually over the next decade.
-
Increasing use in adhesives, sealants, and printing inks is contributing to steady demand, with industrial solvent consumption rising at a CAGR of around 3–4%.
-
Growth in petrochemical refining capacity, particularly in Asia-Pacific, is strengthening supply, with the region holding over 50% of global aromatic solvent production capacity.
-
Regulatory pressure on VOC emissions is encouraging development of low-aromatic and high-purity variants, with over 30% of new product launches focused on improved environmental compliance.
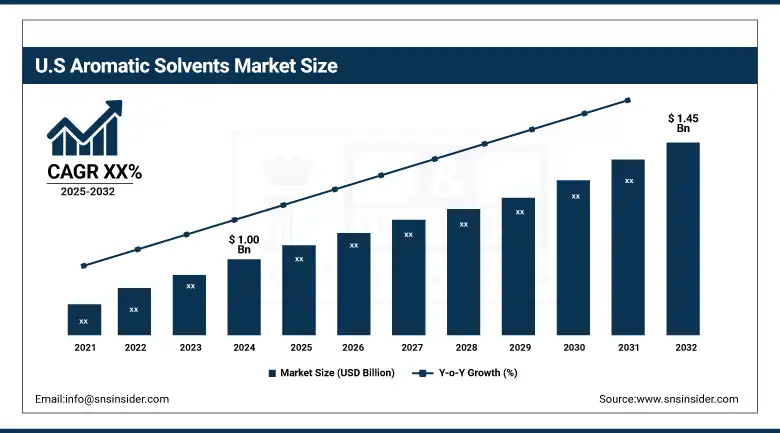
The U.S. leads the region with a market size of USD 1.00 billion and is projected to have a value of USD 1.45 billion by 2032. The growth is due to the widespread adoption in the automotive and construction sectors, backed by EPA regulations on aromatic hydrocarbon solvents. Canada is showing strong aromatic solvents market growth, especially in low-VOC solvent development through eco-grants. Mexico’s growing coatings industry further elevates the region’s significance in global aromatic solvents market trends.
Aromatic Solvents Market Drivers
-
Shift to renewable feedstocks expands sustainable solvent portfolios
Strategic partnerships, for instance the 2022 partnership between Agilyx and BioBTX, are using waste plastics and biomass to produce circular aromatic chemicals. The market trends for renewable toluene and benzene derivatives in aromatic solvents are largely due to these efforts. These bio-based products boost the growth of the aromatic solvents market and seize alternative domestic supply chains as the demand for environmentally friendly formulations rises. By using feedstocks derived from biomass, companies that produce aromatic solvents can increase their market share and size while meeting consumer demand for industrial cleaning products with lower carbon intensity.
-
Regulatory momentum in solvent recovery spurs greener production
Companies that produce aromatic solvents are investing in solvent recovery systems and circular processes as a result of the Resource Conservation and Recovery Act's stricter regulations. The need for recovery and reuse procedures is further supported by the US Environmental Protection Agency's report that toluene is produced at 30 facilities run by 21 companies in the US. This regulatory push is improving operational efficiency, cutting waste, and changing market trends for aromatic solvents. Early adopters gain from reduced expenses and enhanced compliance, bolstering the market expansion for aromatic solvents and more general sustainability-driven developments.
Aromatic Solvents Market Restraints
-
New emission limits increase compliance burden on chemical plants
The US Environmental Protection Agency finalized more stringent Clean Air Act air pollution limits in April 2024, focusing on chemicals like toluene and benzene. The need to reduce toxic emissions at more than 200 chemical plants has resulted in a significant increase in operating and compliance expenses. Businesses that use these emissions-intensive processes to produce aromatic solvents are directly impacted. Capital-intensive filtration systems and increased monitoring responsibilities pose operational and financial challenges, especially for small and mid-sized businesses. As a result, the market for aromatic solvents is becoming more consolidated.
Aromatic Solvents Market Segment Highlights
-
By Product
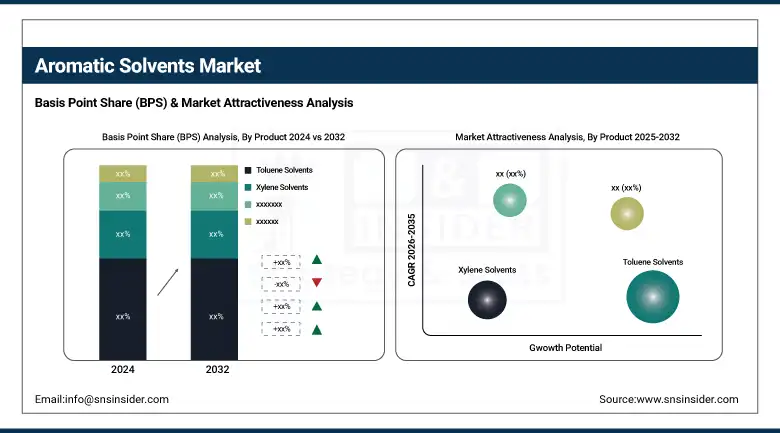
Toluene dominated the aromatic solvents market in 2024, holding 45.4% share, driven by demand from paints, coatings, and industrial cleaning solutions, despite being classified as a VOC by the EPA. Its high-purity applications, highlighted by the National Institute of Standards and Technology, reinforce its role as a market driver. Meanwhile, xylene is projected to grow at a 5.23% CAGR through 2032, fueled by electronics and automotive coating applications. Specialty-grade xylene blends meet low-VOC regulations and are increasingly used for cleaning resins and delicate equipment. Advances in benzene derivatives and aromatic hydrocarbon solvents across industries further boost market growth, positioning both toluene and xylene as key contributors to the expansion of the aromatic solvents market.
-
By Application
Paints and coatings led the aromatic solvents market in 2024, accounting for 37.9% of share, driven by the use of toluene and xylene in industrial, automotive, and architectural coatings due to their superior dissolution properties. OSHA ensures safe large-scale application, while urban infrastructure growth and rising automobile production further boost demand. The segment is also the fastest-growing, with a projected CAGR of 5.15% during 2025–2032, driven by low-VOC coatings and advanced solvent blends. According to NIST, since 2022, specialty-grade solvents for automotive paints and nanocoatings have seen rising demand. Investments in customized solvent systems are accelerating market growth, positioning paints and coatings as a key driver for the expansion of the aromatic solvents market globally.
Aromatic Solvents Market Regional Analysis
Asia Pacific Aromatic Solvents Market Insights
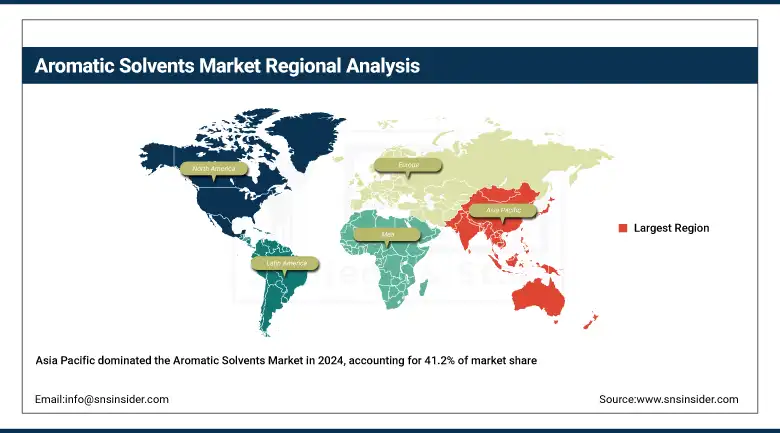
Asia Pacific dominated the aromatic solvents market in 2024 with a 41.2% share and is the fastest-growing region with the highest CAGR of 5.09%. China's and India's industrial growth is the cause of the increase. Regional development is being accelerated by government support for the toluene market and benzene derivatives. India's Chemicals Ministry provides incentives for domestic production, while China's Ministry of Ecology and Environment promotes low-VOC aromatic hydrocarbon solvents in automotive coatings. These patterns show the remarkable growth of the aromatic solvents market, which is being driven by building, infrastructure, and growing consumer demand.
Get Customized Report as per Your Business Requirement - Enquiry Now
North America Aromatic Solvents Market Insights
North America held a 28.4% aromatic solvents market share in 2024, supported by robust industrial demand for toluene and benzene derivatives in paints and industrial cleaning agents.
Europe Aromatic Solvents Market Insights
Europe secured a 20.6% aromatic solvents market share in 2024, driven by regulatory compliance and demand for industrial cleaning agents and paints. Germany leads the regional aromatic solvents companies with investments in green chemistry and solvent recycling. France and the United Kingdom are strengthening market share by supporting bio-based benzene derivatives through public-private partnerships. The European Chemicals Agency (ECHA) and the Solvent Emissions Directive continue shaping sustainable practices, reflecting a strong aromatic solvents market analysis and adherence to environmental priorities.
Latin America Aromatic Solvents Market Insights
Latin America is a growing region in the aromatic solvents market, driven by the expanding paints and coatings sector in Brazil and Mexico. Brazil’s National Petroleum Agency reported an increase in toluene output for local manufacturing, boosting the aromatic solvents market size. Regional demand for industrial cleaning agents and adhesives is also growing due to infrastructure development. Government-backed sustainability programs encourage the adoption of low-VOC aromatic hydrocarbon solvents, especially in Brazil, strengthening the region’s position in the global aromatic solvents market trends.
Middle East & Africa Aromatic Solvents Market Insights
The Middle East & Africa region is emerging as a promising market for aromatic solvents, led by Saudi Arabia and the UAE’s expanding petrochemical sectors. The UAE Ministry of Energy is promoting the cleaner production of toluene and benzene derivatives for use in coatings and industrial cleaning agents. South Africa is investing in local manufacturing to reduce import reliance, aligning with the aromatic solvents market growth objectives. These advancements demonstrate the region's shift toward value-added solvent production and regulatory-backed sustainability.
Competitive Landscape for Aromatic Solvents Market
Haltermann Carless (HCS Group) was founded in 1859 and is headquartered in Frankfurt, Germany. Haltermann Carless (HCS Group) specializes in high-value hydrocarbon specialties, including aromatic solvents under the Caromax brand. Their product portfolio includes Caromax 20 and Caromax 28, widely used in agrochemicals, fuel additives, oilfield chemicals, and industrial coatings. HCS emphasizes sustainability and innovation through advanced refining and hydrogenation technologies, serving global customers across Europe, Asia, and North America. Their solutions support low-VOC formulations and specialty solvent applications, reinforcing their position as a key player in the aromatic solvents market.
-
In May 2025, Haltermann Carless inaugurated a new hydrogenation unit at the Speyer site to enhance product quality and sustainability, supporting increased demand for specialty aromatic solvents.
Panama Petrochem Ltd. was established in 1982 and is headquartered in India. Panama Petrochem Ltd. manufactures over 80 petroleum specialty products, including aromatic solvents. Their offerings serve industries such as inks, textiles, pharmaceuticals, and power generation. The company focuses on expanding production capabilities, improving quality, and delivering reliable solvent solutions tailored to industrial and specialty applications. Panama Petrochem combines advanced refining processes with stringent quality controls to ensure consistency and compliance with environmental regulations, catering to domestic and international markets.
-
In July 2024, Panama Petrochem expanded its production capacity with a new facility in Dahej, India, aiming to meet growing domestic and international demand for aromatic solvents.
SolvChem, Inc. was founded in 1981 and is based in Texas, USA SolvChem, Inc. is a distributor and blender of specialty and commodity chemicals, including aromatic naphthas and other industrial-grade solvents. They provide tailored blending, packaging, and distribution services for multiple industries, including automotive coatings, inks, and industrial cleaning. The company emphasizes custom solutions, quality assurance, and timely delivery to support clients’ production processes. SolvChem’s offerings align with evolving market demands for low-VOC and specialty-grade solvents, reinforcing their role as a key independent player in the aromatic solvents sector.
-
In August 2024, SolvChem launched a new line of custom-blended aromatic naphthas specifically designed for the automotive coatings sector, enhancing product versatility and market reach.
Key Players Aromatic Solvents Market
-
Cepsa Química
-
SK Geo Centric Co., Ltd.
-
Haltermann Carless (HCS Group)
-
Panama Petrochem Ltd.
-
Huntsman Corporation
-
DHC Solvent Chemie GmbH
-
Nova Molecular Technologies, Inc.
-
Pon Pure Chemicals Group
-
RB Products, Inc.
-
GJ Chemical
-
Independent Chemical Corporation
-
Chemical Solutions South LLC
-
Shandong Menjie New Material Co., Ltd.
-
Maoming Connection New Material Co., Ltd.
-
Guangzhou Shengruixiang Trading Co., Ltd.
-
Shaanxi Baisifu Biological Engineering Co., Ltd.
-
Dongguan Yuanyuan Power Lubrication Tech Co., Ltd.
-
BaioCco
| Report Attributes | Details |
|---|---|
| Market Size in 2024 | USD 5.88 billion |
| Market Size by 2032 | USD 8.55 billion |
| CAGR | CAGR of 4.81% From 2025 to 2032 |
| Base Year | 2024 |
| Forecast Period | 2025-2032 |
| Historical Data | 2021-2023 |
| Report Scope & Coverage | Market Size, Segments Analysis, Competitive Landscape, Regional Analysis, DROC & SWOT Analysis, Forecast Outlook |
| Key Segments | •By Product (Toluene Solvents, Xylene Solvents, Ethylbenzene Solvents, Others) •By Application (Paints & Coatings, Adhesives, Printing Inks, Cleaning & Degreasing, Others) |
| Regional Analysis/Coverage | North America (US, Canada, Mexico), Europe (Germany, France, UK, Italy, Spain, Poland, Turkey, Rest of Europe), Asia Pacific (China, India, Japan, South Korea, Singapore, Australia, Rest of Asia Pacific), Middle East & Africa (UAE, Saudi Arabia, Qatar, South Africa, Rest of Middle East & Africa), Latin America (Brazil, Argentina, Rest of Latin America) |
| Company Profiles |
Recochem Inc., Cepsa Química, SK Geo Centric Co., Ltd., Haltermann Carless (HCS Group), Panama Petrochem Ltd., SolvChem, Inc., Huntsman Corporation, DHC Solvent Chemie GmbH, Nova Molecular Technologies, Inc., Pon Pure Chemicals Group, RB Products, Inc., GJ Chemical, Independent Chemical Corporation, Chemical Solutions South LLC, Shandong Menjie New Material Co., Ltd., Maoming Connection New Material Co., Ltd., Guangzhou Shengruixiang Trading Co., Ltd., Shaanxi Baisifu Biological Engineering Co., Ltd., Dongguan Yuanyuan Power Lubrication Tech Co., Ltd., and BaioCco |
Get in Touch
