
Audience Analytics Market Report Scope & Overview:
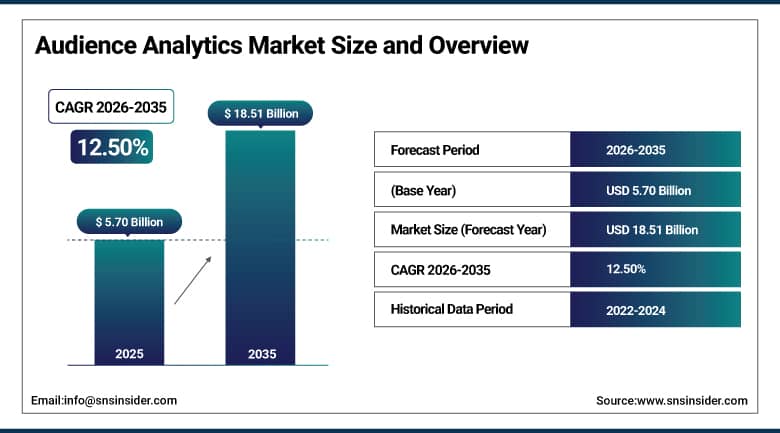
The Audience Analytics Market was valued at USD 5.70 Billion in 2025 and is estimated at USD 6.41 Billion in 2026. The market is projected to reach USD 18.51 Billion by 2035, expanding at a CAGR of 12.50% from 2026 to 2035. Audience analytics includes tools and technology that gather, resolve, and analyze data about consumers such as viewers, visitors, shoppers, and buyers through different screens, online platforms, apps, and physical places. This industry’s growth is driven by factors such as video fragmentation, increased digital advertising spending, need for cross-screen measurements, and the use of artificial intelligence.
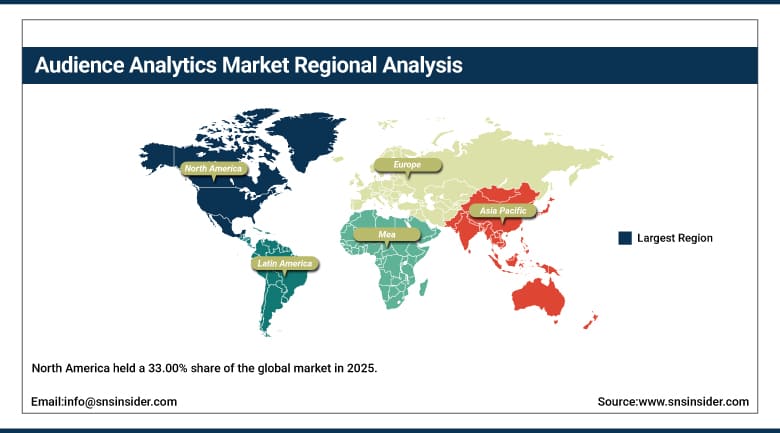
North America was the dominant regional market during 2025, having a market share of 33.00%. The main measure of currency, advertising technology companies, as well as media and retail companies, operate here. Europe comes next after North America, and this is due to the presence of broadcasters and stringent consent laws. Asia Pacific region is the fastest-growing region because of its consumers who love to use mobile phones, preference for streaming services, and online payments. Latin America and the Middle East & Africa regions are small but fast-growing. Together, these regions give vendors a wide base of buyers that pay for measurement, targeting, and experience tools.
To Get More Information On Audience Analytics Market - Request Free Sample Report
Key Report Takeaways
- By component, solution held a 60.50% share in 2025, while services are the fastest growing.
- By application, customer experience management held a 41.00% share in 2025, while sales and marketing management is the fastest growing.
- By organization size, large enterprises held a 58.00% share in 2025, while small and medium enterprises are the fastest growing.
- By end user, media and entertainment held a 28.50% share in 2025, while IT and telecom is the fastest growing.
- By region, North America held a 33.00% share in 2025, while Asia Pacific is the fastest growing.
Market Trends and Insights
Currency competition is reshaping television measurement. Several measurement providers now hold industry certification alongside the long-standing incumbent, and buyers increasingly mix panel, set-top box, and connected television data to plan and verify campaigns.
Third-party cookies remain in the main browser, yet first-party data and clean room collaboration are becoming the standard approach. Brands and media owners build consented audience graphs and share aggregated insights instead of user-level identifiers.
Generative and agentic tools are entering advertising workflows. Providers add assistants that build audiences, explain performance, and adjust campaigns automatically, which shortens the time between insight and action.
Consolidation and divestiture are continuing. Measurement and verification companies are combining, non-core units are being sold, and capital structures are being reset to fund investment in artificial intelligence and cross-platform data.
Drivers Impact Analysis
|
Driver |
(~) Percentage Point Impact on Market CAGR |
Geographic Relevance |
Impact Timeline |
|---|---|---|---|
|
Streaming Fragmentation and Cross-Platform Measurement |
+2.74% |
North America, Europe |
Short term (2 years or less) |
|
Digital Advertising Spend Growth |
+2.31% |
Global |
Medium term (2 to 4 years) |
|
AI-Based Prediction and Personalization |
+1.96% |
North America, Asia Pacific |
Medium term (2 to 4 years) |
|
First-Party Data and Clean Room Adoption |
+1.58% |
North America, Europe |
Short term (2 years or less) |
|
Retail and Venue Audience Intelligence |
+1.12% |
Asia Pacific, Middle East & Africa |
Long term (4 years or more) |
Streaming Fragmentation and Cross-Platform Measurement
Viewing has spread across broadcast, cable, streaming services, social video, and connected devices, and no single data source shows who watched what. Advertisers and media owners therefore buy measurement that combines panel data, set-top box records, and smart television signals into one view of reach and frequency. Rising ad-supported streaming tiers add inventory that must be verified, and agencies want deduplicated audiences across platforms before shifting budgets. These needs keep spending on measurement and analytics software steady. Sports rights and live events add demand. Advertisers also expect results within days.
Digital Advertising Spend Growth
Advertising budgets continue to move toward digital channels, retail media, and connected television, and buyers expect proof of results for each dollar. Audience analytics is helpful for planning, attribution, frequency control, and reporting; thus, providers gain as spending increases. Analytics is also used by brands for channel comparison purposes and budget justification to the finance department. The growth in the number of retail media networks adds extra demand due to the fact that the retailer sells audiences based on purchasing information and must provide independent verification of reach and lift for advertisers.
AI-Based Prediction and Personalization
Machine learning models predict churn, lifetime value, content preferences, and likely responders with more accuracy than rule-based segments. Media companies use them to recommend programs and reduce cancellations, retailers personalize offers, and marketers build lookalike groups from consented data. Generative assistants let non-technical staff ask questions in plain language and receive charts and recommendations, which widens the user base inside each account. Providers that embed these features see higher usage and stronger renewal rates. Subscription services also depend on such models.
First-Party Data and Clean Room Adoption
Privacy rules and platform policies push brands to rely on data collected directly from customers. Companies invest in customer data platforms, consent tools, and clean rooms where partners match audiences without exposing personal records. These projects need analytics for segmentation, overlap analysis, and measurement, and they extend the market beyond advertising teams into customer experience and product groups. Retailers, banks, and telecom operators with large customer bases are leading adopters in this area. Banks and insurers are also adopting these tools.
Retail and Venue Audience Intelligence
Stores, airports, malls, stadiums, and out-of-home screens use cameras, sensors, wireless signals, and mobile location data to count visitors and understand dwell time and flow. Operators apply the results to staffing, layout, rent, and ad pricing, and digital signage networks sell impressions with measured audiences. Anonymous counting methods address privacy concerns, and falling sensor costs let smaller venues adopt the same tools. Growth is strongest in cities with dense retail and transport networks. Transport hubs are active buyers. Costs keep falling.
Restraints Impact Analysis
|
Driver |
(~) Percentage Point Impact on Market CAGR |
Geographic Relevance |
Impact Timeline |
|---|---|---|---|
|
Privacy, Consent and Data Access Limits |
-2.18% |
Global |
Short term (2 years or less) |
|
Fragmented Identity and Measurement Standards |
-1.64% |
North America, Europe |
Medium term (2 to 4 years) |
|
High Data Processing and Integration Cost |
-1.21% |
Global |
Medium term (2 to 4 years) |
|
Regulatory Divergence Across Regions |
-0.89% |
Europe, Asia Pacific |
Long term (4 years or more) |
Privacy, Consent and Data Access Limits
Audience analytics depends on behavioral data, yet consent requirements, platform restrictions, and consumer opt-outs reduce the signals available. Browsers, mobile operating systems, and large platforms control access to their own data, which limits what independent providers can measure. Companies must invest in consent management, anonymization, and legal review, and some projects stop when data use cannot be justified. Smaller firms feel the cost most, and any breach damages trust with audiences and partners. Regulators also fine companies for unlawful tracking.
Fragmented Identity and Measurement Standards
Buyers and sellers use different identifiers, panels, and definitions of an impression or a viewer, so results from one provider rarely match another. Advertisers must compare reports from several vendors before planning, and disputes over currency slow transactions. Efforts to agree on standards take time, and until they succeed, many organizations pay for duplicate measurement. This duplication raises cost, delays decisions, and makes it harder for newer providers to win accounts against entrenched incumbents. Small vendors face the highest barriers.
High Data Processing and Integration Cost
Combining logs, panel files, transaction records, and device signals requires storage, identity resolution, and engineering skills that many organizations lack. Cloud processing fees rise with data volume, and connecting analytics to advertising, customer, and content systems takes months. Return on investment is hard to prove when benefits appear across several departments, which slows approval of budgets, and mid-sized firms often limit projects to a single channel or business unit for these reasons. Skilled analysts are costly. Fees keep rising fast.
Regulatory Divergence Across Regions
Laws on consent, profiling, children, and cross-border transfer differ by country and by state, and many are still changing. Multinational companies must design products for the strictest rule or run separate versions, which raises cost and slows launches. Uncertainty about final texts makes buyers cautious about long contracts for audience targeting use cases, and enforcement priorities can shift quickly, so legal teams often hold back new data uses until guidance is published. Fines add risk. Compliance costs rise as rules multiply.
Audience Analytics Market Segment Analysis
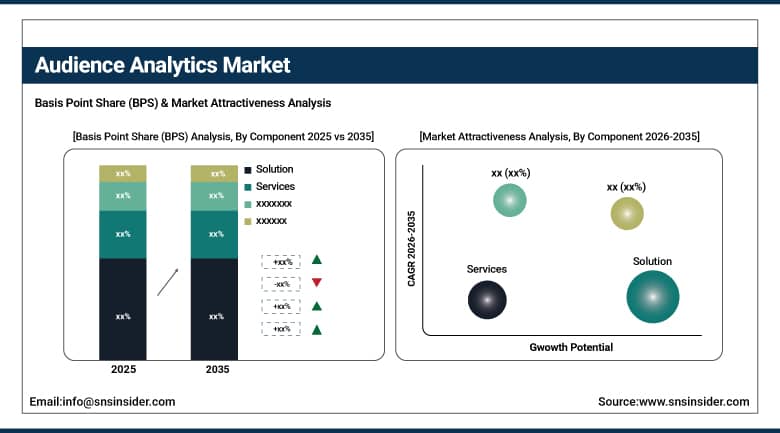
By Component, Solution Dominates Audience Analytics Market; Services to Register Fastest Growth.
Solution held 60.50% of the market in 2025. It includes platforms for measurement, audience segmentation, attribution, journey analytics, dashboards, and reporting, delivered mainly as cloud subscriptions. Products are constantly upgraded with the integration of artificial intelligence and new connectors to their database, while clients like using one platform for connecting their audience data, content data, and campaign data. Licenses provide a regular stream of income, while major players include their audience tools together with marketing and data solutions, thus increasing account value and retention.
The services are expected to grow with a CAGR of 14.90% during the period of 2026-2035. The enterprises require assistance of consultation, integration, data engineering, managed analytics and training to convert their software into decisions and very few possess in-house analysts. The increasing demand for identity resolution projects, creation of clean rooms and measurement audit is seen. The agencies and system integrators develop their practice around the audience strategy. Managed service providers can cater to those enterprises that seek solutions without investing in specialist staffs.
By Application, Customer Experience Management Dominates Audience Analytics Market; Sales and Marketing Management to Register Fastest Growth.
Customer experience management held 41.00% of the market in 2025. Organizations use audience data to understand how visitors, viewers, and customers move across channels, where they leave, and what drives satisfaction and loyalty. Media companies tune programming and subscription offers, retailers improve stores and sites, and telecom operators reduce churn. Experience scores now feed executive dashboards, and the link between experience and revenue keeps this application ahead of other uses. Loyalty data improves accuracy and adds depth to each profile.
The market of sales and marketing management is estimated to record a CAGR of 14.60% during 2026-2035. The marketers require audience-building, targeting, attribution, and campaign optimization in the context of consented data, while the sales representatives rely on intent and engagement signals for prioritizing their accounts. The advent of retail media, connected TV, and social video creates additional inventory that needs to be planned and measured. The use of generative technologies saves time in developing audience and creative variations. Budgets are rising. Teams test offers faster.
By Organization Size, Large Enterprises Dominate Audience Analytics Market; Small and Medium Enterprises to Register Fastest Growth.
Large enterprises accounted for 58.00% of the market in 2025. They own the biggest customer and audience datasets, spend the most on advertising, and have the staff to run measurement, data science, and privacy programs. Broadcasters, global brands, telecom operators, and retail chains buy enterprise platforms under multi-year agreements and often use several measurement providers at once. Governance requirements push them toward vendors with strong consent controls, audit trails, and integration capability. Dedicated teams spread tools across brands.
SMEs are estimated to grow at a CAGR of 15.20% during the period of 2026-2035. The cloud subscription, pre-built dashboards, and built-in analytics provided through website, commerce, and advertising solutions eliminate the requirement of specialized team. Local merchants, regional media companies, and web-based businesses utilize customer analytics in order to tailor their marketing campaigns, pricing strategies, and stock management. Providers introduce various pricing plans along with guided onboarding process, and marketplaces facilitate small buyers in comparing tools. Local partners offer support. Setup takes days.
By End User, Media and Entertainment Dominates Audience Analytics Market; IT and Telecom to Register Fastest Growth.
Media and entertainment accounted for 28.50% of the market in 2025. Advertisers, broadcasters, publishers, studios, and other companies rely on audience numbers to set the prices of their inventory, program their schedules and prove delivery of campaigns. The fragmented way in which people view television through linear and on-demand channels creates a need for independent measurements, with subscription-based platforms using audience analytics to minimize churn and allocate content budgets. Advertisers in sports, news, and entertainment value verified reach. Rights holders seek proof.
IT and telecom is projected to expand at a CAGR of 14.50% from 2026 to 2035. Operators and technology companies hold rich subscriber, network, and application data, and they use audience analytics for churn prediction, product bundling, targeted offers, and advertising businesses built on first-party data. Rollout of fifth-generation services and connected devices increases the volume of usable signals, while software companies apply product analytics to improve engagement across applications and platforms. Their large customer bases support steady spending.
Geography Analysis
|
Region |
Major Country |
Share within Region, 2025 (%) |
|---|---|---|
|
North America |
United States |
88.00% |
|
Europe |
Germany |
27.00% |
|
Asia Pacific |
China |
36.00% |
|
Middle East & Africa |
Saudi Arabia |
28.00% |
|
Latin America |
Brazil |
48.00% |
North America Audience Analytics Market
North America held a 33.00% share of the global market in 2025. The United States market was valued at USD 1.66 Billion in 2025 and is projected to grow at a CAGR of 12.00% from 2026 to 2035. The region is home to the main measurement providers, advertising technology firms, and streaming services. Indiana, Kentucky, and Rhode Island comprehensive privacy laws took effect in January 2026, adding consent, opt-out, and data protection assessment duties for audience data collection and targeting.
Chrome has kept third-party cookies, which removed a feared deadline but did not end the shift to first-party data and clean rooms. Large advertisers and broadcasters in Canada and the United States continue to buy measurement from several providers, and retail media networks are expanding quickly. Competition among measurement companies is intense, and buyers press for transparent methods, lower cost, and faster reporting. Mexico is included under Latin America in this report. Universities and research groups also contribute methods that vendors adopt in products.
Get Customized Report as Per Your Business Requirement - Enquiry Now
Europe Audience Analytics Market
Europe held a 26.00% share of the global market in 2025, with Germany as the leading country, followed by the United Kingdom, France, Italy, and Spain. The Digital Omnibus was put forth by the European Commission in November 2025, and this proposal seeks to introduce changes to GDPR and cookie laws, including an exception to GDPR in terms of audience measurement and limiting consent requests, both of which are being closely watched by providers. Germany is a country with large broadcasters, publishers, and car producers that conduct research on audiences and the effectiveness of media.
TV broadcasters in the public domain and commercial networks in the region employ audience analytics in scheduling their shows and reporting back to their regulators and advertising partners. Tight consent requirements mean that first-party data, contextual targeting, and privacy-preserving analytics prevail. British and French retailers make investments in visitor analytics in-store and online, while telecommunications companies in the Nordic region and Spain develop ad services from their customer data. Outdoor advertisers extend measured audiences by deploying analytics on digital out-of-home media. Cinema chains and event organizers also adopt audience counting.
Asia Pacific Audience Analytics Market
Asia Pacific accounted for 28.00% of the global market in 2025 and is the fastest-growing region, with a projected CAGR of 15.40% from 2026 to 2035. China takes the first place, then comes Japan, followed by India, South Korea, and Australia. The Digital Personal Data Protection Rules were notified by India in November 2025, and the primary obligations of data fiduciaries have been introduced till 2027, influencing the consent and profiling of the audience platform. Fast smartphone usage increases the data, and the airports use counting devices.
Mobile-first consumers, short video platforms, and large streaming services produce huge volumes of engagement data, and advertisers in China, India, and Southeast Asia demand measurement that links viewing to purchases. Japan and South Korea have mature broadcasters and device makers with strong television data, while Australia has well-developed cross-platform measurement. Retail operators and shopping centers across the region deploy visitor counting and location analytics at scale. Regional streaming services and e-commerce platforms also invest heavily in recommendation and attribution tools.
Latin America Audience Analytics Market
Latin America is a smaller regional market, led by Brazil, followed by Mexico, Argentina, and Colombia. The national data protection authority of Brazil published its supervision priorities for 2026 and 2027 in December 2025, covering the rights of data subjects, the handling of sensitive data in advertising, and artificial intelligence, which raises compliance expectations for audience data providers. Mexico, Argentina, and Colombia add demand through growing streaming adoption, expanding retail media networks, and local broadcasters that modernize measurement systems to attract advertisers.
Large broadcasters and streaming platforms in Brazil and Mexico use analytics to plan content and sell advertising, and growth in connected television gives advertisers new data to buy against. Retailers and banks build customer data platforms to personalize offers, while shopping centers and transport operators in Chile and Colombia adopt visitor analytics. Local measurement companies work with global providers to improve coverage of cable, streaming, and mobile audiences. Smartphone growth supports mobile audience data. Digital payments growth also creates transaction data that marketers combine with audience signals.
Middle East & Africa Audience Analytics Market
The Middle East & Africa region holds a 6.00% share and is expected to grow steadily from a small base. The United Arab Emirates, Saudi Arabia, Turkey, Israel, and South Africa are the main markets. The personal data protection law of Saudi Arabia has been fully enforceable since September 2024, and its regulator reports active enforcement, so audience platforms operating in the Kingdom must manage consent and data handling carefully. Israel and Turkey add technology talent. Large events and expanding tourism also raise demand.
Gulf broadcasters, streaming services, and telecom operators invest in audience measurement as advertising shifts to digital and connected television. Malls, airports, and tourism sites in the United Arab Emirates use visitor analytics to manage crowds and sell media. South African media owners and retailers operate some of the most developed analytics practices in Africa, and mobile operators across the continent use subscriber data to design offers and advertising products. Government tourism programs also fund visitor counting. Regional agencies are building media measurement skills.
Competitive Landscape
The Audience Analytics Market is fragmented. Adobe, Google, and Comscore are named by most industry sources as main vendors, while Nielsen, Samba TV, iSpot, VideoAmp, and Kantar Media lead in television and cross-platform measurement. Quantcast, LiveRamp, and Lotame serve audience building and data collaboration, and Audiense, JCDecaux, and Quividi address specialized needs in web, social, outdoor, and venue audiences. Competition depends on data coverage, method transparency, integration, and price.
Providers are adding artificial intelligence assistants and clean room features, and measurement companies are combining or selling non-core units to fund investment. Buyers prefer vendors that connect across platforms and accept independent verification.
Audience Analytics Market Industry Leaders
1. Adobe: Adobe Analytics, Customer Journey Analytics, and Experience Cloud for audience and campaign insight.
2. Google: Google Analytics, audience insights, and cloud data tools that support segmentation and measurement.
3. Comscore: Cross-platform audience measurement for television, digital, and movies-related analytics.
Companies Covered in this Report
- Adobe
- Comscore
- Nielsen
- Quantcast
- Samba TV
- iSpot
- VideoAmp
- LiveRamp
- Lotame
- Audiense
- JCDecaux
- Quividi
- Kantar Media
Recent Industry Developments
- October 2025: Google announced that Chrome keeps its approach to third-party cookies and retired the Privacy Sandbox advertising interfaces.
- January 2026: Comscore completed a recapitalization with its preferred stockholders.
- May 2026: Advaya Capital completed the acquisition of Comscore Movies.
- June 2026: Nielsen and Mediaocean announced a collaboration to bring Nielsen audience segments into the Prisma planning platform.
- June 2026: Samba TV acquired Bestever AI to expand generative tools for advertisers.
- August 2026: Nielsen agreed to acquire DoubleVerify in an all-cash transaction valued at about USD 2.15 Billion, with closing expected in the first quarter of 2027.
Scope and Research Methodology
This study covers the Audience Analytics Market, which includes revenue from software and services that collect, resolve, and analyze data on viewers, visitors, and customers to support measurement, targeting, experience improvement, and planning. Solutions for television, digital, social, retail, and venue audiences are included, whether delivered through cloud or on-premises systems. The base year is 2025, the forecast period is 2026 to 2035, and all values are expressed in USD. The market is segmented by component, application, organization size, end user, and region. General web hosting, advertising media spend, and raw data licensing are excluded, and revenue is recorded once at the provider that bills the customer. Bundled products are allocated to analytics using disclosed pricing.
The research program combines secondary and primary research. Secondary research draws on company annual reports, investor presentations and filings, regulator and government databases, trade association data, product documentation, and peer-reviewed and industry publications. Primary research consists of structured interviews and surveys with executives, product leaders, data scientists, media planners, and marketing and customer experience heads across the value chain, including measurement providers, platform vendors, agencies, and brands. Interview samples span North America, Europe, Asia Pacific, Latin America, and the Middle East & Africa, so differences in adoption and regulation are reflected in each segment. Expert panels review the draft estimates and challenge assumptions on adoption and pricing.
Market engineering follows a bottom-up build from provider revenue, subscription volumes, and services contracts, which is cross-checked top-down against advertising technology and marketing analytics spending. Triangulation across these views confirms segment and regional estimates. Forecasts consider streaming growth, privacy regulation, adoption of artificial intelligence, and macroeconomic conditions, and every dataset passes an analyst quality review before it is published. Sensitivity checks cover pricing, adoption speed, and currency rates, and gaps in disclosed figures are filled through expert estimates tested against independent sources. Where audited provider results exist, they anchor the revenue mix.
Audience Analytics Market Report Scope :
| Report Attributes | Details |
|---|---|
| Market Size in 2025 | USD 5.70 Billion |
| Market Size by 2035 | USD 18.51 Billion |
| CAGR | CAGR of 12.50% From 2026 to 2035 |
| Base Year | 2025 |
| Forecast Period | 2026-2035 |
| Historical Data | 2022-2024 |
| Report Scope & Coverage | Market Size, Segments Analysis, Competitive Landscape, Regional Analysis, DROC & SWOT Analysis, Forecast Outlook |
| Key Segments | • By Component (Solution and Services) • By Application (Customer Experience Management, Sales and Marketing Management, Competitive Analysis, and Others) • By Organization Size (Large Enterprises and Small and Medium Enterprises) • By End User (Media and Entertainment, IT and Telecom, Retail and E-commerce, Healthcare, Automotive and Transportation, and Others) |
| Regional Analysis/Coverage | North America (US, Canada), Europe (Germany, UK, France, Italy, Spain, Russia, Poland, Rest of Europe), Asia Pacific (China, India, Japan, South Korea, Australia, ASEAN Countries, Rest of Asia Pacific), Middle East & Africa (UAE, Saudi Arabia, Qatar, South Africa, Rest of Middle East & Africa), Latin America (Brazil, Argentina, Mexico, Colombia, Rest of Latin America). |
| Company Profiles | Google, Comscore, Nielsen, Quantcast, Samba TV, iSpot, VideoAmp, LiveRamp, Lotame, Audiense, JCDecaux, Quividi, Kantar Media |

Frequently Asked Questions
The market was valued at USD 5.70 Billion in 2025 and is estimated at USD 6.41 Billion in 2026. It is projected to reach USD 18.51 Billion by 2035.
The market is projected to grow at a CAGR of 12.50% from 2026 to 2035, supported by streaming fragmentation, digital advertising growth, and artificial intelligence.
North America leads, with a 33.00% share in 2025, owing to the main measurement providers, advertising technology firms, and streaming services.
Asia Pacific is the fastest-growing region, with a CAGR of 15.40% from 2026 to 2035, driven by mobile-first audiences and expanding streaming platforms.
Solution, customer experience management, large enterprises, and media and entertainment lead their axes. Services, sales and marketing management, small and medium enterprises, and IT and telecom grow fastest.
Adobe, Google, Quantcast, Nielsen, and Comscore are among the major players.
Privacy and consent limits, fragmented identity and measurement standards, integration cost, and regulatory divergence restrain faster growth.
