Automated Container Terminal Market Size & Growth:
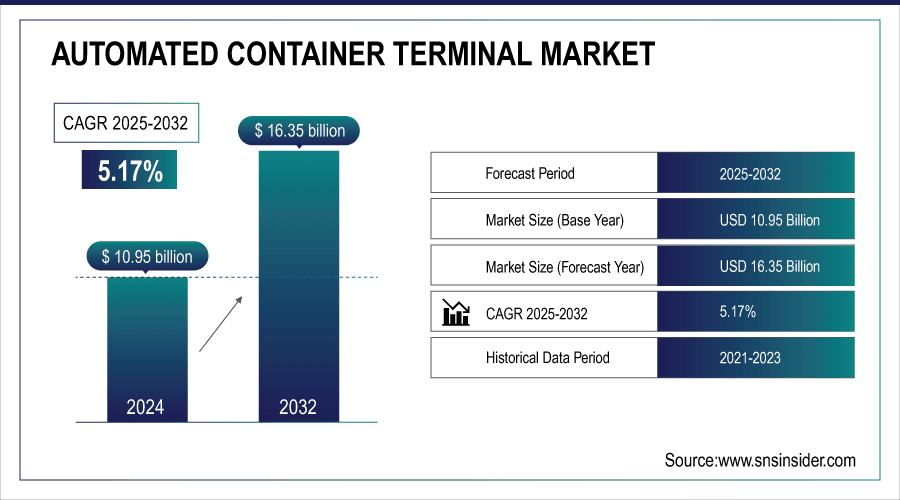
The Automated Container Terminal Market size was valued at USD 12.15 Billion in 2025 and is projected to reach USD 20.11 Billion by 2035, growing at a CAGR of 5.17% during 2026-2035
The Automated Container Terminal Market is expanding due to the rise in global trade and demand for shorter turnover times is a major factor driving demand for automation solutions. Market growth is also being escalated by investment in high-level robotics, IoT and AI-based terminal systems. Along these lines, increased regulation focusing on safety and environmental performance is driving ports to automate processes.
Fully automated terminals can reduce labor costs by up to 50% and increase operational efficiency by 25% compared to traditional terminals.
To Get More Information On Automated Container Terminal Market - Request Free Sample Report
Automated Container Terminal Market Trends
-
The new port infrastructure allows to start using only fully automated equipment. It permits terminals to plan operations based on automation, and reducing dependence on manual labor.
-
AI software and predictive analytics are everywhere in the port. Such technologies promote better decision making, better resource allocation and improved performance overall.
-
Drivers who are environmentally conscious are also looking for driver automation that consumes less power.
-
Growth of the EM and trading centers such as EMEA provides opportunity for automation. Accordingly, ports in these areas are modernizing to accommodate rising containership calls.
-
Automation systems improve productivity, safety and environmental impact in all of terminal operations.
The U.S. Automated Container Terminal Market size was valued at USD 2.20 Billion in 2025 and is projected to reach USD 6.21 Billion by 2035, growing at a CAGR of 5.88% during 2026-2035. Automated Container Terminal Market growth is driven by rising containerized cargo volumes, thereby demanding quicker and high efficient port operations. Increasing global trade and import-export activities are also driving ports to upgrade its infrastructure with automation technology. Automation investments in robotics, AI and IoT enabled terminal systems are driving efficiencies and capacity by taking out human error.
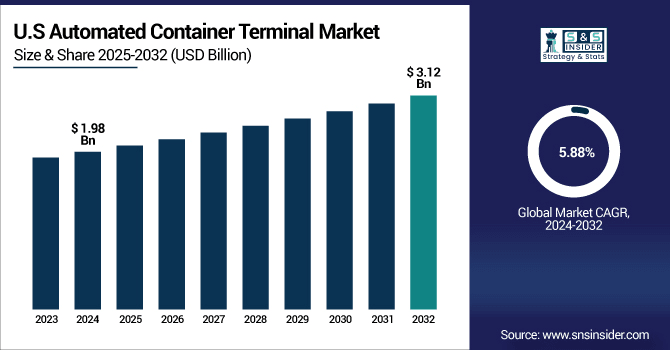
Automation is also being driven by regulation to safety and environmental standards. Effective terminal operations minimize vessel turnaround and space utilization. Shortages of labor and the requirement for consistent output are also important considerations.
Automated Container Terminal Market Segment Analysis
-
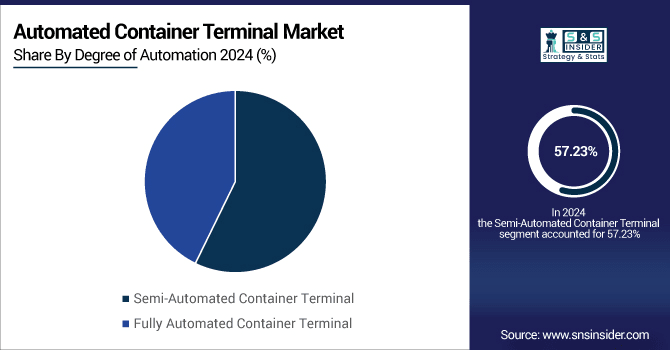
By degree of automation, Semi-Automated Container Terminals led the market with approximately 57.23% share in 2025, while Fully Automated Container Terminals were the fastest-growing segment with a CAGR of 5.45%.
-
By project type, Brownfield Projects dominated with around 64.11% share in 2025, whereas Greenfield Projects were the fastest-growing, recording a CAGR of 5.41%.
-
By offering, Equipment held the largest share at approximately 49.31% in 2025, with Software emerging as the fastest-growing segment at a CAGR of 5.74%.
-
By solutions, Hardware accounted for about 43.22% share in 2025, while Software was the fastest-growing segment, registering a CAGR of 5.56%.
By Degree of Automation, Semi-Automated Container Terminal Leads Market While Fully Automated Container Terminal Registers Fastest Growth
By degree of automation, semi-automated container terminals are the leading, as they are extensively employed across brownfield ports. Automated container terminals are the fastest growing, with increasing robotization and AI technologies. Ports are turning more toward automation to clear workers and avoid human error. The increasing digitalization and smart port operations also contribute to an accelerating penetration of fully automated system. In general, the market represents a trend towards increased levels of automation to cope with increasing trade volumes.
By Project Type, Brownfield Projects Dominate While Greenfield Projects Shows Rapid Growth
By project type, brownfield projects have huge investments and this is currently the market with the greatest potential thanks to the upgrading and enlargement of port facilities. New-build (greenfield) is thriving as new ports and terminals emerge in response to growing trade flows. This expansion is mostly due to advanced technology investments and upgrades. Efficiency, safety and sustainability are also considerations which will drive greenfield development.
By Offering, Equipment Lead While Software Registers Fastest Growth
By offering, equipment as a market leader is based on the overall high demand for cranes, AVs, as well as physical terminal infrastructure. Software is projected to be the most rapidly growing segment, due to increasing demand for sophisticated management solutions, real-time monitoring, and predictive analytics. The involvement of AI/IoT tech is also facilitating software implementations. Software Investments The move toward digital solutions and smarter port operations is driving investment in software. General, hardware and software are important factors improving the terminal efficiency and performance.
By Solutions, Hardware Lead While Software Grow Fastest
By solutions, hardware is the frontrunner, with cranes, automatic vehicles and other physical terminal infrastructure in high demand. Software is actually the fastest-growing, where the use of more sophisticated management systems, real-time monitoring and predictive analytics is driving growth. AI and IoT convergence speed the software release cycle. The trend toward digitalization and smart port operations continues to drive software uptake.
Automated Container Terminal Market Growth Drivers:
-
Rising Global Trade and Technological Advancements Accelerate Automated Container Terminal Market Growth.
Development of international trade has caused the need of faster and more efficient port services. Automation and AI-related developments in robotics and IoT eliminate the potential for human error. Ports are upgrading infrastructure to manage increases in containers and improve turnaround times. Automated container terminal solutions are also being adopted in pursuit of operational productivity, safety and environmental sustainability.
The average capacity utilization of major global container terminals is over 80%, pushing ports to expand and modernize.
Automated Container Terminal Market Restraints:
-
High Initial Investment and Complex Implementation Challenges Limit Market Expansion
Development of international trade has caused the need of faster and more efficient port services. Automation and AI-related developments in robotics and IoT eliminate the potential for human error. Ports are upgrading infrastructure to manage increases in containers and improve turnaround times. Automated container terminal solutions are also being adopted in pursuit of operational productivity, safety and environmental sustainability.
Automated Container Terminal Market Opportunities:
-
Growing Demand for Smart Ports and Digitalization Creates New Market Potential
For new ports, greenfield projects offer the possibility of using fully automated equipment. AI software and predictive analytics can provide a boost in operational efficiency. Interest from eco-friendly operators is driven by sustainability and energy saving solutions. growth of the Expansion in emerging markets and trading centers presents excellent growth opportunities for automation solutions.
AI-powered terminal operating systems (TOS) improve yard utilization by 20–25% and reduce container rehandling by up to 35%.
Automated Container Terminal Market Regional Analysis
Asia-pacific Automated Container Terminal Market Insights
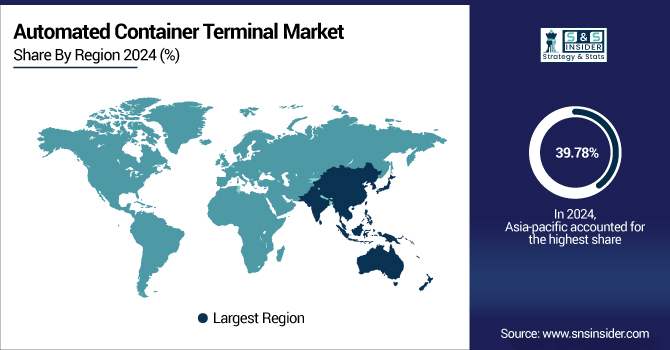
In 2024 Asia-Pacific dominated the Automated Container Terminal Market and accounted for 39.78% of revenue share, this leadership is due to the increasing international trade and investment in modernized, high-efficiency terminals. Increased utilization of leading automation capabilities, like robotics and AI, also helped with operational efficiencies. Favorable government support and planned programs to promote smart ports also strengthened regional supremacy in the market.
Get Customized Report as Per Your Business Requirement - Enquiry Now
China Automated Container Terminal Market Insights
China is a world leader in port automation, having 18 fully automated container terminals and 27 more under construction/gearing for an update. For the countries, it has completed a highly independently planned, developed and manufactured smart port management system, which has greatly eased the dependence on foreign technology.
North America Automated Container Terminal Market Insights
North America is expected to witness the fastest growth in the Automated Container Terminal Market over 2025-2032, with a projected CAGR of 5.99% due to rising need for quicker and more efficient port operations. Implementation of industrial automation technologies such as robots, artificial intelligence (AI), and the Internet of Things (IoT) is improving productivity while reducing dependence on labor. Modernization and construction of new terminals are also backing the expansion of the market.
U.S. Automated Container Terminal Market Insights
The U.S. Automated Container Terminal Market is expanding due to growing demand for efficient and high-throughput port operations. Use of new robots, AI and IoT technologies are improving efficiency and decreasing dependence on manpower. Big industry names are behind the development of equipment, software, and integrated systems designed to help ports to perform at their best.
Europe Automated Container Terminal Market Insights
The European Automated Container Terminal Market is expanding at a steady pace on account of growing need for high-throughput and efficient port operations. Increasing more advanced forms of automation, such as robotics, AI and IoT, are driving efficiency while decreasing dependence on human resource. Large ports are undertaking modernization projects and constructing new terminals to cater for increased trade traffic.
Germany Automated Container Terminal Market Insights
The Germany automated container terminal market is growing at a substantial rate on account of the rising demand for efficient port operations and the evolving automation technologies. HHLA Container Terminal Burchardkai in Hamburg is set to automate its entire system of gantry cranes and electric vehicles as part of efforts to boost productivity and improve its capacity.
Latin America (LATAM) and Middle East & Africa (MEA) Automated Container Terminal Market Insights
The Automated Container Terminal Market is experiencing moderate growth in the Latin America (LATAM) and Middle East & Africa (MEA) regions, due to driving the growth of the Latin America & MEA automated container terminal markets. Brazil, Chile, Peru, UAE, Egypt & Morocco Among the countries that are heavily investing in automation technology and modern infrastructure. Large ports in these areas have already been increasing their capacity, productivity and efficiency in order to accommodate international trade and investment.
Automated Container Terminal Market Competitive Landscape:
Cargotec Corporation is an enterprise leading globally in the Automated Container Terminal Market, known for its complete range of terminal automation systems. The company manufactures sophisticated equipment, software and fully integrated systems for the global container terminal industry. Part of its advancements consist of automated cranes, smart vehicles and smart terminal management platform through real time monitoring and optimization.
-
In March 2024, Kalmar, a part of Cargotec, partnered with Forterra (formerly RRAI) to develop autonomous terminal tractor solutions. This collaboration focuses on creating automation-ready terminal tractors and integrating them with Kalmar One fleet management systems to enhance automated terminal operations. The project aims to improve efficiency and flexibility in container handling at ports.
Konecranes is the forerunner in the Automated Container Terminal Market providing port automation solutions. Konecranes on the move The number of terminals Konecranes is serving around the world continues to increase as the company supports ports in their drive to modernize their operations and adopt sustainable, high-performance ports solutions.
-
In July 2025, Konecranes has made significant strides in the Automated Container Terminal Market. Hutchison Ports ECT Rotterdam ordered 42 Li-Ion Automated Guided Vehicles (AGVs) and Automated Charging Stations to modernize and electrify operations at its Euromax terminal.
Liebherr is one of the key active participants in the ACT market providing cutting-edge port automation packages. The company offers a variety of equipment from automatic container yard cranes to rail cranes designed to improve productivity and safety at container terminals. Liebherr has a long-standing tradition of innovation and we keep developing automation solutions which are adjusted according to the requirements of the industry.
-
In August 2025, Liebherr showcased its remote maintenance system, Liebherr Intelligent Maintenance (LiMain), during a live demonstration at its Rostock site, highlighting advancements in crane maintenance and operational efficiency.
ABB: A trusted leader in the automated container terminal industry One among the company's key businesses, ABB provides leading edge products, software and vast expert services to help improve productivity, safety and emissions at PORTS globally. The firm has a series of technological solutions like automated cranes, terminal operating systems, and AI-driven analytics to make container handling more efficient.
-
In March 2025, ABB's automation systems were utilized at the new Colombo West International Terminal, marking a milestone in port automation.
Automated Container Terminal Companies are:
-
Cargotec Corporation
-
Liebherr
-
ABB
-
Künz Aircraft Equipment
-
CLT
-
IDENTEC SOLUTIONS AG
-
ORBCOMM
-
TMEIC Port Technologies
-
PACECO CORP.
-
TOTAL SOFT BANK LTD.
-
INFORM SOFTWARE
-
Logstar ERP
-
Infyz
-
Tideworks
-
Loginno Logistic Innovation Ltd.
-
World Crane Services FZE
-
Starcom Systems Ltd
-
ZPMC
| Report Attributes | Details |
|---|---|
| Market Size in 2025 | USD 12.15 Billion |
| Market Size by 2035 | USD 20.11 Billion |
| CAGR | CAGR of 5.17% From 2026 to 2035 |
| Base Year | 2025 |
| Forecast Period | 2026-2035 |
| Historical Data | 2022-2024 |
| Report Scope & Coverage | Market Size, Segments Analysis, Competitive Landscape, Regional Analysis, DROC & SWOT Analysis, Forecast Outlook |
| Key Segments | • By Degree of Automation (Semi-Automated Container Terminal and Fully Automated Container Terminal) • By Project Type (Brownfield Projects, and Greenfield Projects) • By Offering (Equipment, Software, and Services) • By Solutions (Hardware, Software and Services) |
| Regional Analysis/Coverage | North America (US, Canada), Europe (Germany, UK, France, Italy, Spain, Russia, Poland, Rest of Europe), Asia Pacific (China, India, Japan, South Korea, Australia, ASEAN Countries, Rest of Asia Pacific), Middle East & Africa (UAE, Saudi Arabia, Qatar, South Africa, Rest of Middle East & Africa), Latin America (Brazil, Argentina, Mexico, Colombia, Rest of Latin America). |
| Company Profiles | Cargotec Corporation, Konecranes, Liebherr, ABB, Künz Aircraft Equipment, CLT, Camco Technologies, IDENTEC SOLUTIONS AG, ORBCOMM, TMEIC Port Technologies, PACECO CORP., TOTAL SOFT BANK LTD., INFORM SOFTWARE, Logstar ERP, Infyz, Tideworks, Loginno Logistic Innovation Ltd., World Crane Services FZE, Starcom Systems Ltd, ZPMC |
Frequently Asked Questions
Asia-Pacific dominated the Automated Container Terminal Market in 2025.
The Semi-Automated Container Terminal segment dominated during the projected period.
Growth is driven by increasing global trade, demand for faster port operations, and adoption of advanced automation technologies.
The market was valued at USD 12.15 Billion in 2025 and is projected to reach USD 20.11 Billion by 2035.
The Automated Container Terminal Market is expected to grow at a CAGR of 5.17% during 2026–2035.
Get in Touch
