Automotive Data Logger Market Report Scope & Overview:
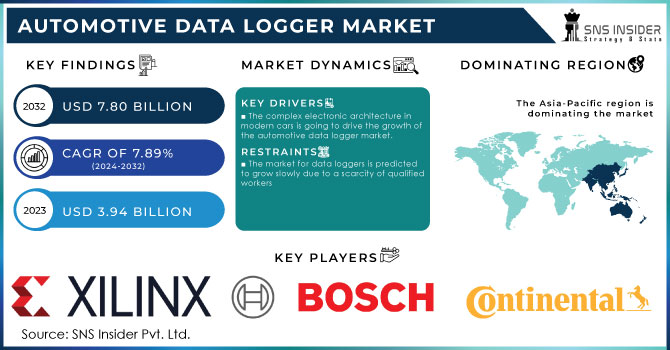
The Automotive Data Logger Market size was valued at USD 3.94 billion in 2023 and is expected to reach USD 7.80 billion by 2032 and grow at a CAGR of 7.89% over the forecast period 2024-2032.
Get More Information on Automotive Data Logger Market - Request Sample Report
Off the major trends, the key trend is the rise in electric vehicles. Electric vehicles are intricate machines that require continuous monitoring of parameters such as battery health, thermal management, and energy efficiency. Data loggers will play a huge role in the optimization of EV performance for range. Other main trends in development include autonomous vehicles, further driving the market. Testing and development for the AVs require collections of extensive data on how sensors perform, vehicle behaviour in different environments, and the interactions with other road users. Data loggers would, therefore, be an imperative capture for such essential information and help in ensuring safe and reliable deployments of self-driving cars.
Growing focus on connected car technologies that have made it possible to transfer data in real-time from vehicles is likely to create new avenues for the integration of data loggers. The data can still be used in proactive maintenance, remote diagnosis, and personalized feedback to drivers to ensure a safe and efficient drive. Hence, the automotive data logger market will continue to grow and evolve in the future.
MARKET DYNAMICS:
KEY DRIVERS:
-
The complex electronic architecture in modern cars is going to drive the growth of the automotive data logger market.
-
Increased use of sensors on the automotive network architecture generates more data.
-
Growth in automotive data logger market through real-time vehicle data analysis
These small gadgets collect a treasure trove of information, from general use features such as how an engine works and how fuel is used to information about driving habits and environmental conditions. All this information gives very detailed blueprints to the engineers so they, in simple terms, can get a sense of how a car works. Performance under different conditions is studied, areas for improvement are pinpointed, and optimal efficiency is ensured.
RESTRAINTS:
-
The market for data loggers is predicted to grow slowly due to a scarcity of qualified workers
-
Automotive data logger markets are price-sensitive, rising data logger costs are a worry
OPPORTUNITIES:
-
Autonomous vehicles track vehicle performance using many different sensor technologies.
-
Manufacturers of data loggers should track the rise in demand for EV data loggers.
-
Policies of the governing authorities are supporting the establishment of charging infrastructure.
Governing entities are implementing various policies to bridge the gap. One strategy involves financial incentives. Subsidies are offered to companies setting up charging stations, reducing upfront costs and encouraging private investment. Additionally, tax breaks on electricity for charging stations make operations more economical. Another approach focuses on simplifying regulations. Governments are streamlining permitting processes and land-use approvals, expediting the construction of charging stations. Furthermore, policies are mandating minimum charging station availability in public spaces and along highways, ensuring a geographically balanced network.
CHALLENGES:
-
The testing and validation of huge amounts of data provided by sensors is the major challenge in ADAS testing
-
By reverse-engineering the CAN bus, hackers can threaten vehicle and passenger safety
Market Segmentation Analysis:
Market, By Channel:
The dominance of Controller Area Network (CAN & CAN FD) stems from its widespread usage in vehicle electronics, while Local Interconnect Network (LIN) serves simpler data requirements within localized car areas. FlexRay provides high-speed data transfer for demanding tasks, albeit with lower adoption rates. Ethernet is increasingly favored, especially with the surge of advanced driver-assistance systems, although market share figures may fluctuate across different research sources. This segmentation addresses the varied data transmission requirements within the constantly evolving automotive sector.
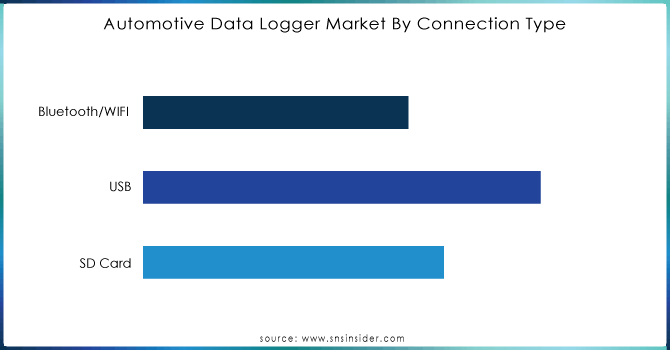
Market, By Connection Type:
In the automotive data logger market, familiar connection types dominate. USB loggers lead with approximately 40% market share, prized for their compactness, universal vehicle compatibility, and support for various sensors and software. Following closely are SD cards, holding about 30% share, providing removable storage capability. Wireless alternatives such as Bluetooth and Wi-Fi, collectively making up 30% share, are gaining popularity due to their convenience and real-time data transmission capabilities. This sector is anticipated to experience substantial expansion driven by growing demand for remote monitoring and analysis.
Market, By Application:
Get Customized Report as per your Business Requirement - Request For Customized Report
The Automotive Data Logger market can be segmented based on application, with pre-sales and post-sales activities representing significant shares. Pre-sales activities, which involve research and development for new vehicles, particularly autonomous cars, are estimated to hold approximately 40% of the market. During this phase, data loggers are instrumental in capturing essential performance metrics during testing. Conversely, post-sales activities, focused on diagnostics and maintenance, contribute roughly 30% of the market share. In this segment, loggers assist in identifying issues and optimizing vehicle health post-purchase. Both segments are crucial for ensuring automotive safety, efficiency, and overall performance.
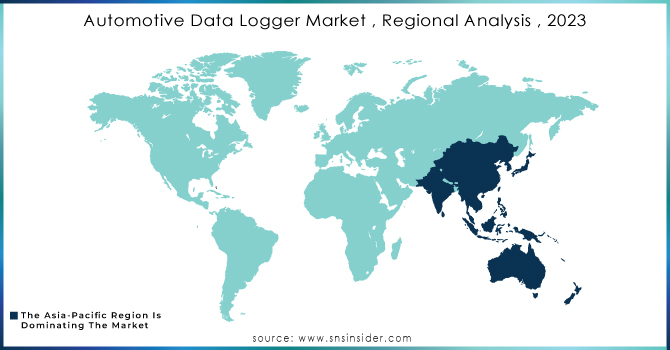
REGIONAL ANALYSIS:
It is projected that Asia-Pacific would maintain its dominance over the research period and account for the biggest proportion of the global market; developing and developed countries such as China, India, Japan, South Korea, and Australia are the leading contributors in the global automotive markets. New doors of opportunity have been opened for car manufacturers in emerging countries thanks to the growth of the industrial sector and the improvement of infrastructure in those countries. As a consequence of this, it is anticipated that the Asia-Pacific area would be the market with the highest rate of growth for automotive data logger systems within the region. It is projected that Europe would hold a significant market share in the global market for vehicle data loggers. The market for automotive data loggers is interested in the use of electric architecture in modern vehicles because it promises to achieve the highest possible level of productivity.
KEY PLAYERS:
Robert Bosch GmbH (Germany), Continental Automotive GmbH (Germany), Delphi Technologies (the U.K.), Vector Informatik GmbH (Germany), Harman International (the U.S.), Xilinx (the U.S.), Intrepid Control Systems, Inc. (the U.S.), Dewesoft d.o.o. (Slovenia), HEM Data Corporation (the U.S.), Influx Technology (the U.K.), Danlaw Technologies India Limited (India), MEN Micro Inc. (the U.S.), MadgeTech, Inc (the U.S.), NSM Solutions (India), myCarma (Canada), and Transtron Inc. (Japan) are some of the affluent competitors with significant market share in the Automotive Data Logger Market.
RECENT DEVELOPMENTS:
-
Continental AG unveiled its latest innovation, the Data Acquisition Unit (DAU). Engineered as a cutting-edge data logger, the DAU boasts high-performance capabilities tailored for the comprehensive capture and retention of diverse vehicle data. Primarily intended for ADAS (Advanced Driver-Assistance Systems) development and testing, this device sets a new standard in data acquisition technology.
-
Vector Informatik GmbH unveiled a strategic alliance with HERE Technologies, a prominent player in location data services. This collaboration aims to seamlessly incorporate HERE's location data into Vector's data loggers. By doing so, it promises to offer profound insights into vehicle dynamics and performance within distinct geographical contexts.
-
Robert Bosch GmbH remains at the forefront of vehicle electronics, with a strong emphasis on research and development. Although there have been no recent explicit announcements concerning data loggers, the company's commitment to innovation suggests promising prospects for the advancement of sophisticated data logging solutions in the future.
| Report Attributes | Details |
|---|---|
| Market Size in 2023 | US$ 3.94 Billion |
| Market Size by 2032 | US$ 7.80 Billion |
| CAGR | CAGR of 7.89% From 2024 to 2032 |
| Base Year | 2023 |
| Forecast Period | 2024-2032 |
| Historical Data | 2020-2022 |
| Report Scope & Coverage | Market Size, Segments Analysis, Competitive Landscape, Regional Analysis, DROC & SWOT Analysis, Forecast Outlook |
| Key Segments | • by Channel (Controller Area Networking (CAN & CAN FD), Local Interconnect Network (LIN), Flex Ray Ethernet) • by Connection Type (SD Card, USB, Bluetooth/WIFI) • by Application (Pre-sales, Post-sales) |
| Regional Analysis/Coverage | North America (US, Canada, Mexico), Europe (Eastern Europe [Poland, Romania, Hungary, Turkey, Rest of Eastern Europe] Western Europe] Germany, France, UK, Italy, Spain, Netherlands, Switzerland, Austria, Rest of Western Europe]), Asia Pacific (China, India, Japan, South Korea, Vietnam, Singapore, Australia, Rest of Asia Pacific), Middle East & Africa (Middle East [UAE, Egypt, Saudi Arabia, Qatar, Rest of Middle East], Africa [Nigeria, South Africa, Rest of Africa], Latin America (Brazil, Argentina, Colombia, Rest of Latin America) |
| Company Profiles | Robert Bosch GmbH (Germany), Continental Automotive GmbH (Germany), Delphi Technologies (the U.K.), Vector Informatik GmbH (Germany), Harman International (the U.S.), Xilinx (the U.S.), Intrepid Control Systems, Inc. (the U.S.), Dewesoft d.o.o. (Slovenia), HEM Data Corporation (the U.S.), Influx Technology (the U.K.), Danlaw Technologies India Limited (India), MEN Micro Inc. (the U.S.), MadgeTech, Inc (the U.S.), NSM Solutions (India), myCarma (Canada), and Transtron Inc. (Japan) |
| Key Drivers | •Modern automobiles' complicated electronic architecture will boost the automotive data logger industry. •With the increased usage of sensors in the automotive networking architecture, more data is being created. |
| RESTRAINTS | •The market for data loggers is predicted to grow slowly due to a scarcity of qualified workers. •Automotive data logger markets are price-sensitive, rising data logger costs are a worry. |
Get in Touch
