Automotive Infotainment Systems Market Size & Overview:
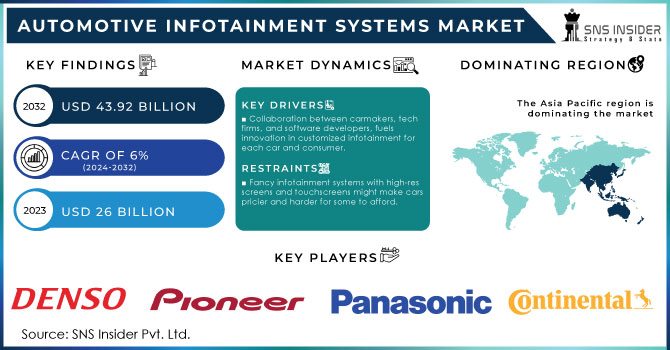
The Automotive Infotainment Systems Market size was valued at USD 26 billion in 2023 and is expected to reach USD 43.92 billion by 2032 and grow at a CAGR of 6% over the forecast period 2024-2032.
Get More Information on Automotive Infotainment Systems Market - Request Sample Report
The demand for luxurious and feature-rich cars is driving the improvement of advanced infotainment systems. Tech-driven infotainment companies are creating features like parking recommendations, smart navigation, pre-trip planning, and cloud-based syncing. The smartphones can be connected to the car's infotainment systems through Wifi, hotspot or Bluetooth permitting users to get to phone features through the car's interface. This incorporates managing incoming, outgoing, and conference calls as well as viewing contact lists, call logs, and messages. The expanding integration of smartphones with car infotainment systems is increasing the demand for high-end car models arranged with touchscreens and superior infotainment features. To improve user experience, the generation of high-resolution touchscreens is quickly developing, essentially driving market development. These touchscreens are regularly made from LCD or TFT materials which give remarkable display clarity for advanced graphics.
MARKET DYNAMICS:
KEY DRIVERS:
-
Rising consumer demand for seamless digital device connectivity in cars fuels the adoption of infotainment systems with features like smartphone integration, Bluetooth, and Wi-Fi hotspots.
-
Collaboration between carmakers, tech firms, and software developers, fuels innovation in customized infotainment for each car and consumer.
The future of in-car entertainment is built on teamwork. To keep pace with buyer desires and technological advancements, automakers are joining forces with tech companies and software developers. This collaboration fosters advancement, permitting for the creation of customized infotainment systems. These systems aren't one-size-fits-all. Instep, they can be custom fitted to particular vehicle models, guaranteeing seamless integration of features consistently coordinated with the car's design and performance.
RESTRAINTS:
-
Fancy infotainment systems with high-res screens and touchscreens might make cars pricier and harder for some to afford.
The advanced infotainment systems enhance the driving experience as they are high-priced. High-resolution displays, touchscreens, and integrated features can significantly increase car production costs and complexity. This can potentially impact affordability for consumers, especially those seeking more basic or budget-friendly vehicles. The additional features may also make the system more complex to use, potentially creating a barrier for those less comfortable with technology.
-
Infotainment systems with connectivity features raise data security worries due to sensitive information being shared, requiring strong cybersecurity.
OPPORTUNITIES:
-
Integration of artificial intelligence for personalized infotainment experiences can attract tech-savvy consumers.
-
Expansion into self-driving cars can create a massive market for in-car entertainment during extended travel times.
CHALLENGES:
-
Touchscreens can divert attention from the road, increasing accident risks.
-
Complex systems may require specialized maintenance, adding to ownership expenses.
IMPACT OF RUSSIA-UKRAINE WAR
The war in Russia-Ukraine is disrupting the growth of the Automotive Infotainment Systems Market. The war has decreased the supply of neon gas and palladium, vital for chip production in infotainment systems. This obstruction could slow production and lead to shortages, potentially delaying the market growth by 20-30%. The war has driven up energy and raw material prices worldwide. This translates to pricier infotainment system components, forcing carmakers to potentially cut features or raise car prices, impacting affordability and potentially slowing market growth by 10-15%. With economic uncertainty, consumers might prioritize essentials over in-car luxuries like advanced infotainment systems, potentially shifting demand towards simpler cars and affecting market growth. Thus, the war has disrupted production of wiring harnesses, key infotainment system components, in Ukraine and Russia. This could lead to car assembly delays and potentially decreasing the market growth by 5-10%.
IMPACT OF ECONOMIC SLOWDOWN
Economic slowdowns can slowdown the Automotive Infotainment Systems Market. Limited budgets lead consumers to delay car purchases, especially high-end models with advanced infotainment systems. This could stall market growth by 15-20%. Economic anxieties make carmakers cautious about investing in advanced infotainment features. This could delay the rollout of new technologies, potentially impacting market growth by 10-15%. To keep cars affordable, manufacturers might offer tiered infotainment systems with fewer features which could decrease the average functionality of infotainment systems sold, potentially slowing growth by 5-10%. Consumers worried about finances might be less receptive to paying monthly fees for advanced infotainment features, leading to a decline in revenue for subscription-based services. As an alternative to buying new cars, consumers seeking infotainment upgrades might turn to the aftermarket for more affordable options. This could shift some market focus and potentially disrupt growth by 5-7%.
KEY MARKET SEGMENTS:
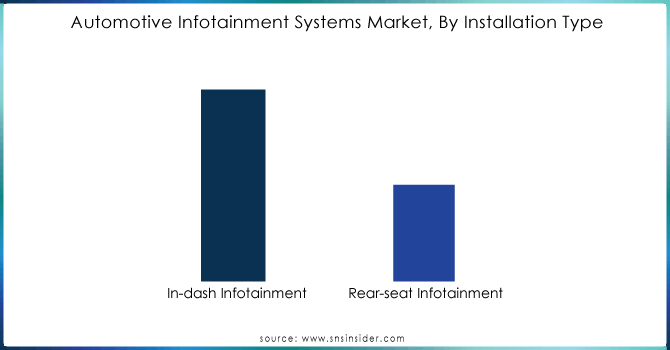
By Installation Type
-
In-dash Infotainment
-
Rear-seat Infotainment
In-dash Infotainment is the dominating sub-segment in the Automotive Infotainment Systems Market by installation holding around 75-85% of market share. In-dash infotainment systems are the traditional and most common type. They are centrally located on the dashboard, providing easy access and visibility for the driver and front passenger. Thus, in-dash systems typically offers a larger display and more features compared to rear-seat entertainment options.
Get Customized Report as per your Business Requirement - Request For Customized Report
By Vehicle Type
-
Passenger Cars
-
Commercial Vehicles
The Passenger Cars is the dominating sub-segment in the Automotive Infotainment Systems Market by vehicle type holding around 70-80% of market share. Passenger cars account the majority of vehicles sold globally. They are primarily used for personal transportation, where entertainment and information features are more valued compared to commercial vehicles. Passenger cars also tend to have a higher price point, allowing manufacturers to include more advanced infotainment systems as standard equipment or optional features.
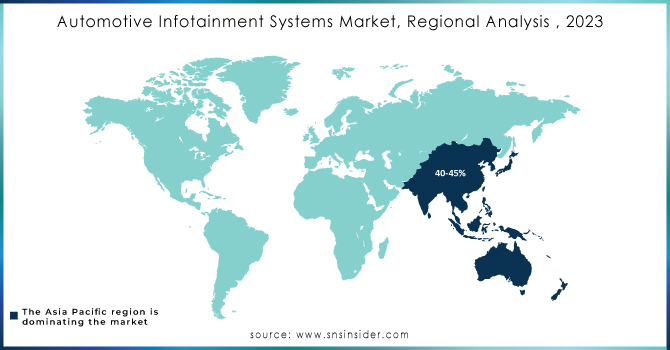
REGIONAL ANALYSES
The Asia Pacific is the dominating region in the Automotive Infotainment Systems Market with 40-45% of share driven by the growing car market fueled by rising incomes, urbanization, and a growing middle class. Government initiatives promoting electric vehicles, often equipped with an advanced infotainment, further accelerate the growth.
North America is the second highest region in this market holding 30-35% of share with its well-established automotive industry and consumer preference for feature-rich vehicles. Strong connectivity infrastructure for Bluetooth and Wi-Fi, fosters the adoption of advanced infotainment systems in this region.
Europe is the fastest growing region with 20-25% of share. The rising consumer awareness for these features, increasing demand for premium vehicles, and government regulations promoting safety features integrated with infotainment systems are driving rapid growth.
REGIONAL COVERAGE:
North America
-
US
-
Canada
-
Mexico
Europe
-
Eastern Europe
-
Poland
-
Romania
-
Hungary
-
Turkey
-
Rest of Eastern Europe
-
-
Western Europe
-
Germany
-
France
-
UK
-
Italy
-
Spain
-
Netherlands
-
Switzerland
-
Austria
-
Rest of Western Europe
-
Asia Pacific
-
China
-
India
-
Japan
-
South Korea
-
Vietnam
-
Singapore
-
Australia
-
Rest of Asia Pacific
Middle East & Africa
-
Middle East
-
UAE
-
Egypt
-
Saudi Arabia
-
Qatar
-
Rest of the Middle East
-
-
Africa
-
Nigeria
-
South Africa
-
Rest of Africa
-
Latin America
-
Brazil
-
Argentina
-
Colombia
-
Rest of Latin America
KEY PLAYERS
The major key players are Continental AG (Germany), Harman International (US), Panasonic Corporation (Japan), Pioneer Electronics (US), Aisin Corporation, DENSO Corporation (Japan), Pioneer Corporation, KENWOOD Corporation (Japan), Garmin Ltd. (Switzerland), Alpine Electronics, Inc. (Japan), ALLGo Embedded Systems Pvt. Ltd. (India), Delphi Automotive PLC (UK) and other key players.
RECENT DEVELOPMENT
-
In August 2022: Maruti upgrades in-car entertainment with the Baleno's Smart Play Pro+. This new system boasts a 9-inch touchscreen, navigation features, and CarPlay, building on user feedback to improve upon the previous Smart Play Pro.
-
In March 2022: Acura has launched the much-anticipated Type S variant of its popular MDX SUV. Designed with current consumer preferences in mind, the MDX Type S boasts a cutting-edge touchpad infotainment system paired with a stunning OLED display.
-
In February 2022: Harman International, a car tech company, acquired Apostera, an AR/MR software firm. This move strengthens Harman's automotive product line by incorporating AR/MR for features like head-up displays and advanced infotainment systems.
| Report Attributes | Details |
|---|---|
| Market Size in 2023 | US$ 26 Billion |
| Market Size by 2032 | US$ 43.92 Billion |
| CAGR | CAGR of 6% From 2024 to 2032 |
| Base Year | 2023 |
| Forecast Period | 2024-2032 |
| Historical Data | 2020-2023 |
| Report Scope & Coverage | Market Size, Segments Analysis, Competitive Landscape, Regional Analysis, DROC & SWOT Analysis, Forecast Outlook |
| Key Segments | • By Installation Type (In-dash Infotainment, Rear-seat Infotainment) • By Vehicle Type (Passenger Cars, Commercial Vehicles) |
| Regional Analysis/Coverage | North America (US, Canada, Mexico), Europe (Eastern Europe [Poland, Romania, Hungary, Turkey, Rest of Eastern Europe] Western Europe] Germany, France, UK, Italy, Spain, Netherlands, Switzerland, Austria, Rest of Western Europe]), Asia Pacific (China, India, Japan, South Korea, Vietnam, Singapore, Australia, Rest of Asia Pacific), Middle East & Africa (Middle East [UAE, Egypt, Saudi Arabia, Qatar, Rest of Middle East], Africa [Nigeria, South Africa, Rest of Africa], Latin America (Brazil, Argentina, Colombia, Rest of Latin America) |
| Company Profiles | Continental AG (Germany), Harman International (US), Panasonic Corporation (Japan), Pioneer Electronics (US), Aisin Corporation, DENSO Corporation (Japan), Pioneer Corporation, KENWOOD Corporation (Japan), Garmin Ltd. (Switzerland), Alpine Electronics, Inc. (Japan), ALLGo Embedded Systems Pvt. Ltd. (India) and Delphi Automotive PLC (UK) |
| Key Drivers | • Growing worldwide automobile production and sales. • Automobile adoption of ADAS features. |
| RESTRAINTS | •Issues in comprehending bilinguals and recognizing orders whenever drivers try to do a hands-free action. •Limited integration of voice assistants with electronics. |
Frequently Asked Questions
Ans:- North American region is anticipated to be the primary driver of the market.
Ans:- Yes.
Ans:- Technology improvements, such as the increasing use of connected vehicles and internet-linked vehicle integration, are expected to enhance the market in the near future.
Ans: By Vehicle Type and By Installation Type are the segments listed in the final report.
Ans: The Automotive Infotainment Systems Market was valued at USD 26 billion in 2023.
Get in Touch
