Betavoltaic Device Market Size & Growth:
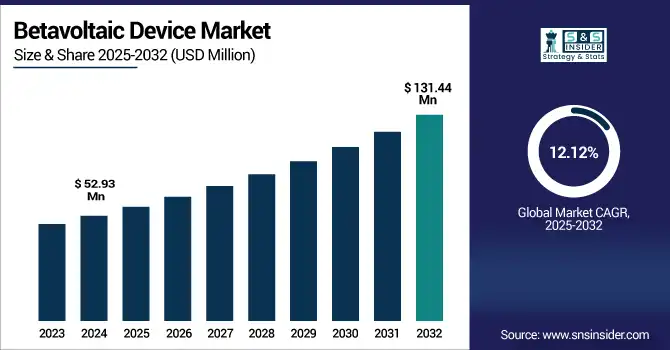
The Betavoltaic Device Market Size was valued at USD 52.93 million in 2024 and is expected to reach USD 131.44 million by 2032 and grow at a CAGR of 12.12% over the forecast period 2025-2032. The global market for betavoltaic devices is experiencing increased demand because of ultra-low power energy sources in key uses, spurring growth. Consistent long-term power is important within remote sensors, aerospace systems, also implantable medical technologies, so these devices are particularly valued. Industries seek for ways to reduce maintenance and to extend device lifespans. Betavoltaic solutions do then offer up a unique advantage for continuously delivering of energy over some decades. The ongoing trend toward electronic miniaturization and advancements in micro-power systems is further accelerating the adoption of this technology across both defense and commercial sectors worldwide.
To Get more information on Betavoltaic Device Market - Request Free Sample Report
The U.S. Betavoltaic Device Market size was USD 11.97 million in 2024 and is expected to reach USD 25.82 million by 2032, growing at a CAGR of 10.16% over the forecast period of 2025–2032.
The US betavoltaic device market growth is primarily driven by increasing defense investments, the demand for ultra-long-life power sources in aerospace and medical implants, and the rising focus on advanced micro-power systems. Additionally, strong R&D backing from national labs and partnerships with private tech firms is accelerating product innovation and commercialization in the U.S. market.
According to research, the U.S. military is running more than 12 active programs exploring long-duration power sources like betavoltaic devices for sensors, drones, and remote surveillance.
Betavoltaic Device Market Dynamics
Key Drivers:
-
Rapid advancements in nanotechnology and semiconductor materials are enhancing betavoltaic device efficiency and commercial viability.
Technological innovations that are in nano-engineered semiconductors with advanced encapsulation methods convert energy at rates that are improved greatly in betavoltaic devices. Wide-bandgap semiconductors as well as thin-film isotopic coatings enable greater power density. These materials handle radiation more safely too. These developments are enabling of smaller and more efficient devices through a lowering of production costs. Since research institutions and industry players collaborate in terms of scalable production efforts, the technological maturity of betavoltaics is transitioning from lab-stage innovations and toward commercial solutions, accelerating adoption across energy-critical verticals.
According to research, more than 10 national defense agencies have initiated evaluation programs for betavoltaic-powered sensors and micro-drones.
Restrain:
-
Stringent regulations and handling restrictions surrounding radioisotopes limit the commercial flexibility of betavoltaic technologies.
Radioisotopes can be used within betavoltaic devices. Most countries impose strict regulations for radioisotope handling, transportation, and disposal. The licenses are acquired, the radiation safety compliance is ensured, and secure supply chains are maintained that do increase operational complexity and cost. Mainstream electronics manufacturers are also discouraged from investing by regulatory hurdles because of unfamiliarity with nuclear-grade safety protocols. These constraints restrict innovation plus expansion particularly in consumer electronics and decentralized applications because managing compliance is harder than government programs or defense-backed ones.
According to research, More than 50% of regulatory filings for radioisotope-powered devices are delayed due to overlapping jurisdictional approvals at national and sub-national levels.
Opportunities:
-
Global shift toward space exploration and deep-space missions drives the need for ultra-reliable energy sources like betavoltaic devices.
As agencies like NASA, ESA, ISRO, and private firms such as SpaceX ramp up deep-space and lunar missions, the demand for long-duration energy systems has surged. Betavoltaic devices are ideal for powering sensors, landers, and communication modules where solar energy is unavailable or unreliable. Their ability to endure extreme radiation and operate without maintenance makes them vital for extended missions. With increased government funding and public-private collaboration in aerospace, betavoltaic power solutions are becoming a cornerstone in future space infrastructure planning.
According to research, betavoltaic batteries can provide continuous micro-watt to milli-watt power for up to 20–30 years, far exceeding conventional space battery lifecycles.
Challenges:
-
Supply chain dependency on specific radioisotopes and lack of diversified sourcing pose serious production and geopolitical risks.
Betavoltaic devices depend on isotopes like Tritium or Nickel-63, which are produced in limited quantities by a few government-regulated facilities worldwide. Disruptions in production, political instability, or changes in export policies can severely impact availability. The lack of alternative isotopes or diversified suppliers creates bottlenecks and makes long-term planning risky for manufacturers. Establishing more isotope production centers and international partnerships is crucial to mitigate this challenge and ensure a steady supply for commercial scaling.
According to research, Efforts to develop alternative isotopes are currently underfunded, receiving only 6–8% of total radioisotope research budgets globally.
Betavoltaic Device Market Segment Analysis:
By Device Type
Standard Betavoltaic Devices dominated the highest betavoltaic device market share of 62.12% in 2024 due to their proven reliability, ease of integration, and broad application across military, aerospace, and industrial sectors. These devices are well-established in terms of safety and performance, offering a balance between energy output and lifespan. City Labs Inc., a recognized name in this segment, continues to deliver radiation-powered batteries used in aerospace and defense missions. Their compatibility with legacy systems and regulatory approvals in major economies further support their dominance in global applications.
Miniaturized Betavoltaic Devices are projected to grow at the fastest CAGR of 13.45% from 2025 to 2032, driven by demand in compact electronics, medical implants, and wireless sensors. Their ultra-small footprint, coupled with long operational life, makes them ideal for IoT and biomedical applications. Qynergy Corp., a key innovator in micro-power systems, is actively developing miniaturized betavoltaic solutions for advanced sensor applications. With the rise of wearable tech and remote monitoring systems, miniaturized betavoltaics are expected to play a pivotal role in next-generation power solutions.
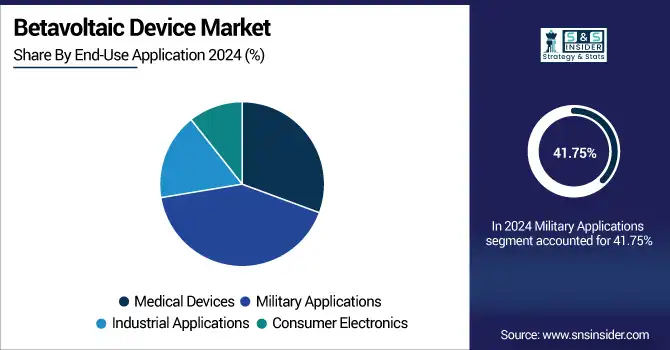
By End-Use Application
Military Applications dominated the largest share at 41.75% revenue share in 2024 due to high demand for rugged, long-life power systems in critical missions. Betavoltaic devices support continuous operations in GPS trackers, remote sensors, and unmanned platforms without requiring battery replacement. Widetronix, with its focus on low-power nuclear batteries, is actively supplying prototypes and components for military-grade applications. Their high reliability in extreme conditions makes them indispensable in defense technology across global armed forces.
Medical Devices are forecasted to grow at a CAGR of 13.37% from 2025 to 2032 due to the rising adoption of long-term implants and diagnostic tools. Betavoltaics eliminate the need for frequent surgical replacements, thus reducing risk and cost. BetaBatt Inc. is engaged in advancing betavoltaic power sources for implantable medical devices, offering a long-term energy solution for critical care equipment. With chronic illnesses on the rise, such innovations are transforming power reliability in healthcare.
By Component
Radioisotopes dominated the betavoltaic device market with a 44.81% share in 2024, owing to their crucial role as the energy source in betavoltaic systems. The selection and stability of isotopes like Tritium and Nickel-63 are key to device longevity and safety. SHINE Technologies is involved in supplying medical and industrial isotopes that serve as core materials for betavoltaic devices. Their contribution to isotope availability and innovation supports the sustained dominance of this component category.
Semiconductors are expected to grow at a CAGR of 13.08% from 2025 to 2032, as improvements in materials like GaN and SiC boost conversion efficiency. Miniaturization and enhanced radiation tolerance are increasing semiconductor relevance in next-gen devices. Betavoltaic devices companies such as ON Semiconductor are contributing to the design of efficient semiconducting platforms used in betavoltaic energy conversion. As demand grows for smaller and more efficient devices, semiconductors remain central to innovation and performance enhancement.
By Power Output
Medium Power Output (100 mW to 1 W) devices captured the largest share of 42.18% in 2024 due to their versatility across military, industrial, and medical applications. They offer a balanced mix of energy capacity and size, making them suitable for both mobile and fixed installations. PhosEnergy, known for its work in radiation-based energy solutions, has been exploring medium-output betavoltaics for industrial sensor networks. The reliability and long-life operation of these devices support their sustained market leadership.
High Power Output (above 1 W) devices are projected to grow at a CAGR of 13.13% from 2025 to 2032, supported by expanding demand in space missions and high-power industrial sensors. These applications require robust, long-duration energy sources with no tolerance for battery failure. Kronos Fusion Energy, although primarily in fusion, is investing in high-output isotopic energy systems relevant to high-capacity betavoltaics. As deep-space and remote industrial deployments increase, this segment is expected to gain significant traction globally.
By Functionality
Long Lifespan Devices dominated the largest share at 49.15% in 2024 as the market favors solutions that reduce maintenance and operational interruptions. These devices, with lifespans exceeding 20 years, are preferred in applications where access is limited or hazardous. Alpha-Source Inc. has developed a series of long-life radioisotope batteries targeting aerospace and medical sectors. Their ability to deliver consistent power for decades makes them essential for mission-critical, maintenance-free energy needs in extreme environments.
Self-Powered Systems are expected to grow at a CAGR of 13.23% from 2025 to 2032, driven by the rise of autonomous and intelligent devices. These systems integrate betavoltaic energy units with sensing or communication modules, eliminating dependence on external power. MicroPower Global is developing self-sustaining power solutions leveraging nuclear and thermoelectric integration, aimed at remote monitoring systems. With smart technology adoption expanding, these systems are set to transform off-grid, maintenance-free energy deployment.
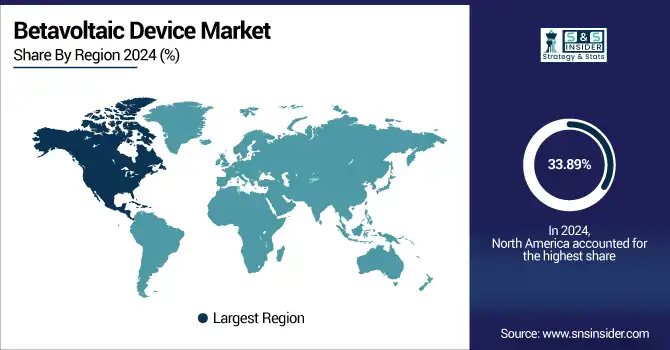
Betavoltaic Device Market Regional Outlook:
North America led the global market with a 33.89% share in 2024 due to its strong defense spending, advanced medical technology landscape, and space exploration initiatives. Presence of key industry players, research institutions, and supportive regulatory frameworks further bolster market maturity. Investments in homeland security and federal R&D projects have accelerated commercialization of betavoltaic innovations. This regional dominance is reinforced by strategic funding in nuclear-powered microtechnologies and growing demand across defense and medical sectors.
-
The U.S. dominates the North American betavoltaic device market due to high defense spending, advanced medical research, strong federal R&D funding, and early adoption of nuclear micro-power technologies for critical applications across aerospace, military, and implantable medical devices.
Asia Pacific is expected to grow at the fastest CAGR of 13.28% from 2025 to 2032, fueled by expanding semiconductor manufacturing, increasing defense budgets, and growing demand for advanced medical devices. Countries like China, Japan, and South Korea are heavily investing in space and autonomous systems, creating a favorable ecosystem for betavoltaic adoption. Supportive government policies, rising healthcare infrastructure, and rapid industrialization are positioning Asia Pacific as a key future market for long-lasting power solutions.
-
China leads the Asia Pacific market owing to its strong nuclear technology infrastructure, expanding semiconductor manufacturing, state-backed research programs, and strategic investments in space and defense sectors that demand long-life, maintenance-free energy sources like betavoltaic devices.
Europe's betavoltaic device market is steadily growing, driven by stringent energy efficiency standards, increasing investments in deep-tech innovation, and a rising focus on sustainable, long-duration power sources. Countries like Germany, France, and the UK are supporting research into radiation-based micro-generators for defense, industrial monitoring, and medical applications. Collaborations between academic institutions and energy startups are further strengthening regional development efforts.
-
Germany dominates the European betavoltaic device market due to its advanced nuclear research infrastructure, strong semiconductor industry, and high defense and medical technology investments. Government support for energy innovation and active academic-industry collaborations further strengthen its leadership in this emerging sector.
The United Arab Emirates leads the Middle East & Africa betavoltaic device market due to strategic investments in nuclear energy, advanced healthcare, and space initiatives. Similarly, Brazil dominates Latin America through strong public support for nuclear research, a growing aerospace sector, and increasing demand for remote and defense power solutions.
Get Customized Report as per Your Business Requirement - Enquiry Now
Betavoltaic Device Companies are:
Major Key Players in Betavoltaic Device Market are City Labs, Inc., BetaBatt, Inc., Direct Kinetic Solutions, Widetronix, Inc., Qynergy Corporation, NDB, Inc., NUST MISIS, Northrop Grumman Corporation, General Electric Company, Honeywell International Inc and others.
| Report Attributes | Details |
|---|---|
| Market Size in 2024 | USD 52.59 Million |
| Market Size by 2032 | USD 131.44 Million |
| CAGR | CAGR of 12.12% From 2025 to 2032 |
| Base Year | 2024 |
| Forecast Period | 2025-2032 |
| Historical Data | 2021-2023 |
| Report Scope & Coverage | Market Size, Segments Analysis, Competitive Landscape, Regional Analysis, DROC & SWOT Analysis, Forecast Outlook |
| Key Segments | • By Device Type (Miniaturized Betavoltaic Devices, Micro Betavoltaic Devices, Standard Betavoltaic Devices) • By End-Use Application (Medical Devices, Military Applications, Industrial Applications, Consumer Electronics) • By Component (Radioisotopes, Semiconductors, Battery Housing) • By Power Output (Low Power Output (up to 100 mW), Medium Power Output (100 mW to 1 W)), High Power Output (above 1 W)) • By Functionality (Energy Harvesting, Self-Powered Systems, Long Lifespan Devices) |
| Regional Analysis/Coverage | North America (US, Canada, Mexico), Europe (Germany, France, UK, Italy, Spain, Poland, Turkey, Rest of Europe), Asia Pacific (China, India, Japan, South Korea, Singapore, Australia,Taiwan, Rest of Asia Pacific), Middle East & Africa (UAE, Saudi Arabia, Qatar, South Africa, Rest of Middle East & Africa), Latin America (Brazil, Argentina, Rest of Latin America) |
| Company Profiles | City Labs, Inc., BetaBatt, Inc., Direct Kinetic Solutions, Widetronix, Inc., Qynergy Corporation, NDB, Inc., NUST MISIS, Northrop Grumman Corporation, General Electric Company, Honeywell International Inc. |
Frequently Asked Questions
Ans: North America dominated the Betavoltaic Device Market in 2024.
Ans: Standard Betavoltaic Devices segment dominated the Betavoltaic Device Market.
Ans: The major growth factor of the Betavoltaic Device Market is the increasing demand for ultra-long-life, maintenance-free power sources in medical implants, defense, and remote IoT systems.
Ans: The Betavoltaic Device Market size was USD 52.93 million in 2024 and is expected to reach USD 131.44 million by 2032.
Ans: The Betavoltaic Device Market is expected to grow at a CAGR of 12.12% from 2025-2032.
Get in Touch
