Industrial Sensors Market Size:

Get more information on Industrial Sensors Market - Request Sample Report
The Industrial Sensors Market size was valued at USD 25.12 billion in 2023 and is expected to reach USD 54.24 billion by 2032 and grow at a CAGR of 8.93% over the forecast period 2024-2032.
The industrial sensors market has witnessed prominent growth and development facilitated by progress in technology and the increasing adoption of automation. As industries become more and more supportive of digital transformation, the need for industrial sensors, which play a critical role in monitoring and optimizing activity, is rapidly increasing. The rapid adoption of Industry 4.0 with its reliance on the use of sensors for smart production processes, predictive maintenance, and other applications. In 2020, the Trump administration has recently called for more than USD 1 billion in U.S. funding to be invested into the creation of 12 newly established research and development facilities for the development of Industry 4.0. The funding is allegedly provided by the White House, the National Science Foundation, and the Department of Energy over five years, with the twelve new hubs set to act as AI and QIS R&D institutes.
Industrial sensors are highly used in the automotive Industry and they serve as a key component in today’s car safety systems and autonomous vehicle driving facilities. The United States was the world’s second country by car production in 2022, with 10 million cars produced, which was 5% more than in 2021. However, China had 30 million vehicles produced, and it still led the global statistics. The purchase of cars and related industries made up around 5% of the US economy. The number of vehicles registered was over 290.8 million, and 13.75 million new automobiles were bought in 2022. The Industrial Sensors Market is still developing, offering great chances for progress and expansion, and tackling challenges with new technology and strategic investments.
Industrial Sensors Market Dynamics:
Drivers
-
Demand for smart sensor-enabled wearable devices is increasing.
The increasing need for wearable devices with smart sensors is greatly boosting the Industrial Sensors Market. The fast progress in technology and growing consumer desire for health and fitness monitoring are the main drivers of this trend. Smart sensors, found in wearable gadgets like fitness trackers and smartwatches, provide advanced features for collecting and analyzing real-time data. These sensors can assess a range of bodily functions such as heart rate, body temperature, and activity levels, giving individuals valuable information about their overall health and fitness. The use of these intelligent sensors in wearables has grown from just personal fitness to also include medical tracking, where they are vital in handling chronic diseases and enhancing patient treatment. The increase in health consciousness and the rising popularity of individualized health management options are driving the need for these technologies even more. Furthermore, progress in sensor technology has resulted in increased accuracy, affordability, and energy efficiency of these devices, expanding their availability to a wider range of consumers.
-
Automobile manufacturers are increasing their demand for smart sensors to provide improved safety and comfort.
As more and more automobiles are becoming automated, more products that are used in them are also becoming automated. Today, an entire range of smart sensors is widely utilized within both driver and passenger scopes. The first and largest group of applications includes smart sensors used to ensure safety as they help to run advanced driver-assistance systems. Such systems as adaptive cruise control, lane-keeping assistance, automatic emergency braking, and collision avoidance, use the data provided by proximity sensors. Finally, let us not overlook the growing popularity of such technologies as night-vision and fatigue-recognition systems. Overall, these sensors help reduce accidents and make driving safer as they inform drivers about the on-road situation, with automatic emergency braking and collision avoidance systems preventing or lowering the impact of any potential crash. The second group of smart sensors applies to higher levels of comfort as they trigger such functions as automatic climate control, adjustable seating positions, and even infotainment system personalization.
Restraints
-
Precise performance demands from next-generation advanced/technological sensors.
The advancements in technology utilized in various industries have heavily increased the precision, performance, and functionality these sensors are expected to deliver. It means that sensors are needed to perform in high-temperature environments, high pressures, or be resistant to corrosion, all while providing exceptional precision and stability. The demand for integrating advanced sensors meant that many of these requirements could only be achieved by using advanced materials and technology. It, in turn, increases the cost of production. The slow growth of many applications in the market further increases the overall cost since these next-generation sensors must have advanced features such as real-time processing of obtained data, high-resolution measurements, and connectivity. The latter requires a substantial level of technical knowledge to implement, and the long development cycle increases manufacturing costs. What is more, their implementation into design also grows more complex, further increasing the cost of design and development.
Industrial Sensors Market Segment Overview:
by Sensor Type
The level sensors held a market share of around 35% in 2023 and dominated the industrial sensors market. Level sensors comprise a significant part of industrial sensors as they can provide the measurement of liquid and solid levels stored in tanks and containers by offering the opportunity to perform more reliable and accurate results. Therefore, these types of sensors are closely related to numerous other industrial applications as they serve as a guarantee of the growth of the market by being involved in the stability of the following industries: oil and gas, chemical processing, food and beverage, pharmaceuticals, and water treatment.
The gas sensors are to grow at a faster rate during the forecast period 2024-2032. Gas sensors are included in the list of the industrial sensors market and they perform one of the most important functions in monitoring and ensuring safety in industrial applications. The main purpose of the sensors is the measurement of gas concentration in the given environment to be confident that the levels of gases in this application are appropriate and regulated.
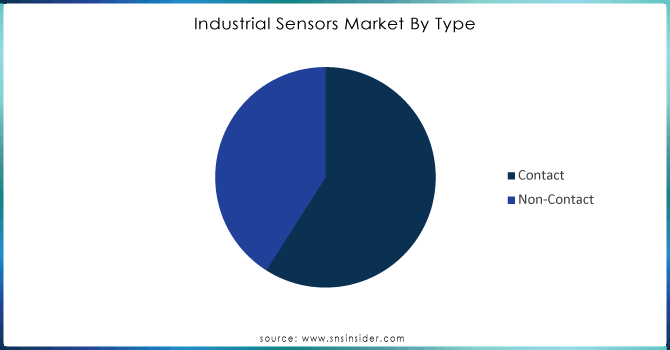
By Type
The contact sensors led the market in 2023, with a market share of over 58%. Such sensors must be in direct contact with the measured product, and as a rule, they allow obtaining an accurate measurement. They are used where accurate data is required and there is no possibility to use remote control. Limit switches, potentiometers, and tactile sensors belong to the type of contact sensors. For instance, a limit switch is usually included in the production process to determine whether objects are present and whether they are correctly positioned. It is used in conveyor systems, robotic applications, and other manufacturing/assembly lines to control the operation of machinery.
The non-contact sensor is registered to show potential growth during 2024-2032. They are used extensively across various applications and the rising efforts by the industrial sector to move towards automation and increase precision. These sensors are widely used in a range of applications in different industry verticals; namely, automotive, manufacturing, aerospace, and healthcare. In automotive, non-contact sensors are used for monitoring and controlling varied applications. It assists in the detection of the position, speed, and distance of a moving part from the sensors.
Get Customized Report as per your Business Requirement - Request For Customized Report
By End User
The discrete segment dominated the market in 2023 with a market share of over 59%. Discrete industrial sensors are a growing and lively market, integral to multiple industrial applications. Discrete sensors, which include proximity, photoelectric, and capacitive sensors, help to detect and assess physical properties and changes in industrial environments. Discrete sensors can be found in automotive, aerospace & defense, consumer electronics, and other sectors. The main application of discrete industrial sensors is in automatic manufacturing systems. In these systems, sensors are involved in monitoring and regulating the manufacturing process, which guarantees high precision and efficiency.
The process segment is going to retain the fastest-growing CAGR during 2023-2032. The process industrial sensors market is booming as industries are automating as well as making them more efficient. Thus, being integral instruments in industrial automation systems, these sensors avail real-time data and insights that help to control and monitor processes more precisely. As such, different industries such as oil and gas, chemical, pharmaceuticals, food and beverage, and manufacturing make use of the sensors in various applications. For instance, people in the oil and gas industry would use sensors to measure the borehole and mud temperature.
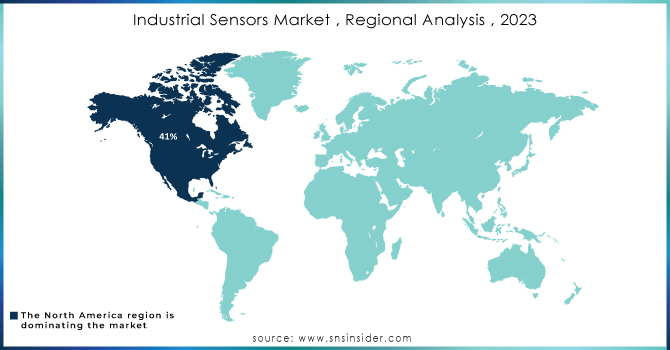
Industrial Sensors Market Regional Analysis:
North America dominated the industrial sensors market in 2023 with a market share of over 40%, due to increasing technological progress and the development of technology. A great part of the growth can be attributed to the growing demand for the optimization, automation, and control of processes across different industries, requiring the use of sensors that monitor the situation on the site. Predictive maintenance, quality control, optimal energy consumption, and establishing favorable working conditions by monitoring temperature, humidity, dustiness, and other conditions are only some of the applications of sensors in manufacturing, energy, transportation, and other industries. Also, with the trend toward Industry 4.0, increasing numbers of companies are learning to make robust decisions based on the data about the situation on the sites and track the operation of machines and equipment in real-time.
The Asia Pacific region is to grow at a faster CAGR during the forecast period 2024-2032, as various economies in the region, such as China, India, and Japan, are making significant investments in smart technologies to improve operational efficiency and productivity. Specifically, the automotive sector greatly benefits from this expansion. Industrial sensors are important for improving vehicle safety, performance, and efficiency by monitoring key factors like engine temperature, tire pressure, and fuel levels. The increasing use of electric vehicles and advanced driver-assistance systems (ADAS) is also driving up the demand for these sensors.
KEY PLAYERS:
The key players in the Industrial sensor market are Honeywell International, Rockwell Automation, Texas Instruments, Panasonic Corporation, TE Connectivity, Amphenol Corporation, Bosch Sensortec, STMicroelectronics, Siemens, Dwyer Instruments & Other Players.
Recent Development
-
In February 2024, Bosch Sensortec launched the BME688 Gas Sensor. This sensor provides enhanced gas detection features, such as VOCs and CO2, to enhance safety and monitor air quality.
-
In May 2024, the MS5803-14BA Pressure Sensor was introduced by TE Connectivity. Created for high-performance uses, this sensor provides outstanding precision and reliability when measuring pressure.
| Report Attributes | Details |
|---|---|
| Market Size in 2023 | USD 25.12 billion |
| Market Size by 2032 | USD 54.24 billion |
| CAGR | CAGR of 8.93% From 2024 to 2032 |
| Base Year | 2023 |
| Forecast Period | 2024-2032 |
| Historical Data | 2020-2022 |
| Report Scope & Coverage | Market Size, Segments Analysis, Competitive Landscape, Regional Analysis, DROC & SWOT Analysis, Forecast Outlook |
| Key Segments | • By Sensor Type (Position Sensors, Gas Sensors, Pressure Sensors, Level Sensors, Temperature Sensors, Humidity & Moisture Sensors, Flow Sensors, Image Sensors, Force Sensors) • By Type (Contact, Non-Contact) • By Industry (Process, Discrete) |
| Regional Analysis/Coverage | North America (US, Canada, Mexico), Europe (Eastern Europe [Poland, Romania, Hungary, Turkey, Rest of Eastern Europe] Western Europe] Germany, France, UK, Italy, Spain, Netherlands, Switzerland, Austria, Rest of Western Europe]), Asia Pacific (China, India, Japan, South Korea, Vietnam, Singapore, Australia, Rest of Asia Pacific), Middle East & Africa (Middle East [UAE, Egypt, Saudi Arabia, Qatar, Rest of Middle East], Africa [Nigeria, South Africa, Rest of Africa], Latin America (Brazil, Argentina, Colombia, Rest of Latin America) |
| Company Profiles | Honeywell International, Rockwell Automation, Texas Instruments, Panasonic Corporation, TE Connectivity, Amphenol Corporation, Bosch Sensortec, STMicroelectronics, Siemens, Dwyer Instruments |
| Key Drivers | • Demand for smart sensor-enabled wearable devices is increasing. • Automobile manufacturers are increasing their demand for smart sensors to provide improved safety and comfort. |
| RESTRAINTS | • Precise performance demands from next-generation advanced/technological sensors. |
Frequently Asked Questions
Ans: North America dominated the Industrial Sensors Market in 2023.
Ans: The level sensors segment dominated the Industrial Sensors Market.
Ans: Automobile manufacturers are increasing their demand for smart sensors to provide improved safety and comfort which is a major growth factor for the Industrial Sensors Market.
Ans: Industrial Sensors Market size was USD 25.12 billion in 2023 and is expected to Reach USD 54.24 billion by 2032.
Ans: The Industrial Sensors Market is expected to grow at a CAGR of 8.93% during 2024-2032.
Get in Touch
