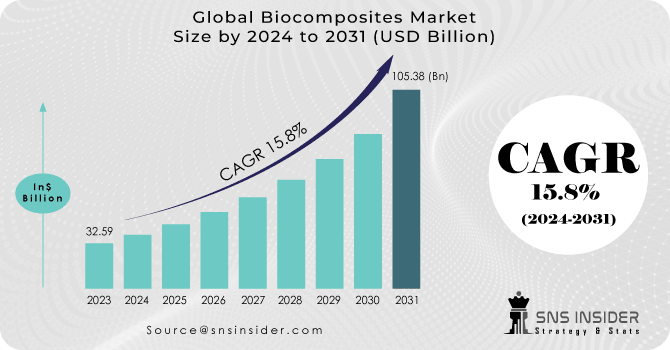
The Biocomposites Market was valued at USD 32.59 billion in 2023 and is supposed to reach USD 105.38 billion by 2031. It is expected to grow at a CAGR of 15.8% over the forecast period 2024-2031.
The biocomposites market is experiencing significant growth due to escalating environmental concerns, driving demand for sustainable alternatives. Advancements in biotechnology and manufacturing processes have improved the performance and cost-effectiveness of biocomposite materials. Heightened regulatory support and incentives for eco-friendly products further stimulate market expansion. Increasing consumer awareness and preference for bio-based materials across diverse industries, including automotive, construction, and packaging, are also pivotal growth factors.
Get More Information on Biocomposites Market - Request Sample Report
The replacement of plastic composites with biocomposites offers opportunities for industries aiming to reduce their environmental footprint and meet sustainability goals. Biocomposites, derived from renewable resources, provide an eco-friendly alternative while maintaining comparable performance characteristics. This shift towards biocomposites aligns with growing consumer demand for sustainable products, opening avenues for market differentiation and brand enhancement.
Drivers
Increasing environmental concerns and emphasis on sustainability
Government regulations favoring the use of bio-based materials
Restraint
Initial higher costs associated with biocomposite materials
Limited availability of consistent quality raw materials
Performance limitations compared to traditional materials in certain applications
The constraint of performance limitations arise when biocomposites may not meet the exacting standards required in specific applications, such as those demanding extreme durability or temperature resistance. While biocomposites offer eco-friendly alternatives, their mechanical properties may not always match those of traditional materials like metals or synthetic plastics. Overcoming these limitations necessitates continuous advancements in biocomposite technology to broaden their applicability and compete effectively in diverse markets.
Opportunities
Growing consumer awareness and preference for eco-friendly products
Expansion of applications across various industries such as automotive, construction, and packaging
The opportunity lies in leveraging biocomposites' versatile properties to address unique challenges across automotive, construction, and packaging industries. In automotive, biocomposites offer lightweight solutions, enhancing fuel efficiency and reducing environmental impact. In construction, they contribute to sustainable building practices, offering durability and insulation properties. Additionally, in packaging, biocomposites provide eco-friendly alternatives to traditional plastics, meeting consumer demand for sustainable packaging solutions. This diversification of applications underscores the market's potential for growth and innovation across various sectors.
Challenges
Competition from conventional materials, especially in price-sensitive markets
Both Russia and Ukraine are key exporters of raw materials like flax, hemp, and wood used in biocomposite production. The war has caused shortages and transportation hurdles, driving up prices of these materials. Russia is a major energy producer, and the war has led to a surge in oil and gas prices. This affects production costs for biocomposites, as energy is used in manufacturing processes. The Russia-Ukraine war has created short-term challenges for the biocomposites market. But the long-term growth opportunities remain positive, driven by the increasing demand for sustainable materials.
During economic downturns, the biocomposites market faces reduced demand as consumers prioritize essential purchases over non-essential items. Businesses, facing financial constraints, postpone investments in sustainable technologies like biocomposites, impacting market growth. Slower economic activity limits expansion opportunities for biocomposite manufacturers, leading to a dampened overall growth rate. Uncertainties in economic conditions further exacerbate the market's challenges, potentially stalling innovation and adoption of biocomposite materials. However, the long-term demand for sustainable solutions may offer resilience, although with slower growth during periods of economic weakness.
By Polymer Type
Natural Polymer Composites
Synthetic Polymer Composites
By Polymer Type, Synthetic Polymer Composites held the largest revenue share in 2023 because of their extensive use in industries requiring high-performance materials. Their versatility allows for customization to meet specific application needs, ranging from aerospace to electronics. Moreover, continuous advancements in synthetic polymer technology have led to improved properties, such as enhanced strength, durability, and resistance to harsh environments, solidifying their position as the preferred choice in the biocomposites market.
By Fiber Type
Wood Fiber Composites
Non-Wood Fiber Composites
Wood Fiber Composites led the biocomposites market with the highest revenue share of more than 52% in 2023 due to their compatibility with existing manufacturing processes and infrastructure. Manufacturers can easily integrate wood fiber composites into their production lines without significant modifications, reducing implementation costs and accelerating adoption. Additionally, wood fiber composites offer excellent strength-to-weight ratios, making them ideal for various applications in industries such as automotive, construction, and consumer goods. Their natural appearance and eco-friendly credentials further contributed to their popularity, driving their substantial revenue share in the biocomposites market.
By Product
Hybrid Biocomposites
Green Biocomposites
Hybrid Biocomposites dominated the product segment of the biocomposites market in 2023 due to their capacity to optimize material properties by combining different types of natural fibers and synthetic polymers. This synergistic approach enhances mechanical strength, durability, and customization possibilities, catering to diverse industry demands. Additionally, hybrid biocomposites offer a sustainable solution by utilizing renewable resources while maintaining competitive performance standards, driving their dominance in the biocomposites market.
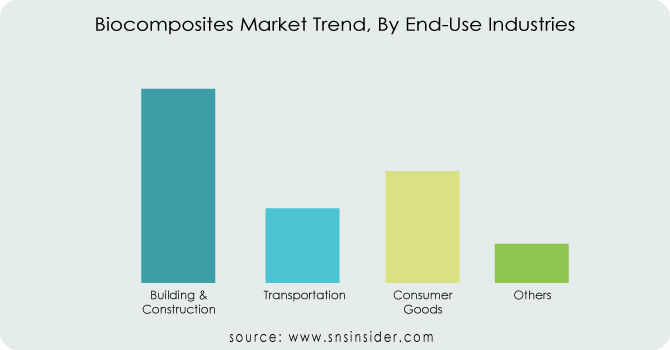
By End-Use Industries
Building & Construction
Consumer Goods
Others
Get Customized Report as per Your Business Requirement - Request For Customized Report
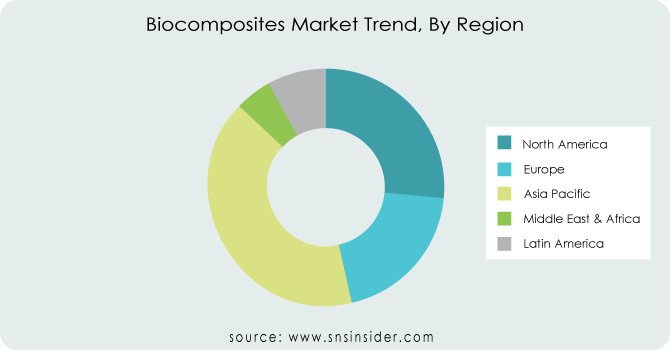
Asia Pacific dominated the Biocomposites Market with the highest revenue share of about 40.5% in 2023. The region's large population and rapid industrialization drive demand for sustainable materials, such as biocomposites, across various industries. Additionally, favorable government policies and initiatives promoting environmental sustainability and renewable resources encourage the adoption of biocomposites. Moreover, the presence of a large industrial base and rapid economic growth fueled demand across diverse sectors such as automotive, building & construction, and packaging, where biocomposites find extensive applications. Furthermore, Asia Pacific benefits from a robust manufacturing ecosystem and technological advancements, facilitating efficient production and widespread usage of biocomposites in the region.
North America is expected to be the second-largest region in the Biocomposites Market during the forecast period. Increasing environmental awareness and stringent regulations promoting sustainable practices drive the adoption of biocomposites across industries. The rapidly expanding aircraft manufacturing business, as well as the electric vehicle industry, are driving up demand for Biocomposites in this region.
North America
US
Canada
Mexico
Europe
Eastern Europe
Poland
Romania
Hungary
Turkey
Rest of Eastern Europe
Western Europe
Germany
France
UK
Italy
Spain
Netherlands
Switzerland
Austria
Rest of Western Europe
Asia Pacific
China
India
Japan
South Korea
Vietnam
Singapore
Australia
Rest of Asia Pacific
Middle East & Africa
Middle East
UAE
Egypt
Saudi Arabia
Qatar
Rest of the Middle East
Africa
Nigeria
South Africa
Rest of Africa
Latin America
Brazil
Argentina
Colombia
Rest of Latin America
The major key players are Trex Company, UPM, FlexForm Technologies, Fiberon LLC, Universal Forest Products, Inc., Meshlin Composites ZRT, Nanjing Jufeng Advanced Materials Co., Ltd., Tecnaro GmbH, Procotex, and A.B.COMPOSITES PVT.LTD.
UPM-Company Financial Analysis
In June 2023, Trex Company, the world's largest manufacturer of high-performance wood-alternative decking and railing, introduced the Trex Select® T-Rail. This composite railing system, featuring a popular T-shaped top rail, aims to make the beauty and convenience of Trex's high-performance composite and aluminum railing accessible to a broader audience with competitive pricing that rivals PVC vinyl railing.
In May 2023, UPM Biochemicals and URSA, one of the leading producers of glass wool and mineral wool in Europe, announced the development of more environmentally friendly building insulation. This innovation will help reduce energy consumption and lower CO2 emissions.
In September 2022, Fiberon launched Wildwood composite cladding, offering the unmatched beauty and warmth of wood combined with the durability of high-performance, low-maintenance materials.
In March 2020, Finland-based paper mill UPM developed a wood-based biocomposite material made with up to 100% renewable resources
| Report Attributes | Details |
|---|---|
| Market Size in 2023 | US$ 32.59 Billion |
| Market Size by 2031 | US$ 105.38 Billion |
| CAGR | CAGR of 15.8% From 2024 to 2031 |
| Base Year | 2023 |
| Forecast Period | 2024-2031 |
| Historical Data | 2020-2022 |
| Report Scope & Coverage | Market Size, Segments Analysis, Competitive Landscape, Regional Analysis, DROC & SWOT Analysis, Forecast Outlook |
| Key Segments | • By Polymer Type, (Natural Polymer Composites and Synthetic Polymer Composites) • By Fiber Type, (Wood Fiber Composites and Non-Wood Fiber Composites) • By Product (Hybrid Biocomposites, and Green Biocomposites) • By End-Use Industries (Building & Construction, Transportation, Consumer Goods, Others) |
| Regional Analysis/Coverage | North America (US, Canada, Mexico), Europe (Eastern Europe [Poland, Romania, Hungary, Turkey, Rest of Eastern Europe] Western Europe] Germany, France, UK, Italy, Spain, Netherlands, Switzerland, Austria, Rest of Western Europe]), Asia Pacific (China, India, Japan, South Korea, Vietnam, Singapore, Australia, Rest of Asia Pacific), Middle East & Africa (Middle East [UAE, Egypt, Saudi Arabia, Qatar, Rest of Middle East], Africa [Nigeria, South Africa, Rest of Africa], Latin America (Brazil, Argentina, Colombia, Rest of Latin America) |
| Company Profiles | Trex Company, UPM, FlexForm Technologies, Fiberon LLC, Universal Forest Products, Inc., Meshlin Composites ZRT, Nanjing Jufeng Advanced Materials Co., Ltd., Tecnaro GmbH, Procotex, and A.B.COMPOSITES PVT.LTD. |
| DRIVERS | • Increasing environmental concerns and emphasis on sustainability • Government regulations favoring the use of bio-based materials |
| RESTRAINTS | • Initial higher costs associated with biocomposite materials • Limited availability of consistent quality raw materials • Performance limitations compared to traditional materials in certain applications |
Ans: The Biocomposites Market was valued at USD 32.59 billion in 2023.
Ans: The expected CAGR of the global Biocomposites Market during the forecast period is 15.8%.
Ans: Increasing environmental concerns and the shift towards sustainable materials are key drivers of the Biocomposites Market.
Ans: One of the key factors hindering the growth of the Biocomposites Market is the performance limitations compared to traditional materials in certain applications.
Ans: Building & Construction led the End-use industries segment of the Biocomposites Market in 2023.
TABLE OF CONTENTS
1. Introduction
1.1 Market Definition
1.2 Scope
1.3 Research Assumptions
2. Industry Flowchart
3. Research Methodology
4. Market Dynamics
4.1 Drivers
4.2 Restraints
4.3 Opportunities
4.4 Challenges
5. Impact Analysis
5.1 Impact of Russia-Ukraine Crisis
5.2 Impact of Economic Slowdown on Major Countries
5.2.1 Introduction
5.2.2 United States
5.2.3 Canada
5.2.4 Germany
5.2.5 France
5.2.6 UK
5.2.7 China
5.2.8 Japan
5.2.9 South Korea
5.2.10 India
6. Value Chain Analysis
7. Porter’s 5 Forces Model
8. Pest Analysis
9. Average Selling Price
9.1 North America
9.2 Europe
9.3 Asia Pacific
9.4 Latin America
9.5 Middle East & Africa
10. Biocomposites Market, By Polymer Type
10.1 Introduction
10.2 Trend Analysis
10.3 Natural Polymer Composites
10.4 Synthetic Polymer Composites
11. Biocomposites Market, By Fiber Type
11.1 Introduction
11.2 Trend Analysis
11.3 Wood Fiber Composites
11.4 Non-Wood Fiber Composites
12. Biocomposites Market, By Product
12.1 Introduction
12.2 Trend Analysis
12.3 Hybrid Biocomposites
12.4 Green Biocomposites
13. Biocomposites Market, By End-Use Industries
13.1 Introduction
13.2 Trend Analysis
13.3 Building & Construction
13.4 Transportation
13.5 Consumer Goods
13.6 Others
14. Regional Analysis
14.1 Introduction
14.2 North America
14.2.1 USA
14.2.2 Canada
14.2.3 Mexico
14.3 Europe
14.3.1 Eastern Europe
14.3.1.1 Poland
14.3.1.2 Romania
14.3.1.3 Hungary
14.3.1.4 Turkey
14.3.1.5 Rest of Eastern Europe
14.3.2 Western Europe
14.3.2.1 Germany
14.3.2.2 France
14.3.2.3 UK
14.3.2.4 Italy
14.3.2.5 Spain
14.3.2.6 Netherlands
14.3.2.7 Switzerland
14.3.2.8 Austria
14.3.2.9 Rest of Western Europe
14.4 Asia-Pacific
14.4.1 China
14.4.2 India
14.4.3 Japan
14.4.4 South Korea
14.4.5 Vietnam
14.4.6 Singapore
14.4.7 Australia
14.4.8 Rest of Asia Pacific
14.5 The Middle East & Africa
14.5.1 Middle East
14.5.1.1 UAE
14.5.1.2 Egypt
14.5.1.3 Saudi Arabia
14.5.1.4 Qatar
14.5.1.5 Rest of the Middle East
14.5.2 Africa
14.5.2.1 Nigeria
14.5.2.2 South Africa
14.5.2.3 Rest of Africa
14.6 Latin America
14.6.1 Brazil
14.6.2 Argentina
14.6.3 Colombia
14.6.4 Rest of Latin America
15. Company Profiles
15.1 Trex Company
15.1.1 Company Overview
15.1.2 Financials
15.1.3 Products/ Services Offered
15.1.4 SWOT Analysis
15.1.5 The SNS View
15.2 UPM
15.2.1 Company Overview
15.2.2 Financials
15.2.3 Products/ Services Offered
15.2.4 SWOT Analysis
15.2.5 The SNS View
15.3 FlexForm Technologies
15.3.1 Company Overview
15.3.2 Financials
15.3.3 Products/ Services Offered
15.3.4 SWOT Analysis
15.3.5 The SNS View
15.4 Fiberon LLC
15.4 Company Overview
15.4.2 Financials
15.4.3 Products/ Services Offered
15.4.4 SWOT Analysis
15.4.5 The SNS View
15.5 Universal Forest Products Inc.
15.5.1 Company Overview
15.5.2 Financials
15.5.3 Products/ Services Offered
15.5.4 SWOT Analysis
15.5.5 The SNS View
15.6 Meshlin Composites ZRT
15.6.1 Company Overview
15.6.2 Financials
15.6.3 Products/ Services Offered
15.6.4 SWOT Analysis
15.6.5 The SNS View
15.7 Nanjing Jufeng Advanced Materials Co., Ltd.
15.7.1 Company Overview
15.7.2 Financials
15.7.3 Products/ Services Offered
15.7.4 SWOT Analysis
15.7.5 The SNS View
15.8 Tecnaro GmbH
15.8.1 Company Overview
15.8.2 Financials
15.8.3 Products/ Services Offered
15.8.4 SWOT Analysis
15.8.5 The SNS View
15.9 Procotex
15.9.1 Company Overview
15.9.2 Financials
15.9.3 Products/ Services Offered
15.9.4 SWOT Analysis
15.9.5 The SNS View
15.10 A.B.COMPOSITES PVT.LTD.
15.10.1 Company Overview
15.10.2 Financials
15.10.3 Products/ Services Offered
15.10.4 SWOT Analysis
15.10.5 The SNS View
16. Competitive Landscape
16.1 Competitive Benchmarking
16.2 Market Share Analysis
16.3 Recent Developments
16.3.1 Industry News
16.3.2 Company News
16.3.3 Mergers & Acquisitions
17. USE Cases and Best Practices
18. Conclusion
An accurate research report requires proper strategizing as well as implementation. There are multiple factors involved in the completion of good and accurate research report and selecting the best methodology to compete the research is the toughest part. Since the research reports we provide play a crucial role in any company’s decision-making process, therefore we at SNS Insider always believe that we should choose the best method which gives us results closer to reality. This allows us to reach at a stage wherein we can provide our clients best and accurate investment to output ratio.
Each report that we prepare takes a timeframe of 350-400 business hours for production. Starting from the selection of titles through a couple of in-depth brain storming session to the final QC process before uploading our titles on our website we dedicate around 350 working hours. The titles are selected based on their current market cap and the foreseen CAGR and growth.
The 5 steps process:
Step 1: Secondary Research:
Secondary Research or Desk Research is as the name suggests is a research process wherein, we collect data through the readily available information. In this process we use various paid and unpaid databases which our team has access to and gather data through the same. This includes examining of listed companies’ annual reports, Journals, SEC filling etc. Apart from this our team has access to various associations across the globe across different industries. Lastly, we have exchange relationships with various university as well as individual libraries.

Step 2: Primary Research
When we talk about primary research, it is a type of study in which the researchers collect relevant data samples directly, rather than relying on previously collected data. This type of research is focused on gaining content specific facts that can be sued to solve specific problems. Since the collected data is fresh and first hand therefore it makes the study more accurate and genuine.
We at SNS Insider have divided Primary Research into 2 parts.
Part 1 wherein we interview the KOLs of major players as well as the upcoming ones across various geographic regions. This allows us to have their view over the market scenario and acts as an important tool to come closer to the accurate market numbers. As many as 45 paid and unpaid primary interviews are taken from both the demand and supply side of the industry to make sure we land at an accurate judgement and analysis of the market.
This step involves the triangulation of data wherein our team analyses the interview transcripts, online survey responses and observation of on filed participants. The below mentioned chart should give a better understanding of the part 1 of the primary interview.

Part 2: In this part of primary research the data collected via secondary research and the part 1 of the primary research is validated with the interviews from individual consultants and subject matter experts.
Consultants are those set of people who have at least 12 years of experience and expertise within the industry whereas Subject Matter Experts are those with at least 15 years of experience behind their back within the same space. The data with the help of two main processes i.e., FGDs (Focused Group Discussions) and IDs (Individual Discussions). This gives us a 3rd party nonbiased primary view of the market scenario making it a more dependable one while collation of the data pointers.
Step 3: Data Bank Validation
Once all the information is collected via primary and secondary sources, we run that information for data validation. At our intelligence centre our research heads track a lot of information related to the market which includes the quarterly reports, the daily stock prices, and other relevant information. Our data bank server gets updated every fortnight and that is how the information which we collected using our primary and secondary information is revalidated in real time.

Step 4: QA/QC Process
After all the data collection and validation our team does a final level of quality check and quality assurance to get rid of any unwanted or undesired mistakes. This might include but not limited to getting rid of the any typos, duplication of numbers or missing of any important information. The people involved in this process include technical content writers, research heads and graphics people. Once this process is completed the title gets uploader on our platform for our clients to read it.
Step 5: Final QC/QA Process:
This is the last process and comes when the client has ordered the study. In this process a final QA/QC is done before the study is emailed to the client. Since we believe in giving our clients a good experience of our research studies, therefore, to make sure that we do not lack at our end in any way humanly possible we do a final round of quality check and then dispatch the study to the client.
The Alkylamines Market Size was valued at USD 6.24 Billion in 2023. It is estimated to reach USD 10.42 Billion by 2031 and grow at CAGR 6.5% over the Forecast period 2024-2031.
The Green Building Materials Market size was USD 424.38 billion in 2023 and is expected to Reach USD 1059.03 billion by 2031 and grow at a CAGR of 12.1% over the forecast period of 2024-2031.
The Emulsion Polymer Market Size was valued at USD 49.56 billion in 2022 and is expected to reach USD 78.39 billion by 2030 and grow at a CAGR of 5.9% over the forecast period 2023-2030.
The Antifreeze Market size was valued at USD 5120 million in 2022. It is estimated to hit USD 8731.56 million by 2030 and grow at a CAGR of 6.9% over the forecast period of 2023-2030.
Carrageenan Market size was valued at USD 873 million in 2022 and is expected to grow to USD 1349.97 million by 2030 and grow at a CAGR of 5.6% over the forecast period of 2023-2030.
The Industrial PC Market Size was valued at USD 5.09 billion in 2022, and is expected to reach USD 8.17 billion by 2030, and grow at a CAGR of 6.1% over the forecast period 2023-2030.

Hi! Click one of our member below to chat on Phone
© 2024 All Rights Reserved by SNS Insider Pvt Ltd