Antifreeze Market Report Scope & Overview:
Get E-PDF Sample Report on Antifreeze Market - Request Sample Report
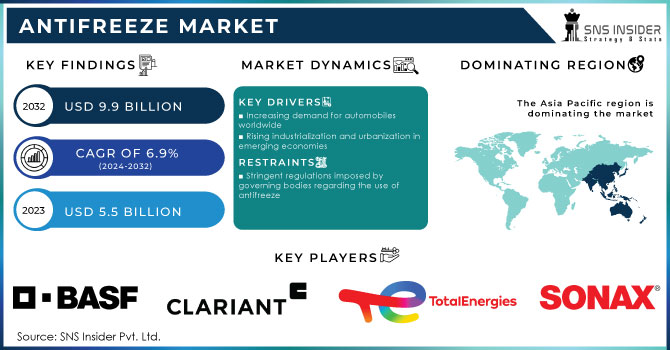
The Antifreeze Market size was valued at USD 5.5 Billion in 2023. It is expected to grow to USD 9.9 Billion by 2032 and grow at a CAGR of 6.9% over the forecast period of 2024-2032.
Antifreeze, also known as coolant, is a substance used to regulate the temperature of engines and prevent them from freezing or overheating. This essential fluid is widely used in various vehicles, including cars, trucks, motorcycles, and heavy-duty machinery. The antifreeze market has witnessed substantial growth in recent years and is expected to continue expanding at a steady pace. Factors contributing to this growth include the rising production and sales of automobiles, particularly in emerging economies.
In 2023, BASF introduced a new line of advanced engine coolants designed to improve vehicle performance and reduce environmental impact. The company emphasized sustainability by incorporating more biodegradable components into its products.
Moreover, the growing awareness among consumers regarding the importance of engine maintenance and the increasing adoption of advanced engine technologies further fuel the demand for antifreeze. Additionally, stringent regulations regarding vehicle emissions and environmental concerns have led to the development of eco-friendly antifreeze solutions, opening up new avenues for market growth.
The automotive aftermarket for antifreeze is growing as more vehicle owners embrace regular maintenance. This fact is evidenced by a U.S. Department of Transportation report stating that the average age of vehicles in America reached 12.2 years in 2023. It is evident that vehicles are lasting longer, and consumers prefer to keep their cars running for a more extended period. This trend is expected to drive the need for the replacement of aftermarket coolants because older vehicles need continuous maintenance. An estimated inquiry by the European Commission claims that over 70% of cars in the European Union are over ten years and therefore, there is a growing demand in the automotive aftermarket for antifreeze and other vehicle maintenance products.
Drivers
-
Increasing demand for automobiles worldwide
-
Rising industrialization and urbanization in emerging economies
-
Growing awareness regarding the importance of regular maintenance and servicing of vehicles
The high demand for antifreeze in the automotive secondary is fueled by the continuously increasing awareness of the importance of regular vehicle servicing and maintenance. The owners come to the understanding that properly used coolants are critical as the former needs to maintain the right temperature to extend the vehicle's life. Governments support this tendency by initiating awareness-raising campaigns. An example of such an effort is the National Highway Traffic Safety Administration’s initiative in the U.S., which is aimed at providing guidelines and recommendations on regular vehicle maintenance. Various key players strive to meet the needs created by the fact that consumers simultaneously emphasize the importance of regular maintenance and demonstrate a wish to minimize such a process frequency. The tendency of minimalism in maintenance means that manufacturers are called to design products that would not require rare replacement while maintaining vehicle safety and performance indicating the ongoing trend of minimization of maintenance in the automotive sector. For example, in 2022, ExxonMobil launched an extended-life antifreeze series that is expected to reduce maintenance frequency while providing increased engine safety and higher levels of protection.
Restraint
-
Stringent regulations imposed by governing bodies regarding the use of antifreeze
-
Volatility in raw material prices
One of the prominent challenges for the antifreeze market is the volatility of raw material prices because it has a significant impact on the cost of production and potential profits for manufacturers. As such, ethylene and propylene glycol are essential elements of antifreeze, which are linked to crude oil and natural gas. As the prices of fossil fuels tend to fluctuate rapidly due to various recurring or one-time factors such as geopolitical instability, crudes, and so forth it can be rather complicated to manage the cost. For instance, in 2022, the issues related to supply chains were announced, and it caused an increase in the cost of fossil fuels. In this context, it is important to mention that the price of the end product cannot be raised too much because the cost of the alternative product is not correlated with the cost of production. As a result, some manufacturers experienced shrinking profit margins.
Opportunity
-
Growing focus on sustainable practices and the rising demand for bio-based antifreeze products
-
Increasing adoption of electric vehicles (EVs)
As the world shifts towards a more sustainable future, the demand for electric vehicles has been steadily rising. These vehicles, powered by electricity rather than traditional internal combustion engines, offer numerous advantages such as reduced emissions and improved fuel efficiency. However, this transition also brings about unique challenges that require innovative solutions. One such challenge is the need to regulate the temperature of electric vehicle components, particularly the batteries. Electric vehicle batteries are highly sensitive to temperature fluctuations, as extreme heat or cold can negatively impact their performance and lifespan. This is where antifreeze plays a crucial role and creates opportunities for the antifreeze market.
Market segmentation
By Product
Ethylene Glycol antifreeze products dominated the antifreeze market with the highest revenue share of about 60.5% in 2023. This type of antifreeze boasts exceptional thermal stability, making it highly effective in preventing freezing and overheating of engines. Its ability to maintain optimal temperature levels ensures the smooth operation of vehicles, safeguarding their engines from potential damage. Ethylene glycol antifreeze is best at transferring heat from the engine. It is very important to remove heat from the engine. Otherwise, the mechanism will overheat, and it can cause serious damage. In some cases, engine repair can be as expensive as the car itself. It has an anti-corrosion effect. This property protects the engine, radiator, hoses, and seals from corrosion.
By Technology
The organic acid technology (OAT) application segment held a revenue share of more than 52.7% in 2022. This is attributed to the presence of environment-friendly, easily decomposable neutralized inorganic salts and acids. In addition, the longer drain interval of OAT is expected to propel the market growth.
The HOAT market is expected to gain significant demand over the forecast period due to its longer lifetime and efficient corrosion inhibition. In addition, excellent coolant-to-coolant compatibility and the rising usage of HOAT as factory fill by automotive OEMs such as Mercedes, BMW, Mini Cooper, and Volvo are anticipated to propel the demand for general aftermarket coolant.
By Application
Automotive applications held the largest market share around 75% in 2023. HVAC systems are widely used in the automotive and industrial sectors, and the demand for antifreeze is increasingly growing. Factors such as various initiatives by governments, rapid urbanization, rising income, and changing lifestyles of people are expected to keep contributing to the development of the market in the following eight years. The automotive segment is no less dominant in the antifreeze market, with the growing emphasis on vehicle maintenance and servicing seeing car owners’ focus turn first to replacing their coolants. Moreover, the wider availability of electric and hybrid vehicles has also facilitated innovations in cooling technologies, thus broadening the potential of the automotive sector as a market for antifreeze. Overall, the automotive sector’s presence remains paramount due to growing car sales and vehicle users’ elevated attention to engine care.
Regional Analysis
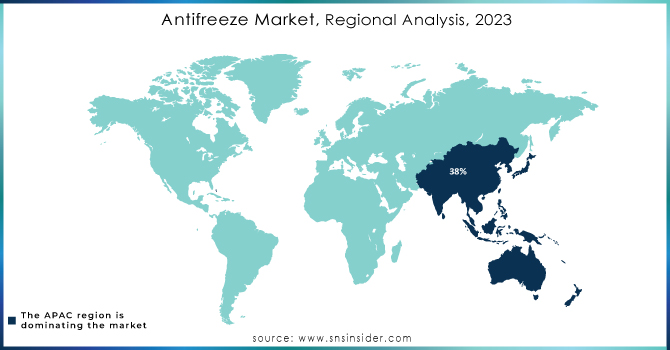
Asia Pacific dominated the antifreeze market with the highest revenue share of about 38% in 2023. This remarkable growth is attributed to the surging demand for passenger cars and light commercial vehicles, particularly in China and India. Moreover, the automotive sector in several countries, such as India, China, Indonesia, and Thailand, has been experiencing significant growth, fueled by an improved standard of living, heightened consumer awareness, and a rise in disposable income. For instance, according to the International Organization of Motor Vehicle Manufacturers (OICA), the Asia Pacific region produced over 43 million vehicles in 2022, with China and India being the largest contributors. China's automotive market alone saw 26 million passenger vehicles sold in 2022. These factors are expected to drive the market's expansion throughout the forecast period. Furthermore, the increasing adoption of electric vehicles and the substantial investments in research and development for hybrid vehicles are poised to create new avenues for growth. This exciting development not only aligns with the global shift towards smart transportation but also presents lucrative opportunities for the antifreeze market.
North America is the second largest region for the antifreeze market and is expected to grow with a steady growth rate of about 7.2% during the forecast period. The region's robust automotive industry, coupled with the increasing demand for vehicles, has significantly contributed to the expansion of the antifreeze market. Additionally, North America's extreme weather conditions, particularly in the northern regions, further drive the demand for antifreeze. The harsh winters experienced in these areas necessitate the use of antifreeze to prevent engine damage caused by freezing temperatures. Furthermore, the growing awareness among consumers regarding the importance of regular vehicle maintenance has also fueled the demand for antifreeze.
Get Customized Report as Per Your Business Requirement - Request For Customized Report
Key Players
-
BASF SE (Glysantin)
-
Royal Dutch Shell (Shell CoolGuard)
-
TotalEnergies (Total Coolelf)
-
PARAS Lubricants (ParaCool Green)
-
CCI Corporation (Super Long-Life Coolant)
-
Chevron Corporation (Chevron Delo ELC)
-
KOST USA, Inc. (DEFENSE ELC)
-
Old World Industries Inc. (PEAK Antifreeze)
-
Gulf Oil International (Gulf Antifreeze)
-
SONAX GmbH (SONAX Antifreeze)
-
Millers Oils (Millermatic ATF)
-
PENTOSIN (Pentosin SF Antifreeze)
-
Recochem Inc. (Recochem OEM Premium Antifreeze)
-
Valvoline Inc. (Valvoline Multi-Vehicle Antifreeze)
-
Prestone Products Corporation (Prestone All Vehicles)
-
ExxonMobil Corporation (Mobil Delvac Extended Life)
-
Zerex (Zerex G-05)
-
Motul (Motul Inugel Expert Ultra)
-
Clariant AG (Antifrogen)
-
Bluecol (Bluecol Universal Antifreeze)
Recent Development:
-
In 2023, Old World Industries launched an upgraded PEAK OET Extended Life Antifreeze/Coolant, focusing on compatibility with all vehicle types, including those with advanced engines.
-
In 2023, KOST introduced the DEFENSE ELC, an extended-life coolant designed for diesel engines, which includes advanced additives for enhanced corrosion protection and thermal stability.
-
In 2022, TotalEnergies expanded its Coolelf antifreeze product line with a new formula targeting hybrid and electric vehicles. This development aims to support the growing EV market by providing specialized cooling solutions.
| Report Attributes | Details |
| Market Size in 2023 | US$ 5.46 Bn |
| Market Size by 2032 | US$ 9.96 Bn |
| CAGR | CAGR of 6.91% From 2024 to 2031 |
| Base Year | 2023 |
| Forecast Period | 2024-2032 |
| Historical Data | 2020-2022 |
| Report Scope & Coverage | Market Size, Segments Analysis, Competitive Landscape, Regional Analysis, DROC & SWOT Analysis, Forecast Outlook |
| Key Segments | By Product (Propylene Glycol, Ethylene Glycol, and Glycerin) By Technology (IAT, OAT, and HOAT) By Application (Aerospace, Automobile, and Industrial heat transfer and cooling systems) |
| Regional Analysis/Coverage | North America (US, Canada, Mexico), Europe (Eastern Europe [Poland, Romania, Hungary, Turkey, Rest of Eastern Europe] Western Europe] Germany, France, UK, Italy, Spain, Netherlands, Switzerland, Austria, Rest of Western Europe]), Asia Pacific (China, India, Japan, South Korea, Vietnam, Singapore, Australia, Rest of Asia Pacific), Middle East & Africa (Middle East [UAE, Egypt, Saudi Arabia, Qatar, Rest of Middle East], Africa [Nigeria, South Africa, Rest of Africa], Latin America (Brazil, Argentina, Colombia Rest of Latin America) |
| Company Profiles | BASF SE, Royal Dutch Shell, Total, PARAS Lubricants, CCI Corporation, Chevron Corporation, KOST USA, Inc., Old World Industries Inc., Gulf Oil International, SONAX Gmbh, Millers Oils, PENTOSIN, Recochem Inc. |
| Key Drivers | Increasing demand for automobiles worldwide Rising industrialization and urbanization in emerging economies Growing awareness regarding the importance of regular maintenance and servicing of vehicles |
| Market Restraints | Stringent regulations imposed by governing bodies regarding the use of antifreeze. Volatility in raw material prices |
Frequently Asked Questions
Yes, you can buy reports in bulk quantity as per your requirements. Check Here for more details.
The Organic Acid Technology segment dominated the Antifreeze Market with a revenue share of about 54.5% in 2023.
The automotive application segment dominated the Antifreeze Market with the highest revenue share of about 78.5% in 2023.
The expected CAGR of the global Antifreeze Market during the forecast period is 6.9%.
The Antifreeze Market was valued at USD 5.46 billion in 2023.
Get in Touch
