Biodegradable Water Bottles Market Key Insights:
The Biodegradable Water Bottles Market size was USD 2.41 billion in 2023 and is expected to Reach USD 3.5 billion by 2031 and grow at a CAGR of 4.8% over the forecast period of 2024-2031.
The biodegradable water bottle market is growing significantly. Factors such as growing environmental concerns with plastic bottles, increasing government efforts to encourage people to use biodegradable water bottles, and reducing the use of single-use plastics are the major factors driving the growth of the market. I'm here. Additionally, as several countries have announced bans on the use of plastic, biodegradable water bottles can be a great alternative to plastic water bottles. Biodegradable water bottles are environmentally friendly as the bottle, label and cap can be composted.

Get More Information on Biodegradable Water Bottles Market - Request Sample Report
Biodegradable, plant-based water bottles reduce your carbon footprint. These can be broken down and easily burned as clean-burning fuels. Such bottles are ideal for entertainment complexes, corporate events, sporting events, etc. This greatly reduces plastic bottle waste. Moreover, increasing production of bioplastics such as PHA, PLA and starch mixtures is also driving the growth of the global market.
Moreover, increasing R&D activities by major players to produce biodegradable water bottles that are easily compostable and help reduce plastic waste will contribute to the growth of the global biodegradable water bottle market during the forecast period. It can offer great opportunities. However, in some countries, consumers prefer to use plastic bottles, which may hamper the growth of the global market.
Many governments around the world have implemented regulations and policies to encourage the use of biodegradable materials and reduce the use of single-use plastics. These guidelines created a favorable environment for the growth of these bottles. In addition, the market is also driven by increasing availability and affordability of biodegradable materials. Advances in technology and manufacturing methods have made biodegradable materials more accessible and affordable, making it easier for manufacturers to mass produce biodegradable bottles.
MARKET DYNAMICS
KEY DRIVERS:
-
The main drivers are changing consumer preferences and increased demand for sustainably produced products.
Consumers are active participants in the selection of products conforming to their environmental values and willing to pay a price premium for biodegradable alternatives.
-
Governments across the globe are implementing laws and policies aimed at reducing plastics pollution and promoting sustainable practices.
RESTRAIN:
-
Compared with traditional plastics, biodegradable materials and manufacturing processes often have a higher cost.
OPPORTUNITY:
-
There is a significant potential for growth in the emerging markets
Consumer awareness about environmental concerns is on the rise in emerging markets and efforts are being made to introduce sustainable practices. Untapped opportunities exist for the manufacture of bioplastic water bottles in emerging economies such as Asia, Latin America and Africa.
-
Opportunities for innovation of products are present as biodegradable materials, manufacturing processes and packaging designs continue to improve.
CHALLENGES:
-
A lack of awareness about the advantages and availability of biodegradable water bottles may continue to exist among consumers.
IMPACT OF RUSSIAN UKRAINE WAR
During the conflict water bottles market had a short-term effect on the market growth potential. War and its aftermath can affect consumer sentiment and purchasing behavior. In times of geopolitical tension, consumers sometimes prioritize basic needs and necessities over eco-friendly products. The focus shifts to more pressing concerns about safety and affordability, which could impact demand for biodegradable bottled water in the short term.
Packaging of America had a total revenue loss of 3.1% during 2022, this was majorly due to the conflict. There was also the supply of less organic raw materials which affected the nations. Russia exported paper, paperboard, Cellulose fibers worth $16.32 million in 2021, which was reduced to $8.56 in 2022. Sweden exported nearly about worth $15 million in raw materials to Russia which was reduced to $8 million in 2022.
In this way, conflict affected many nations’ imports and export which affected the market growth of the biodegradables water bottles market.
IMPACT OF ONGOING RECESSION
Sales growth is continuously declining during recession period. Sales growth of major companies declined by 7.1% in 2021, which declined to 6% in 2022 and in 2023 it is expected that it will decline to 4%.
This happened because during economic downturns, consumers may become more price-conscious and choose cheaper alternatives. Biodegradable water bottles are often more expensive than traditional plastic bottles and can struggle to maintain market share. Price-conscious consumers may be attracted to cheaper packaging options, which may affect demand for biodegradable bottled water.
There are chances for the growth of market because, during recessions, governments often implement fiscal stimulus measures to revive the economy. These measures can include policies promoting sustainability, environmental protection, and the use of eco-friendly products. If governments incentivize or support the adoption of biodegradable packaging solutions, it could provide a boost to the biodegradable water bottle market.
KEY MARKET SEGMENTATION
By Material
-
Paper
-
Sugarcane Pulp
-
Organic Material
-
Bamboo
-
PHA
-
PLA
-
Cellulose Based Plastic
-
Algae
-
Others
By Capacity
-
15-100 ml
-
100-500 ml
-
500-1000 ml
-
Others
By End User
-
Specialty Purpose
-
Institutional Use
-
Residential Use
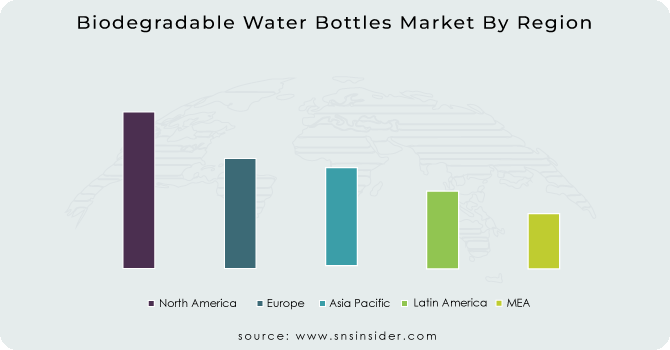
REGIONAL ANALYSIS
North America:
Growing environmental awareness and focus on sustainability have made North America one of the leading markets for biodegradable bottled water.
Consumer preferences and government initiatives have increased demand for biodegradable alternatives to traditional plastic bottles in the United States and Canada.
Major companies in the region have adopted biodegradable bottled water, resulting in a highly competitive market.
Europe:
Europe is at the forefront of sustainability efforts, including reducing plastic waste. As a result, the market for biodegradable water bottles has grown significantly. Countries such as Germany, the United Kingdom, and France are seeing increased demand for eco-friendly packaging solutions, driving the adoption of biodegradable water bottles.
Stringent regulations and initiatives to promote a circular economy have played an important role in shaping the European market.
Asia Pacific:
The Asia-Pacific region is experiencing significant growth in the biodegradable bottled water market, which is mainly driven by its large population, increasing urbanization, and increasing environmental awareness.
Countries such as China, Japan, and India have seen a shift towards sustainable packaging and increased demand for biodegradable water bottles.
Government initiatives, consumer education, and the emergence of eco-friendly brands are expected to continue to accelerate penetration in the region.
Latin America:
As consumers become more environmentally conscious, interest in biodegradable bottled water is also growing in Latin America.
Countries such as Brazil, Mexico and Colombia are seeing increased demand for sustainable packaging options such as biodegradable water bottles.
The market in the region is expected to grow as more companies introduce biodegradable alternatives to traditional plastic bottles.
Middle East and Africa:
The market for biodegradable water bottles in the Middle East and Africa is relatively small compared to other regions, but it is gradually gaining importance.
Growing environmental concerns and growing awareness of sustainability have increased the demand for biodegradable packaging solutions such as bottled water. Countries such as South Africa, the United Arab Emirates and Kenya are increasing their intake of biodegradable alternatives.
Get Customized Report as per your Business Requirement - Request For Customized Report
REGIONAL COVERAGE:
North America
-
US
-
Canada
-
Mexico
Europe
-
Eastern Europe
-
Poland
-
Romania
-
Hungary
-
Turkey
-
Rest of Eastern Europe
-
-
Western Europe
-
Germany
-
France
-
UK
-
Italy
-
Spain
-
Netherlands
-
Switzerland
-
Austria
-
Rest of Western Europe
-
Asia Pacific
-
China
-
India
-
Japan
-
South Korea
-
Vietnam
-
Singapore
-
Australia
-
Rest of Asia Pacific
Middle East & Africa
-
Middle East
-
UAE
-
Egypt
-
Saudi Arabia
-
Qatar
-
Rest of Middle East
-
-
Africa
-
Nigeria
-
South Africa
-
Rest of Africa
-
Latin America
-
Brazil
-
Argentina
-
Colombia
-
Rest of Latin America
Key Players
Some major key players in the Biodegradable Water Bottles market are Raepack Limited, Mitsubishi Plastics, Paper Water Bottle, Lyspackaging, TSL Plastics Ltd, Ecologic Brands Inc, Montana Private Reserve, Choose Water, Just Water, Biopac Co and other players.
Raepack Limited-Company Financial Analysis
RECENT DEVELOPMENTS
-
In partnership with Erewhon, Cove, the California based material innovation firm, made its First Biodegradable Water bottle.
-
Agthia, an Abu Dhabi based food and beverage company, is launching a new bottle of water made from palm oil.
| Report Attributes | Details |
| Market Size in 2023 | US$ 2.41 Billion |
| Market Size by 2031 | US$ 3.5 Billion |
| CAGR | CAGR of 4.8% From 2024 to 2031 |
| Base Year | 2023 |
| Forecast Period | 2024-2031 |
| Historical Data | 2020-2022 |
| Report Scope & Coverage | Market Size, Segments Analysis, Competitive Landscape, Regional Analysis, DROC & SWOT Analysis, Forecast Outlook |
| Key Segments | • By Material (Paper, Sugarcane Pulp, Organic Material, Bamboo, PHA, PLA, Cellulose Based Plastic, Algae, Biodegradable Plastic, Others) • By Capacity (15-100 ml, 100-500 ml, 500-1000 ml, Others) • By End User (Speciality Purpose, Institutional Use, Residential Use) |
| Regional Analysis/Coverage | North America (US, Canada, Mexico), Europe (Eastern Europe [Poland, Romania, Hungary, Turkey, Rest of Eastern Europe] Western Europe] Germany, France, UK, Italy, Spain, Netherlands, Switzerland, Austria, Rest of Western Europe]). Asia Pacific (China, India, Japan, South Korea, Vietnam, Singapore, Australia, Rest of Asia Pacific), Middle East & Africa (Middle East [UAE, Egypt, Saudi Arabia, Qatar, Rest of Middle East], Africa [Nigeria, South Africa, Rest of Africa], Latin America (Brazil, Argentina, Colombia Rest of Latin America) |
| Company Profiles | Raepack Limited, Mitsubishi Plastics, Paper Water Bottle, Lyspackaging, TSL Plastics Ltd, Ecologic Brands Inc, Montana Private Reserve, Choose Water, Just Water, Biopac Co |
| Key Drivers | • The main drivers are changing consumer preferences and increased demand for sustainably produced products. • Governments across the globe are implementing laws and policies aimed at reducing plastics pollution and promoting sustainable practices. |
| Market Restraints | • Compared with traditional plastics, biodegradable materials and manufacturing processes often have a higher cost. |
Frequently Asked Questions
Ans: North American region is leading the market.
Ans: Higher cost of manufacturing the restrain for the market growth.
Ans: Plastic is expected to lead the biodegradable water bottles market.
Ans: Biodegradable Water Bottles Market size is expected to Reach USD 3.5 billion by 2031.
Ans: Biodegradable Water Bottles Market is expected to grow at a CAGR of 4.8%.
Get in Touch
