Bioprocess Containers Market Size Analysis:
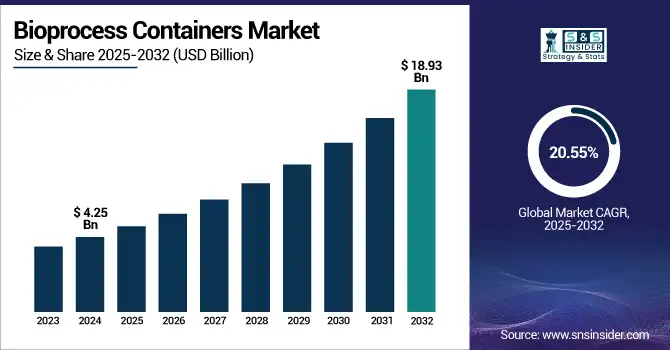
The Bioprocess Containers Market size was valued at USD 4.25 billion in 2024 and is expected to reach USD 18.93 billion by 2032, growing at a CAGR of 20.55% over the forecast period of 2025-2032.
To Get more information on Bioprocess Containers Market - Request Free Sample Report
The global bioprocess containers market is experiencing positive impetus with the rising need for flexible, scalable, and cost-effective bioproduction processes. In contrast to conventional stainless-steel systems, bioprocess containers are single-use. On the one hand, they minimize contamination, cleaning validation, and water and energy consumption (up to 5–10 times more resource efficient). Rising production of biologics & biosimilars, growing R&D expenditure in cell & gene therapy, and adoption of modular construction of facilities are leading to the bioprocess containers market growth.
For instance, the demand for bioprocess containers in the U.S. continues to grow as more advanced therapies are being FDA-approved. Regulatory resources, such as the NIH’s regulatory guide for cell and gene therapies, help continue that adoption. The leading companies that provide bioprocess containers, including Thermo Fisher Scientific, Sartorius, and CellBios, are introducing multilayer film technologies and smart sensor-embedded containers.
“Biopharma companies are reported to be moving towards OpEx as opposed to CapEx, using single-use technologies to optimize production cost and flexibility,” industry reviews said. Aging in the face of rising pharmaceutical R&D The enhanced R&D spend in the U.S., marking a close to USD 102 billion in pharmaceutical R&D in 2023 alone, drives innovation to a greater extent. New research says intense demand and supply, regulation, and expansion in new biotech territories are shaping this global space.
For instance, Thermo Fisher Scientific has added an inline sensor monitor on its bioprocessing containers to enable real-time analytics, thereby increasing the market value of the bioprocess containers market by increasing the visibility of operations.
Bioprocess Containers Market Dynamics:
Drivers:
-
Accelerating the Adoption of Single-Use Technologies in Biopharma Propels the Market Growth
The bioprocess containers market is centred on the growing adoption of single-use technologies (SUTs) brought about by the demand for flexible, low-cost, and scalable manufacturing practices in biopharmaceutical manufacturing. The systems cut the risk of cross-contamination and do not require heavy cleaning and sterilization, sparing 30-50% of the cost of operations, according to industry estimates. The increasing biologics pipelines and growth of biosimilars are driving demand for disposable bioprocess solutions that can provide faster time-to-market and facilitate high-throughput manufacturing.
Biologics represented more than 46% of the top 100 globally sold drugs in 2023 and highlight the need for modular and flexible buildings. The support of regulatory authorities is also essential both the FDA and the EMA recommend single-use systems as good manufacturing practice (GMP) compliant, which is expediting the uptake of the technology. Growing biopharma R&D expenditure that crossed USD 140 billion globally in 2023 will additionally stimulate the bioprocess containers market forecast. Companies including Cytiva and Merck have committed capital to increasing capacity for single-use manufacturing, an investment in long-term demand. Furthermore, the adaptability of the supply chain and the ability to rapidly scalability render SUTs vital for pandemic preparedness and cell/gene therapy production, major growing markets. This has translated into an increasing innovation in the U.S. bioprocess containers industry and the uptick in both biotech demand as well as contract manufacturing to supply that demand.
Restraints:
-
Environmental Concerns and Complex Supply Chain Dependencies Hinders Market Expansion
Although single-use bioprocessing systems are operationally effective, such systems add significantly to plastic waste (each biomanufacturing batch produces 200–500 kg of plastic that is disposed of), which raises issues regarding long-term environmental impact. The treatment of waste and recycling of multilayer polymeric films used in bioprocessing containers is still a technological challenge, and there are also few options in infrastructure for processing these materials globally. Furthermore, a dependence on several boutique suppliers of high-quality polymeric films and container accessories exists in the industry.
In fact, in a 2022 BioPharm International survey, 58% of respondents reported supply chain delays as a major impediment to implementing or expanding the use of single-use systems. In addition, rigorous traceability of materials and extractables/leachables testing according to FDA and EMA guidelines compels extensive validation, prolonging time-to-market and raising costs for compliance. Such regulatory nuances can hold back smaller biotech firms from a quick SUT adoption pace. In this context, companies in the bioprocess containers market need to operate on the edge of innovation and environmental sustainability and supply chain continuity, they will confront a tough, but necessary battlefield for future industry resilience and sustainable development.
Bioprocess Containers Market Segmentation Analysis:
By Product
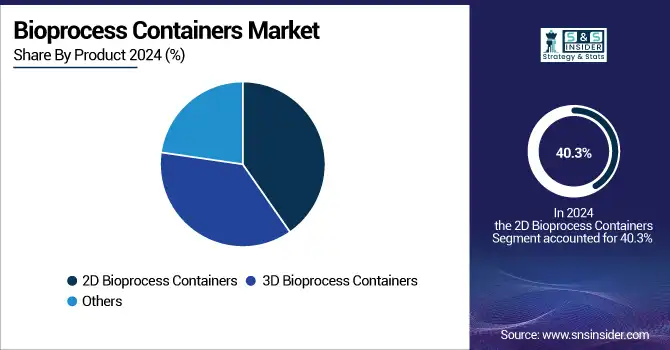
The global 2D bioprocess containers market is dominated by 2D bioprocess containers, with a 40.3% bioprocess containers market share in 2024, as 2D bioprocess containers are widely used in media preparation, sampling, and buffer storage during biopharmaceutical processes. Their small size, easy integration in already installed structures, and affordable price render them suitable for several applications, either in small and large-scale production plants.
3D bioprocess containers are expected to be the fastest expanding section, which can be attributed to their higher volume capabilities and their evolving role in bulk drug substance storage, as well as transportation. Their efficiency in maximizing space in big biomanufacturing settings is driving fast uptake, especially in high-throughput production of biologics and CDMO sites.
By Workflow
Upstream processing is considered to be the dominant segment with a bioprocess containers market share of 36.9% in 2024 in the market and is continuing to dominate over the forecast period, owing to the growing requirement for high-performance containers used in fermentation, cell culture, and media/buffer preparation. The dominance is an outcome of the proliferating prevalence of single-use bioreactors and evolving development in cell line engineering. On the other hand, downstream processing is the fastest-growing workflow segment owing to the growing requirement for sterile and closed-system solutions in filtration and purification. Disposable technology advancements that minimize the potential for contamination risk and maximize the probability for high product recovery are advantageous for this sector.
By End User
In 2024 pharmaceutical and biotech companies are expected to hold the largest market share, 37.3%, because of their extensive R&D budgets and early adoption of single-use systems for commercial and clinical production, and capacity for in-house biomanufacturing. Meanwhile, CDMOs and CROs are expanding the fastest as increasing numbers of sponsors are outsourcing, especially small to medium-sized biotechs that do not have an in-house production infrastructure, and who are scouting for flexible, scalable, and, most importantly, affordable biomanufacturing.
Regional Insights:
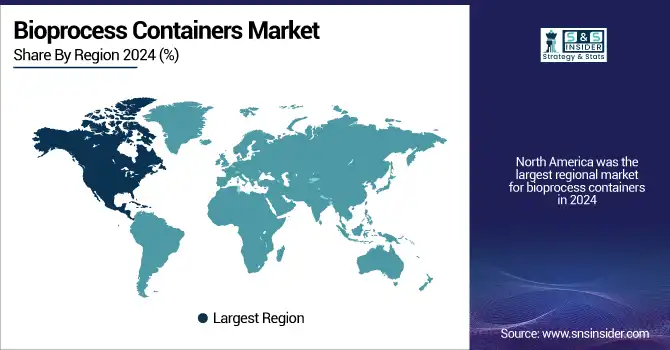
North America was the largest regional market for bioprocess containers in 2024, owing to the world-class biomanufacturing infrastructure, significant presence of major market players, and the high R&D expenditure in the region.
The U.S. bioprocess containers market size was valued at USD 1.14 billion in 2024 and is expected to reach USD 4.64 billion by 2032, growing at a CAGR of 19.26% over the forecast period of 2025-2032. The U.S. leads, holding the biggest share due to its position in biologics manufacturing and cell/gene therapy approvals, which are over 60% of all gene therapy trials being performed in the U.S. alone. Furthermore, the FDA promotes single-use systems, and the pharmaceutical industry’s huge investments in the market add to the market demand. In Canada, spending in life sciences and public-private participation is driving moderate bioprocess containers market growth, while in Mexico, localized pharmaceutical production is underway.
Europe is the second-largest regional bioprocess containers market on account of strict regulations and the creation of more and more biosimilars. Germany takes the lead in the region, assisted by a well-developed biopharmaceutical industry and early use of automation and single-use equipment. Germany is also home to leading bioprocessing companies and innovation centers. In France and the U.K., national biotech initiatives and academic-corporate partnerships are moving at a breakneck pace, as high demand for disposable and flexible bioprocessing systems has set in for the region.
Asia Pacific is the fastest-growing region in the bioprocess containers market, primarily due to the growing biologics manufacturing, increasing number of clinical research activities, and supportive government initiatives. China is heavily driving the region, with its huge investments in biopharma infrastructure and the increasing number of CDMOs serving both local and international drug pipelines. In 2023, China endorsed more than 20 new biologics, evincing the need for scalable single-use technologies. India is also making rapid progress in terms of an increase in the government fund under the "Biotech Industry Research Assistance Council (BIRAC)" initiative, which is a Singapore and South Korea's present innovation-led hubs and manufacturing-friendly conditions.
Get Customized Report as per Your Business Requirement - Enquiry Now
Bioprocess Containers Market Key Players:
Key players in the bioprocess containers market include Sartorius AG, Thermo Fisher Scientific, Merck KGaA, Danaher Corporation, Saint-Gobain, Meissner Filtration Products, Single Use Support, Entegris, CellBios, Lonza and others.
Recent Developments in the Bioprocess Containers Market:
In May 2024, Thermo Fisher Scientific announced the opening of a USD 44 million single-use technology manufacturing facility in Utah, aimed at expanding its bioprocessing capabilities to meet the growing global demand for flexible biomanufacturing solutions.
In April 2024, Saint-Gobain introduced its Freeze-Pak STS Bio-Containers and STS Shippers, a new single-use solution designed for the frozen storage and transport of biologics at temperatures as low as -80°C. This innovation enhances cold chain logistics by providing reliable, scalable options for handling temperature-sensitive biopharmaceuticals.
| Report Attributes | Details |
|---|---|
| Market Size in 2024 | USD 4.25 billion |
| Market Size by 2032 | USD 18.93 billion |
| CAGR | CAGR of 20.55% From 2025 to 2032 |
| Base Year | 2024 |
| Forecast Period | 2025-2032 |
| Historical Data | 2021-2023 |
| Report Scope & Coverage | Market Size, Segments Analysis, Competitive Landscape, Regional Analysis, DROC & SWOT Analysis, Forecast Outlook |
| Key Segments | • By Product (2D Bioprocess Containers, 3D Bioprocess Containers, Others) • By Workflow (Upstream Processing, Downstream Processing) • By End User (Pharmaceutical and Biopharmaceutical Companies, CDMOs & CROs, Others) |
| Regional Analysis/Coverage | North America (US, Canada, Mexico), Europe (Germany, France, UK, Italy, Spain, Poland, Turkey, Rest of Europe), Asia Pacific (China, India, Japan, South Korea, Singapore, Australia, Rest of Asia Pacific), Middle East & Africa (UAE, Saudi Arabia, Qatar, South Africa, Rest of Middle East & Africa), Latin America (Brazil, Argentina, Rest of Latin America) |
| Company Profiles | Sartorius AG, Thermo Fisher Scientific, Merck KGaA, Danaher Corporation, Saint-Gobain, Meissner Filtration Products, Single Use Support, Entegris, CellBios, and Lonza |
Frequently Asked Questions
North America dominated the bioprocess containers market.
Environmental concerns and complex supply chain dependencies hinder market expansion.
The bioprocess containers market is centred on the growing adoption of single-use technologies (SUTs) brought about by the demand for flexible, low-cost cost and scalable manufacturing practices in biopharmaceutical manufacturing.
The market is expected to reach USD 18.93 billion by 2032, increasing from USD 4.25 billion in 2024.
The Bioprocess Containers market is anticipated to grow at a CAGR of 20.55% from 2025 to 2032.
Get in Touch
