Bluetooth 5.0 Market Size & Overview:
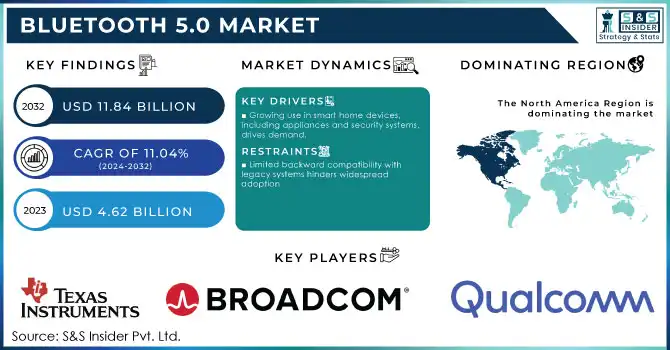
The Bluetooth 5.0 Market was valued at USD 4.62 billion in 2023 and is expected to reach USD 11.84 Billion by 2032, growing at a CAGR of 11.04% from 2024-2032.
The Bluetooth 5.0 market is experiencing rapid growth with widespread acceptance of wireless connectivity combined with increasing demand in the consumer electronics, healthcare, automotive, and smart home industry verticals. Specifically, it enables a number of audio streaming, data transfer and location tracking applications, making it the backbone of the Internet of things (IoT) ecosystem. In audio streaming devices, Bluetooth 5.0 shipments are projected to rise from 448 million Bluetooth headphones and earbuds by 2024, to 712 million units by 2028. The segment is seeing advantages from consumer preferences for wireless audio solutions, as well as developments such as LE Audio that enhance audio quality and power. On the other hand, the new interest in portable, high-quality audio devices is expected to push Bluetooth speaker shipments to 262 million in 2024.
To Get More Information on Bluetooth 5.0 Market - Request Sample Report
Bluetooth 5.0 is fueling applications in wearables in healthcare such as activity, heart rate and patient health management. The market is further boosted by smart home devices such as those with Bluetooth capabilities including home appliances such as refrigerators and washing machines which allow users to remotely control and monitor them. Bluetooth is also used for wireless monitoring of equipment across industrial applications such as logistics and manufacturing, contributing to operational efficiency.
North America is currently at the forefront of adoption owing to technological leadership whereas Asia-Pacific is the fastest-growing market driven by rising disposable income and demand for smart devices, particularly in the rapidly developing countries like China and India. Examples include an Auracast broadcast audio feature for sharing sound in specific locations, as well as energy-harvesting Bluetooth 5.3 SoCs, highlighting the innovation taking place in this market to address a wide variety of consumer and industrial applications. Bluetooth 5.0 is versatile and updated with state of art functionalities and capabilities making it important in various applications of wireless connectivity which is going to stay in every aspect of life. These reasons outline its crucial place in the changing digital and connected ecosystems.
Market Dynamics
Drivers
-
Growing use in smart home devices, including appliances and security systems, drives demand
-
Increasing use in wearables for health monitoring and medical device connectivity
-
Deployment in manufacturing for equipment monitoring and automotive applications like keyless entry and infotainment systems
Bluetooth 5.0 is revolutionizing the manufacturing and automotive industries by enabling advanced equipment monitoring and keyless entry systems. Its extended range (up to 800 feet) and improved data transmission speeds make it ideal for real-time monitoring of manufacturing equipment, ensuring efficiency and minimizing downtime. Sensors equipped with Bluetooth 5.0 transmit critical performance data to central systems, allowing for predictive maintenance and reducing the risk of equipment failures. This wireless technology eliminates the need for complex cabling, providing cost-effective and scalable solutions for industrial automation.
In the automotive sector, Bluetooth 5.0 facilitates seamless connectivity for keyless entry systems, enhancing user convenience and security. By linking a smartphone or key fob to a vehicle, Bluetooth enables automatic door locking and unlocking, as well as engine ignition, without physical keys. Additionally, the technology is used in infotainment systems to connect multiple devices, stream audio, and provide hands-free communication, delivering a superior in-car experience.
Innovations like Bluetooth Low Energy (LE) ensure minimal power consumption, critical for battery-operated sensors and devices in these industries. For instance, companies such as Broadcom and Alps Alpine have collaborated to create high-accuracy Bluetooth positioning systems, enhancing the functionality of automotive applications like precise vehicle location tracking and improved navigation systems Furthermore, the ability of Bluetooth 5.0 to handle multiple device connections simultaneously supports the growing use of IoT in manufacturing. Equipment data, environmental conditions, and worker safety metrics can all be monitored in real-time through a single Bluetooth network. This reduces manual intervention, increases operational efficiency, and supports the adoption of Industry 4.0 practices. Overall, Bluetooth 5.0's versatility and technological advancements are transforming these sectors by enabling smarter, more connected systems. Its ability to integrate with diverse applications while ensuring low power consumption and reliable performance positions it as a critical technology for the future of manufacturing and automotive industries
Restraints
-
Limited backward compatibility with legacy systems hinders widespread adoption
-
Potential vulnerabilities in Bluetooth connections pose risks of unauthorized access and data breaches
-
While energy-efficient, the range of Bluetooth 5.0 for certain industrial or automotive applications may require additional amplifiers or infrastructure.
Bluetooth 5.0 is known for its power efficiency and additional range, providing up to 800 feet under optimal conditions. However, its range does limit its use in more demanding industrial or automotive applications, where connectivity is needed over larger or more complex environments. Complex environments – take for example, large manufacturing facilities or multi-story buildings which typically experience physical impediments to Bluetooth signals through walls, machinery, or other structures. Likewise, in vehicular applications that involve communication between a vehicle and a device (e.g. vehicle-to-device communication), the effective range decreases due to external factors such as metal obstacles or interference from other wireless signals. This often requires extra infrastructure like amplifiers or repeaters to overcome these challenges. Although these improve range and maintain signal quality over longer distances, they eventually add to system complexity and costs. Deploying Bluetooth-enabled predictive maintenance systems across a factory, for instance, could require amplifiers to ensure that there is high-fidelity communication between sensors and control systems. In the same vein, automotive use cases, such as keyless entry systems based on Bluetooth or infotainment capabilities in larger vehicles, e.g., buses or trucks, will also need additional infrastructure to cope with signal attenuation from vehicle design. In addition, while Bluetooth 5.0's power-saving capabilities result in reduced energy use for individual devices, the overall energy consumption of the system might raise by providing infrastructure components (e.g., amplifiers). That may prove more difficult for sectors with an energy-efficient or sustainability focus.
Although Bluetooth 5.0 provides a significant improvement over Bluetooth 4.x, the maximum practical range of Bluetooth in industrial and automotive applications may require further investments in amplifiers or other infrastructure. This can increase the cost and complexity of deployment, and may prevent adoption in cost-sensitive environments or applications.
Segment Analysis
By Offering
The hardware segment dominated the Bluetooth 5.0 market and represented revenue share of more than 42.0% in 2023. This expansion of the adoption of Bluetooth devices like headphones, speakers, wearables, and automotive systems is the primary driver for the hardware segment. As the demand for Bluetooth in consumer and industrial applications increases, the need for premium and reliable hardware like Bluetooth chips, transmitters and receivers is also increasing. Hardware leads driven by booming IoT device & smart home product demand alongside expansion of wireless audio systems. Growth to be powered by innovations such as Bluetooth 5.2 and 5.3 that enable enhanced energy savings, increased range, and greater data transfer rates, increasing the requirement for newer hardware. The hardware segment will remain at the forefront of wireless market growth, with strong Bluetooth adoption, new product launches, and continued innovation powering demand of the Bluetooth-enabled solutions.
The software category is expected to experience the largest compound annual growth rate (CAGR) during the forecast period for the Bluetooth 5.0 market with the rising inclination towards software solutions that support integration & improved functionality for Bluetooth devices. It is, therefore, essential that dedicated software helps refine hardware compatibility, security, and connectivity functionalities like geolocation services and active transfer protocols. As IoT, smart homes and industrial automation revolutionize the world, the demand for high-end Bluetooth software solutions including device management software, application software and security software is only set to increase. The growing shift to cloud-based solutions and networking of devices in general will also require more advanced Bluetooth software as the years go by. Innovative software solutions delighting customers will experience rapid growth, confirming this segment to have the largest growth in the upcoming billion dollar market over the next few years.
By Organization Size
In 2023, The Large enterprise segment dominated the market and accounting for 70.28% of revenue share, since it has a strong technological infrastructure, and have a higher budget, as well as more structured wireless solutions at low power, longer range, and higher-performance wireless solutions irrespective of its scalability or its reliability. The adoption of Bluetooth 5.0 is expected to increase across large enterprises across major industries verticals such as automotive, manufacturing automotive, healthcare and retail as they seek support for IoT initiatives, smart devices and more enhanced customer experiences. These organizations use Bluetooth for asset tracking, real-time transfer and other solutions for automating numerous applications. The continued digitalisation process and the growing requirement for wireless communication give the demand an extra push. Future adoption of Bluetooth 5.0 is expected to see more uptick especially within sectors that required strong security and real-time data analytics, even as large enterprises are ready to strengthen their connected devices and smart systems
The highest growth rate in Bluetooth 5.0 market is expected in the Small and Medium Enterprises (SMEs) segment due to rising cost-effectiveness and scalability of Bluetooth technology. Bluetooth 5.0 is being adopted by SMEs across different sectors including Retail, Logistics AND Healthcare to improve their enterprise functions with economical wireless solutions. As IoT ecosystem develops, these businesses are using Bluetooth 5.0 in particular for applications including inventory management, asset tracking and customer interaction via smart devices. With the availability of cheaper Bluetooth modules and sensors today, and with the inevitable SME demand for automation and data analytics, the stage has been set for quick adoption. With Bluetooth technology available to almost anyone, this segment's growth will only accelerate, allowing every SME to stand up and compete with large enterprises with better, more efficient systems.
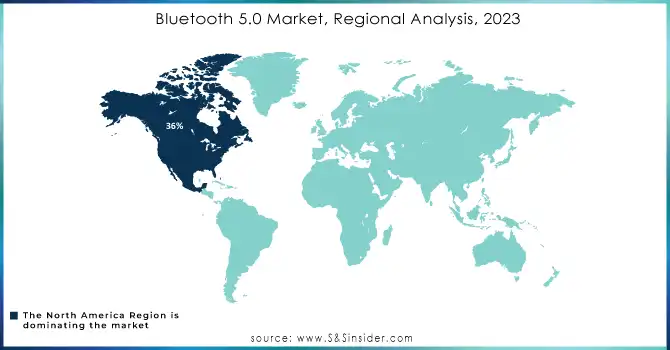
Regional Analysis
North America dominated the Bluetooth 5.0 market and represented revenue share of 36% in 2023, due to the technological improvements in countries such as the U.S. and Canada. A well-established infrastructure, high IoT devices penetration rate and rapid wireless connectivity development in auto, healthcare, and consumer electronic sectors are propelling the region. Combine that with strong R&D at companies such as Qualcomm, Broadcom and Intel and it’s easy to see why the region continues to propel Bluetooth 5.0 technologies. Also, regulatory support of energy efficiency and wireless communication standards enhances the adoption of the Bluetooth-based solutions. With sustained investment in smart cities, IoT and industrial automation, the North American market is likely to flourish further yielding increasing demand for Bluetooth 5.0.
Asia Pacific (APAC) is expected to hold the highest CAGR in the Bluetooth 5.0 market. China, India, Japan, and South Korea are some of the major profiteers of this upsurge because of the quickly increasing urbanization, higher disposable incomes, and an abundance of Bluetooth-supporting devices. Giant demand from consumer electronics, automotive, and industrial sector growth is driving the rapid development of the APAC market because they all need Bluetooth as a mandatory support to have high-performance automatic systems. Apart from the expansion of demand for wireless solutions in healthcare, retail, and logistics, rise of IoT and smart cities in country like China and India are also major factors contributing towards the growth of the market. The Bluetooth 5.0 market in the APAC region will continue to grow rapidly as the increasing number of businesses and consumers move toward connected, smart devices, fuelling demand for next-generation wireless solutions.
Do You Need any Customization Research on Bluetooth 5.0 Market - Enquire Now
Key Players
The major key players are
-
Qualcomm – Qualcomm QCC514X Bluetooth Audio SoC
-
Broadcom – BCM4356 Bluetooth 5.0 SoC
-
Intel – Intel Wireless-AC 9560 (Bluetooth 5.0)
-
Texas Instruments – SimpleLink Bluetooth 5.0 SoC
-
NXP Semiconductors – NXP KW41Z Bluetooth 5.0 Solution
-
Nordic Semiconductor – nRF52840 Bluetooth 5.0 SoC
-
Microchip Technology – ATBTLC1000 Bluetooth 5.0 Module
-
STMicroelectronics – BlueNRG-2 Bluetooth 5.0 SoC
-
Qualcomm Atheros – Qualcomm QCA9377 Bluetooth 5.0 Chipset
-
MediaTek – MT2523 Bluetooth 5.0 System-on-Chip
-
CSR (a subsidiary of Qualcomm) – CSR1010 Bluetooth 5.0 Module
-
Roku – Roku Wireless Speakers (Bluetooth connectivity)
-
Samsung Electronics – Galaxy Buds (Bluetooth 5.0)
-
Apple – AirPods Pro (Bluetooth 5.0)
-
Harman International – JBL Flip 5 Bluetooth Speaker
-
Sony Corporation – Sony WH-1000XM4 Headphones (Bluetooth 5.0)
-
Broadcom – BCM43455 Bluetooth 5.0 SoC
-
Anker Innovations – Soundcore Liberty Air 2 Pro (Bluetooth 5.0)
-
Garmin Ltd. – Garmin Forerunner 245 Music (Bluetooth 5.0)
-
Fitbit (Google) – Fitbit Charge 5 Fitness Tracker (Bluetooth 5.0)
Recent Developments
Broadcom and Alps Alpine Partnership (October 2023): These companies collaborated to develop a high-accuracy positioning system using Bluetooth Low Energy (BLE) technology. This innovation is particularly geared towards automotive applications, such as keyless entry and precision navigation, enhancing Bluetooth's role in the industry
LE Audio Deployment (2024): LE Audio, which builds on Bluetooth technology, is set to significantly enhance audio performance with lower power consumption and improved sound quality. It includes the introduction of Auracast™ broadcast audio, allowing one audio source device to broadcast to multiple audio devices, which is expected to revolutionize public venues and hearing aids. Major companies like Samsung and Xiaomi have already integrated support for this feature
| Report Attributes | Details |
| Market Size in 2023 | USD 4.62 billion |
| Market Size by 2031 | USD 11.84 Billion |
| CAGR | CAGR of 11.04% from 2024-2032 |
| Base Year | 2023 |
| Forecast Period | 2024-2032 |
| Historical Data | 2020-2022 |
| Report Scope & Coverage | Market Size, Segments Analysis, Competitive Landscape, Regional Analysis, DROC & SWOT Analysis, Forecast Outlook |
| Key Segments | • By Offering (Hardware, Software, Services) • By Application (Audio Streaming, Data Transfer, Location Services, Device Networks) • By Organization Size (SMEs, Large Enterprises) |
| Regional Analysis/Coverage | North America (US, Canada, Mexico), Europe (Eastern Europe [Poland, Romania, Hungary, Turkey, Rest of Eastern Europe] Western Europe] Germany, France, UK, Italy, Spain, Netherlands, Switzerland, Austria, Rest of Western Europe]), Asia Pacific (China, India, Japan, South Korea, Vietnam, Singapore, Australia, Rest of Asia Pacific), Middle East & Africa (Middle East [UAE, Egypt, Saudi Arabia, Qatar, Rest of Middle East], Africa [Nigeria, South Africa, Rest of Africa], Latin America (Brazil, Argentina, Colombia Rest of Latin America) |
| Company Profiles |
Qualcomm, Broadcom, Intel, Texas Instruments, NXP Semiconductors, Nordic Semiconductor, Microchip Technology, STMicroelectronics, Qualcomm Atheros, MediaTek |
| Key Drivers | •Growing use in smart home devices, including appliances and security systems, drives demand •Increasing use in wearables for health monitoring and medical device connectivity •Deployment in manufacturing for equipment monitoring and automotive applications like keyless entry and infotainment systems |
| Market Restraints | •Limited backward compatibility with legacy systems hinders widespread adoption •Potential vulnerabilities in Bluetooth connections pose risks of unauthorized access and data breaches •While energy-efficient, the range of Bluetooth 5.0 for certain industrial or automotive applications may require additional amplifiers or infrastructure. |
Frequently Asked Questions
Ans- Bluetooth 5.0 Market was valued at USD 4.62 billion in 2023 and is expected to reach USD 11.84 Billion by 2032, growing at a CAGR of 11.04% from 2024-2032.
Ans- the CAGR of Bluetooth 5.0 Market during the forecast period is of 11.04% from 2024-2032.
Ans- The North America dominated the market and represented significant revenue share in 2023
Ans- one main growth factor for the Bluetooth 5.0 Market is
- Growing use in smart home devices, including appliances and security systems, drives demand.
Ans- Challenges in the Bluetooth 5.0 Market are
- Limited backward compatibility with legacy systems hinders widespread adoption.
- Potential vulnerabilities in Bluetooth connections pose risks of unauthorized access and data breaches.
Get in Touch
