Caprolactam Market Report Scope & Overview:
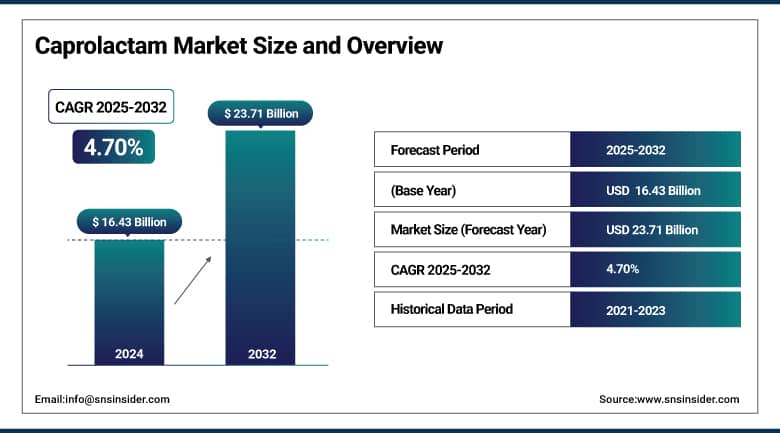
The Caprolactam Market size was valued at USD 16.43 billion in 2024 and is expected to reach USD 23.71 billion by 2032, growing at a CAGR of 4.70% over the forecast period of 2025-2032.
The caprolactam market is pursuing fast developments with the increasing demand for synthetic fibres, particularly in textile and carpet, although the increasing demand is also found in engineering plastics for automotive lightweighting. Sustainability has been dictating caprolactam market trends, with caprolactam market companies being inclined to bio-based feedstocks and enhancing operational efficiency. The caprolactam market analysis shows that Asia Pacific remains the most active for caprolactam, which is seeing the expansion of integrated nylon-6 value chains. High-performance materials, the caprolactam market is growing packaging and electronics being the emerging growth engines.
China imported 153,755t of caprolactam in 2013, rising 79.7% year on year, reported China Customs. BASF issued a USD 0.15/lb price increase for May 2024, citing raw material cost pressures. These trends are influencing the global caprolactam market share and also showing caprolactam market growth opportunities through 2032 for the key sectors and regions. The caprolactam industry continues to be at the forefront of the production of synthetic fibre and advanced materials globally.
To Get More Information On Caprolactam Market - Request Free Sample Report
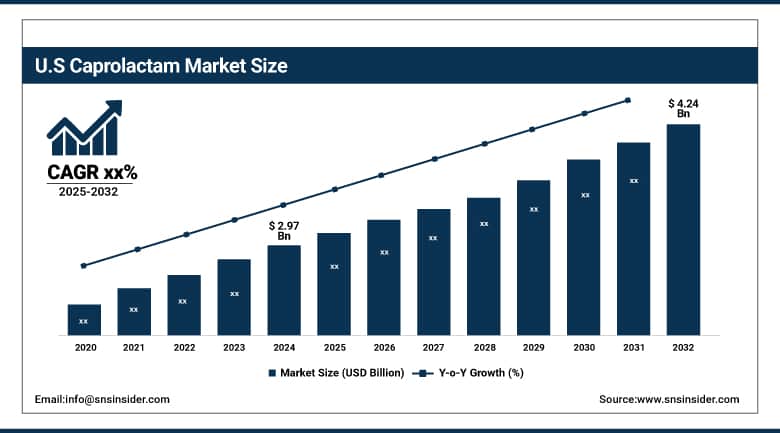
North America is the second-dominant region in the caprolactam market in 2024, holding a significant market share of 25.1%. The region is supported by strong automobile and increasing demand for synthetic fibers in textiles and industrial applications. U.S., the largest country-level market in 2024 with a value of USD 2.97 billion and is projected to reach a market value of 4.24 billion dollars in 2032 with a market share of 72.1%, driven by efforts to advance manufacturing technologies and practices that are more environmentally friendly by the U.S. Department of Energy. The fastest-growing country in the region is Canada, where chemical manufacturing investments are boosting infrastructure. These factors all contribute to the steady market growth and high caprolactam market share.
Caprolactam Market Drivers:
-
Expansion Of Automotive Lightweighting Programs Accelerates Shifts Toward Engineering Plastics Applications
High electric vehicle adoption and lightweight automotive projects are spurring the demand for engineering-grade nylon‑6, resulting in an increase in the caprolactam market, fostering the growth of the caprolactam market size in high-performance applications. The U.S. and European automakers are incorporating components using composites reinforced with nylon‑6 based on caprolactam, thus pushing synthetic fibers beyond the realm of textiles. BASF said it would increase its caprolactam prices by USD 0.15/lb, effective May 2024, which it said was supported by strong demand and a cost recovery in higher value-added markets. Caprolactam producers are setting up closers to automotive regions to get closer to the customer-driven logistics support caprolactam trends toward shorter supply chains.
-
Regional Policies Incentivizing Bio‑Derived Intermediates Reshape Global Supply Dynamics Quickly
Growing carbon regulations and bioeconomy incentives in Europe and Asia Pacific are driving increased R&D and investments in bio-based caprolactam routes, transforming cost structures in the caprolactam industry. According to the EU Green Deal, governments are subsidizing renewable chemical technologies, putting pressure on players such as BASF to explore circular feedstocks. The caprolactam market trends are gradually shifting the caprolactam market share toward sustainable grades. China’s integrated hubs in Shandong and Hebei, which have increasing nylon‑6 capacity, are now piloting lignocellulosic feedstocks, in line with national goals to curtail crude oil dependency and carbon footprints within the materials industries.
Caprolactam Market Restraints:
-
Energy‑Intensive Production Remains Vulnerable to Feedstock Price Fluctuations
Caprolactam is an energetically expensive product, so the caprolactam industry is influenced by benzene and cyclohexanone prices. In North America, BASF increased caprolactam prices by USD 0.20/lb in March 2024 amid surging feedstock expenses. This kind of volatility can squeeze margins for caprolactam producers and deter the growth of the caprolactam market, particularly for those plants that have not integrated upstream feedstock sourcing. This leaves smaller producers open to sudden pass-through cost pressures that could weigh on margins and deter investment in expanding capacity even in a context of growing demand for synthetic fibres.
Caprolactam Market Segmentation Analysis:
By Application
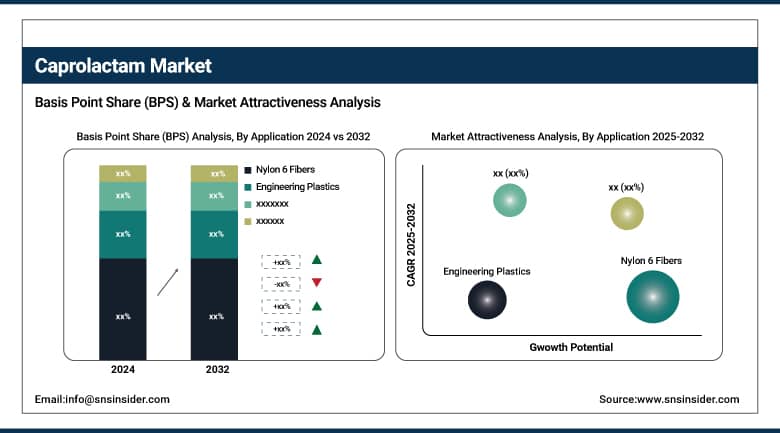
Nylon 6 fibers dominated and accounted for 39.2% of the caprolactam market share in 2024, owing to their superior strength, elasticity, and abrasion resistance. These fibers are widely used in man-made fabrics, in carpets, and in industrial yarns. Government programs promoting domestic textile manufacturing in India, China, and the U.S. have also helped spur demand. According to the American Fiber Manufacturers Association, the high-durability uses for nylon include coverings for car parts, belts, and construction materials. Caprolactam imports increased 79.7% last year in China Customs, and most of it is used to produce fibers. Their properties of weightlessness can be perfect for fast fashion and high-performance sport clothing production.
Engineering plastics are the fastest-growing application in the caprolactam market, with a projected CAGR of 5.11% during the forecast period of 2025-2032. The increase is driven by their use in the automotive, electronics, and construction industries. One of the key drivers is the move away from metals to high-performance plastics for lightweight car parts and for energy-saving appliances. Lightweighting to improve vehicle fuel efficiency is put forward by the U.S. Department of Energy, driving increasing demand for nylon 6-based engineering plastics. Caprolactam’s contribution to those plastics is key. Furthermore, BASF and LANXESS are increasing capacities for nylon 6, supporting the latter’s development by tight worldwide standards regarding emissions and the efficiency of fuel consumption.
By End-use
The automotive segment dominated the caprolactam market with a 38.6% share in 2024 on account of an increase in lightweight vehicle components. Nylon 6 caprolactam-based materials are increasingly applied to under-the-hood, fuel systems, and interior applications. The U.S. EPA and European Commission are encouraging lightweighting for fuel economy requirements, and helping drive demand. Key caprolactam suppliers including DOMO Chemicals and AdvanSix have bolstered their automotive-grade nylon production. The accelerating EV market also underpins this trend, with nylon’s inherent heat resistance and mechanical properties being vital features in applications such as electric drivetrains, battery housings, and structural vehicle components.
Film & coatings is the fastest-growing end-use segment in the caprolactam market, expanding at a 5.3% CAGR during the forecast period of 2025-2032. Growth is being driven by greater utilization in packaging, construction, and electronics. Nylon films have high tensile strength with excellent gas barrier properties and resistance to safeguard food grade packaging and industrial insulation. Nylon 6 films for food contact have been cleared by the U.S. Food and Drug Administration (FDA), which paves the way for their development in the commercial market. In addition, Fujifilm and Toray Industries increased the production of nylon film to cope with the increasing demand in APAC. The growth of this segment is in line with sustainability trends, as films are also being developed for recyclability and lower environmental impact.
Caprolactam Market Regional Outlook:
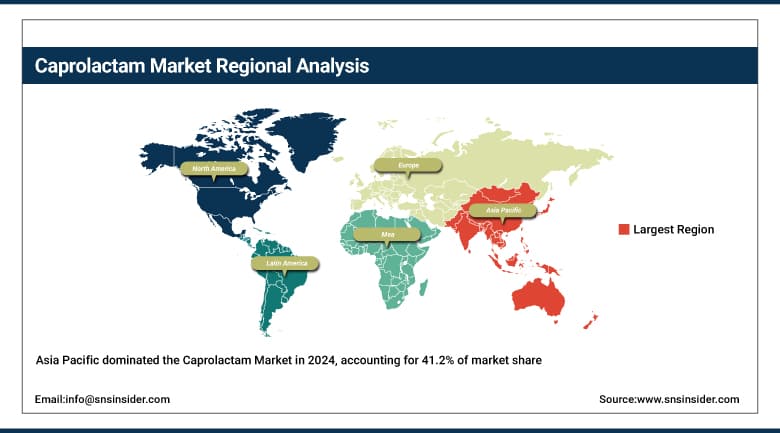
Asia Pacific is the dominating and fastest-growing region in the caprolactam market in 2024, commanding a market share of 41.2%. The demand for caprolactam is primarily driven by fast industrialization and the growing automotive and textile industries in China, India, and Japan. The largest producer, China, is supported by government backing for chemical production and infrastructure expansion, according to China’s Ministry of Industry and Information Technology. Increasing consumer preference towards synthetic fiber for clothing and other industrial applications to stimulate the market outlook. Leadership of the caprolactam market will be maintained by the region's emphasis on technological developments and market penetration.
Get Customized Report as Per Your Business Requirement - Enquiry Now
Europe ranks as the third dominating region in the caprolactam market in 2024, with a significant market share of 20.3%. High demand for engineering plastics in the automotive and electronics industries fuels market growth. Germany, which is the biggest producer, benefits from the regulations of the European Chemicals Agency, enabling safer use of chemicals and innovation. The leading companies in the Caprolactams market are the current focus of the consumption of caprolactams, while the market opens up opportunities to invest in sustainable synthetic fibers. The ecological compliance and the sophisticated industrial practice make this region a competitive finalist in the caprolactam market.
LAMEA is an emerging region in the caprolactam market, with promising growth potential over the forecast period. Brazil is out in front with textiles and automotives growing with government support under the policy to stimulate chemical production. Saudi Arabia and the UAE stand out in the ME&A region, with investments in the petrochemical and textile industries, reinforced by programmes, such as Saudi Vision 2030, to enhance chemical production innovation and diversify economies. Growth of the synthetic fiber market in consumer products and automotive applications, and continuing infrastructure expansion, creates favourable market conditions the counterbalanced by logistical and infrastructural issues.
Caprolactam Market Companies are:
-
China Petroleum & Chemical Corporation (Sinopec)
-
AdvanSix Inc.
-
DOMO Chemicals
-
Alpek S.A.B. de C.V.
-
Sumitomo Chemical Co., Ltd.
-
KuibyshevAzot PJSC
-
Highsun Group (including Fibrant)
-
Zhejiang Hengyi Group Co., Ltd.
Recent Developments:
-
In May 2025, Domo Chemicals completed maintenance at its caprolactam and nylon-6 plant in May 2025, improving operational efficiency and ensuring a steady supply. This maintenance supports the company’s commitment to quality and meeting growing demand in the caprolactam market.
-
In November 2024, Sumitomo Chemical launched a new caprolactam production technology that enhances environmental sustainability by reducing emissions and energy use. This innovation supports the company’s efforts to lead in sustainable practices within the caprolactam industry.
| Report Attributes | Details |
|---|---|
| Market Size in 2024 | USD 16.43 billion |
| Market Size by 2032 | USD 23.71 billion |
| CAGR | CAGR of 4.70% From 2025 to 2032 |
| Base Year | 2024 |
| Forecast Period | 2025-2032 |
| Historical Data | 2021-2023 |
| Report Scope & Coverage | Market Size, Segments Analysis, Competitive Landscape, Regional Analysis, DROC & SWOT Analysis, Forecast Outlook |
| Key Segments | •By Application (Nylon 6 Fibers, Nylon 6 Resins, Engineering Plastics, Films) •By End-use (Automotive, Film & Coatings, Industrial, Electronics & Electrical, Consumer Goods, Textile & Apparel, Others) |
| Regional Analysis/Coverage | North America (US, Canada, Mexico), Europe (Germany, France, UK, Italy, Spain, Poland, Turkey, Rest of Europe), Asia Pacific (China, India, Japan, South Korea, Singapore, Australia, Rest of Asia Pacific), Middle East & Africa (UAE, Saudi Arabia, Qatar, South Africa, Rest of Middle East & Africa), Latin America (Brazil, Argentina, Rest of Latin America) |
| Company Profiles | BASF SE, China Petroleum & Chemical Corporation (Sinopec), AdvanSix Inc., DOMO Chemicals, Alpek S.A.B. de C.V., UBE Corporation, Sumitomo Chemical Co., Ltd., KuibyshevAzot PJSC, Highsun Group (including Fibrant), and Zhejiang Hengyi Group Co., Ltd. |
Frequently Asked Questions
The automotive sector dominates the Caprolactam Market, with nylon 6-based materials used in fuel systems, battery parts, and interiors.
Asia Pacific leads with 41.2% market share, boosted by industrial growth and government support in China, India, and Japan.
Engineering plastics lead growth in the Caprolactam Market, fueled by automotive and electronics demand for lightweight, high-performance materials.
Nylon 6 fibers dominate the Caprolactam Market with 39.2% share, due to their strength and wide use in textiles and carpets.
The Caprolactam Market growth is driven by rising synthetic fiber demand, especially in textiles and automotive lightweighting applications.
Get in Touch
