Sustainable Adhesives Market Report Scope & Overview
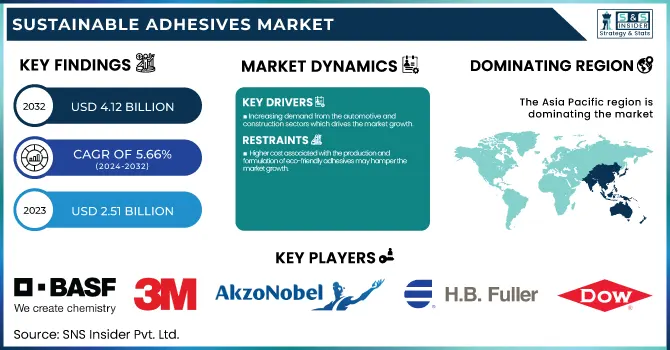
The Sustainable Adhesives Market size was USD 2.51 Billion in 2023 and is expected to reach USD 4.12 Billion by 2032 and grow at a CAGR of 5.66 % over the forecast period of 2024-2032.
Growing need for environmental-friendly packaging is one of the major factors that drive the growth of the global sustainable adhesives market. With global consumers and businesses having become more environmentally conscious, the demand for packaging solutions which impact less on the environment. More governments are introducing EPR laws, while consumers are increasingly interested in brands that pursue sustainable practices). Specifically in the production of eco-friendly packaging for industries such as food and beverage, e-commerce, and cosmetics, where manufacturers and brands are choosing recyclable, biodegradable, or compostable materials, adhesives are key to making this shift.
In October 2024, Evonik cut its adhesives division as part of a wide-reaching restructuring effort. The firm also plans to divest its polyester business and cut production of keto acids at its Hanau site, impacting around 260 workers. The operation is intended to concentrate on core businesses, and is expected to realise annual cost savings of €400 million by 2026.
One of the main factors impelling the growth of sustainable adhesives market is the consumer demand for green products. With growing emphasis on environmental issues, consumers are readily considering sustainability in their buying decisions and are looking for products that are low impact on the environment. Changes in consumer behavior are manifested quite glaringly in industries such as packaging, personal care and electronics, where people increasingly favor eco-friendly materials and manufacturing processes. Brands have identified this need and incorporated sustainable options, both in product, such as using non-toxic, biodegradable, renewable resource-based adhesives.
To ensure the credibility of green claims, the Central Consumer Protection Authority (CCPA) issued guidelines in October 2024 to prevent greenwashing and misleading environmental claims.
Drivers
Increasing demand from the automotive and construction sectors which drives the market growth.
The automotive industry has long been on a quest to reduce the weight of its vehicles to achieve better fuel economy and abide by strict regulations for the environment. This is important work, as these sustainable adhesives, which will also include bio-based epoxies, are needed for heavy weighting solutions in lightweight materials like composites and plastics, offering strength or durability. Furthermore, with a shift towards electric vehicles (EV) across the automotive sector, sustainable adhesives are being deployed for assembling parts with a lower environmental foot-print, including battery components and interior fittings. The construction sector has been putting more focus on energy-efficient buildings and infrastructure to reduce environmental footprints. Sustainable adhesives with low volatile organic compounds (VOCs) and those derived from renewable resources are gaining acceptance in a wide range of applications including flooring, wall panels, and thermal insulation materials.
These adhesive products comply with green building standards including LEED (Leadership in Energy and Environmental Design) certification, which encourages the use of sustainable materials. As sustainability becomes more important to both industries and both industries are looking to decrease the emissions, waste and environmental impact of their products, the need for sustainable adhesives should also continue to grow. Adobe's latest roadmap highlights this trend which not only propels market growth but also falls in line with global sustainability goals within manufacturing and construction.
Restraint
Higher cost associated with the production and formulation of eco-friendly adhesives may hamper the market growth.
One of the major restraints for growth of sustainable adhesives market are the high cost of production and formulation of eco-friendly adhesives. Sustainable adhesives, which tend to be bio-based or come from renewable resources, are also more costly than conventional, petroleum-based adhesives. Natural resins or plant-based polymers form the raw materials for eco-friendly adhesives, and acquiring them can be pricy owing to low availability or the need for extra processing to refine them into binding grade constituents. In addition, the research and development (R&D) requirement for improving these adhesives for performance and durability also increases the cost. Hence, end-use industries, such as packaging, construction, and automotive, where cost is a major factor, are reluctant to adopt the green adhesives and there is a high capital cost involved in technology transfer.
Market segmentation
By Type
Recyclable segment held the largest market share around 38% in 2023. They play an important role in fulfilling the environmental as well as functional requirements of numerous industries. A large proportion of global economy and consumers are now focusing on sustainability; thus, recyclability of the products is on the rise and it is imperative that adhesives support recyclability. Recyclable adhesives are highly desirable in both packaging and automotive industries, which are increasingly prioritizing waste reduction and closed-loop systems. These materials can be recycled free of contamination since they can be easily separated in the recycling process (e.g., packaging materials such as paper, cardboard, or plastics). Besides, the use of recyclable adhesives is leveraged with stringent regulatory compliance towards waste disposal practices and circular economy standards, which further proliferates their adoption.
By Raw Material
The water-based segment held the largest market share around 34% in 2023. Water-based adhesives consist predominantly of water as a solvent, providing an impressive reduction in the amount of toxic chemicals and volatile organic compounds (VOCs) that can create air pollution and extensive health issues. They are obviously high on the list for industries like packaging, auto, and construction where regulatory pressure to cut emissions and keep green appears ever-increasing. Furthermore, these types of adhesives provide high strength and versatility and are ideal for a broad range of applications such as bond paper, wood, and plastics. They are also typically lower in toxicity and easier to handle than their solvent based counterparts.
By End-Use Industry
The packaging segment held the largest market share around 42% in 2023. The global trend of environmental consciousness impacting the packaging industry. Manufacturers are gradually shifting towards sustainable materials and adhesives for several packaging applications, as consumer demands for greener products, particularly in the cosmetics industry, rise further. Water-based and recyclable adhesives help make packaging more sustainable by allowing easy recyclability and functionality, reducing garbage, and enhancing the overall sustainability of the packaging life cycle. Packaging is also a big contributor to global waste and waste reduction, and the circular economy initiatives tend to focus on this sector and regulatory policies regarding packaging are taking place. With this, companies from the food and beverage, cosmetics, and e-commerce sectors, among others, are seeking to fulfill these sustainability objectives and, as a result, sustainable packaging solutions are rapidly in demand.
Regional Analysis
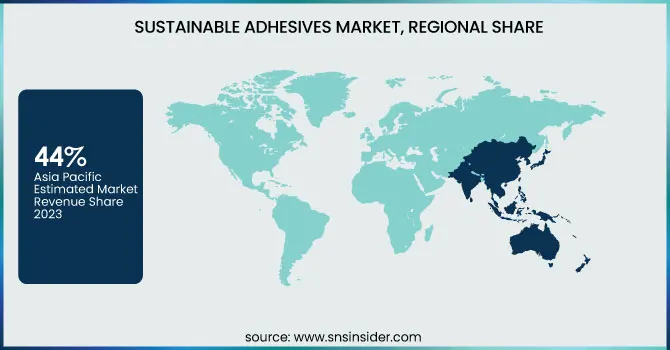
Asia Pacific held the largest market share around 44% in 2023. This is attributed to rapid industrialization, increase consumer awareness regarding sustainable development and a large volume of demand for sustainable products in construction, packaging and automotive. It constitutes the largest manufacturing centers in the globe, especially in industries such as automotive, electronics, packaging, and construction, which are being increasingly adopted by sustainable measures. Government regulations and policies to promote green initiatives, and manufacturing in countries such as China, Japan and India are propelling the demand for green materials and adhesives. Another factor has been the rise in middle-class consumers in some of those countries spurring demand for eco-friendly products, especially in packaging and consumer items. Additionally, Asia pacific has also become a major player in global adhesive supply chain, and presence of manufacture and supplier in the region has further made sustainable adhesive solution available at competitive price.
Key Players
Henkel AG & Co. KGaA (Loctite, Technomelt)
3M Company (Scotch-Weld, 3M VHB Tape)
BASF SE (MasterBond, Araldite)
Sika AG (Sikaflex, SikaBond)
H.B. Fuller Company (Fulbon, Advantra)
Arkema Group (Sustainable bio-based adhesives, Sartomer)
Solvay SA (Technomelt, Primal)
Eastman Chemical Company (Eastman Tritan, Eastman Renew)
Dow Chemical Company (DOWSIL, DOW Adhesives)
LORD Corporation (MasterBond, LORD 830)
Mitsui Chemicals, Inc. (Micropak, Bonding agents)
Adhesive Technologies (Tectonic, Momentive)
AkzoNobel N.V. (Flexbond, Resydrol)
Wacker Chemie AG (Elastosil, Wacker Adhesives)
Bostik (Bostik Supergrip, Bostik Hot Melt)
RPM International Inc. (Rust-Oleum, DAP)
Parker Hannifin Corporation (Paroflow, Parker H-Series)
Sonneborn (Sonneborn Rubber, Sonneborn Grease)
DIC Corporation (DIC Adhesive, Polytex)
Tesa SE (Tesa 4965, Tesa 51965)
Recent Development:
In March 2024, Henkel and Kraton Corporation joined together to promote sustainability in adhesives, with an emphasis on creating environmentally friendly products that satisfy the rising demand for sustainable goods in a range of sectors.
In May 2024, H.B. Fuller Company order to better serve a variety of industries, including automotive, electronics, and aerospace, announced the acquisition of ND Industries Inc., expanding their portfolio with specialty adhesives and fastener locking and sealing solutions.
Report Attributes | Details |
---|---|
Market Size in 2023 | USD 2.51 Billion |
Market Size by 2032 | USD 4.12 Billion |
CAGR | CAGR of5.66% From 2024 to 2032 |
Base Year | 2023 |
Forecast Period | 2024-2032 |
Historical Data | 2020-2022 |
Report Scope & Coverage | Market Size, Segments Analysis, Competitive Landscape, Regional Analysis, DROC & SWOT Analysis, Forecast Outlook |
Key Segments | • By Type (Renewable, Recyclable, Biodegradable, Green) • By Raw Material, (Water Based, Plant Based, EVA Based, Acrylic Based) • By End-Use Industry (Packaging, Woodworking, Construction, Medical) |
Regional Analysis/Coverage | North America (US, Canada, Mexico), Europe (Eastern Europe [Poland, Romania, Hungary, Turkey, Rest of Eastern Europe] Western Europe] Germany, France, UK, Italy, Spain, Netherlands, Switzerland, Austria, Rest of Western Europe]), Asia Pacific (China, India, Japan, South Korea, Vietnam, Singapore, Australia, Rest of Asia Pacific), Middle East & Africa (Middle East [UAE, Egypt, Saudi Arabia, Qatar, Rest of Middle East], Africa [Nigeria, South Africa, Rest of Africa], Latin America (Brazil, Argentina, Colombia, Rest of Latin America) |
Company Profiles | Henkel AG & Co. KGaA, 3M Company, BASF SE, Sika AG, H.B. Fuller Company, Arkema Group, Solvay SA, Eastman Chemical Company, Dow Chemical Company, LORD Corporation, Mitsui Chemicals, Inc., Adhesive Technologies, AkzoNobel N.V., Wacker Chemie AG, Bostik, RPM International Inc., Parker Hannifin Corporation, Sonneborn, DIC Corporation, Tesa SE |
Key Drivers | • Increasing demand from the automotive and construction sectors which drives the market growth. |
Restraints | •Higher cost associated with the production and formulation of eco-friendly adhesives may hamper the market growth. |
Ans: The Sustainable Adhesives Market was valued at USD 2.51 Billion in 2023.
Ans: The expected CAGR of the global Sustainable Adhesives Market during the forecast period is 5.66%.
Ans: The packaging will grow rapidly in the Sustainable Adhesives Market from 2024-2032.
Ans: Increasing demand from the automotive and construction sectors which drives the market growth.
Ans: Asia Pacific led the Sustainable Adhesives Market in the region with the highest revenue share in 2023.
Table of Contents
1. Introduction
1.1 Market Definition
1.2 Scope (Inclusion and Exclusions)
1.3 Research Assumptions
2. Executive Summary
2.1 Market Overview
2.2 Regional Synopsis
2.3 Competitive Summary
3. Research Methodology
3.1 Top-Down Approach
3.2 Bottom-up Approach
3.3. Data Validation
3.4 Primary Interviews
4. Market Dynamics Impact Analysis
4.1 Market Driving Factors Analysis
4.1.1 Drivers
4.1.2 Restraints
4.1.3 Opportunities
4.1.4 Challenges
4.2 PESTLE Analysis
4.3 Porter’s Five Forces Model
5. Statistical Insights and Trends Reporting
5.1 By Raw Materialion Capacity and Utilization, by Country, By Type, 2023
5.2 Feedstock Prices, by Country, By Type, 2023
5.3 Regulatory Impact, by l Country, By Type, 2023.
5.4 Environmental Metrics: Emissions Data, Waste Management Practices, and Sustainability Initiatives, by Region
5.5 Innovation and R&D, Type, 2023
6. Competitive Landscape
6.1 List of Major Companies, By Region
6.2 Market Share Analysis, By Region
6.3 Product Benchmarking
6.3.1 Product specifications and features
6.3.2 Pricing
6.4 Strategic Initiatives
6.4.1 Marketing and promotional activities
6.4.2 Distribution and Supply Chain Strategies
6.4.3 Expansion plans and new Product launches
6.4.4 Strategic partnerships and collaborations
6.5 Technological Advancements
6.6 Market Positioning and Branding
7. Sustainable Adhesives Market Segmentation, by Type
7.1 Chapter Overview
7.2 Renewable
7.2.1 Renewable Market Trends Analysis (2020-2032)
7.2.2 Renewable Market Size Estimates and Forecasts to 2032 (USD Billion)
7.3 Recyclable
7.3.1 Recyclable Market Trends Analysis (2020-2032)
7.3.2 Recyclable Market Size Estimates and Forecasts to 2032 (USD Billion)
7.4 Biodegradable
7.4.1 Biodegradable Market Trends Analysis (2020-2032)
7.4.2 Biodegradable Market Size Estimates and Forecasts to 2032 (USD Billion)
7.5 Green
7.5.1 Green Market Trends Analysis (2020-2032)
7.5.2 Green Market Size Estimates and Forecasts to 2032 (USD Billion)
8. Sustainable Adhesives Market Segmentation, by Raw Material
8.1 Chapter Overview
8.2 Water Based
8.2.1 Water Based Market Trends Analysis (2020-2032)
8.2.2 Water Based Market Size Estimates and Forecasts to 2032 (USD Billion)
8.3 Plant Based
8.3.1 Plant Based Market Trends Analysis (2020-2032)
8.3.2 Plant Based Market Size Estimates and Forecasts to 2032 (USD Billion)
8.4 EVA Based
8.4.1 EVA Based Market Trends Analysis (2020-2032)
8.4.2 EVA Based Market Size Estimates and Forecasts to 2032 (USD Billion)
8.5 Acrylic Based
8.5.1 Acrylic Based Market Trends Analysis (2020-2032)
8.5.2 Acrylic Based Market Size Estimates and Forecasts to 2032 (USD Billion)
9. Sustainable Adhesives Market Segmentation, by End-Use Industry
9.1 Chapter Overview
9.2 Packaging
9.2.1 Packaging Market Trends Analysis (2020-2032)
9.2.2 Packaging Market Size Estimates and Forecasts to 2032 (USD Billion)
9.3 Woodworking
9.3.1 Woodworking Market Trends Analysis (2020-2032)
9.3.2 Woodworking Market Size Estimates and Forecasts to 2032 (USD Billion)
9.4 Construction
9.4.1 Construction Market Trends Analysis (2020-2032)
9.4.2 Construction Market Size Estimates and Forecasts to 2032 (USD Billion)
9.5 Medical
9.5.1 Medical Market Trends Analysis (2020-2032)
9.5.2 Medical Market Size Estimates and Forecasts to 2032 (USD Billion)
10. Regional Analysis
10.1 Chapter Overview
10.2 North America
10.2.1 Trends Analysis
10.2.2 North America Sustainable Adhesives Market Estimates and Forecasts, by Country (2020-2032) (USD Billion)
10.2.3 North America Sustainable Adhesives Market Estimates and Forecasts, by Type (2020-2032) (USD Billion)
10.2.4 North America Sustainable Adhesives Market Estimates and Forecasts, by Raw Material (2020-2032) (USD Billion)
10.2.5 North America Sustainable Adhesives Market Estimates and Forecasts, by End-Use Industry (2020-2032) (USD Billion)
10.2.6 USA
10.2.6.1 USA Sustainable Adhesives Market Estimates and Forecasts, by Type (2020-2032) (USD Billion)
10.2.6.2 USA Sustainable Adhesives Market Estimates and Forecasts, by Raw Material (2020-2032) (USD Billion)
10.2.6.3 USA Sustainable Adhesives Market Estimates and Forecasts, by End-Use Industry (2020-2032) (USD Billion)
10.2.7 Canada
10.2.7.1 Canada Sustainable Adhesives Market Estimates and Forecasts, by Type (2020-2032) (USD Billion)
10.2.7.2 Canada Sustainable Adhesives Market Estimates and Forecasts, by Raw Material (2020-2032) (USD Billion)
10.2.7.3 Canada Sustainable Adhesives Market Estimates and Forecasts, by End-Use Industry (2020-2032) (USD Billion)
10.2.8 Mexico
10.2.8.1 Mexico Sustainable Adhesives Market Estimates and Forecasts, by Type (2020-2032) (USD Billion)
10.2.8.2 Mexico Sustainable Adhesives Market Estimates and Forecasts, by Raw Material (2020-2032) (USD Billion)
10.2.8.3 Mexico Sustainable Adhesives Market Estimates and Forecasts, by End-Use Industry (2020-2032) (USD Billion)
10.3 Europe
10.3.1 Eastern Europe
10.3.1.1 Trends Analysis
10.3.1.2 Eastern Europe Sustainable Adhesives Market Estimates and Forecasts, by Country (2020-2032) (USD Billion)
10.3.1.3 Eastern Europe Sustainable Adhesives Market Estimates and Forecasts, by Type (2020-2032) (USD Billion)
10.3.1.4 Eastern Europe Sustainable Adhesives Market Estimates and Forecasts, by Raw Material (2020-2032) (USD Billion)
10.3.1.5 Eastern Europe Sustainable Adhesives Market Estimates and Forecasts, by End-Use Industry (2020-2032) (USD Billion)
10.3.1.6 Poland
10.3.1.6.1 Poland Sustainable Adhesives Market Estimates and Forecasts, by Type (2020-2032) (USD Billion)
10.3.1.6.2 Poland Sustainable Adhesives Market Estimates and Forecasts, by Raw Material (2020-2032) (USD Billion)
10.3.1.6.3 Poland Sustainable Adhesives Market Estimates and Forecasts, by End-Use Industry (2020-2032) (USD Billion)
10.3.1.7 Romania
10.3.1.7.1 Romania Sustainable Adhesives Market Estimates and Forecasts, by Type (2020-2032) (USD Billion)
10.3.1.7.2 Romania Sustainable Adhesives Market Estimates and Forecasts, by Raw Material (2020-2032) (USD Billion)
10.3.1.7.3 Romania Sustainable Adhesives Market Estimates and Forecasts, by End-Use Industry (2020-2032) (USD Billion)
10.3.1.8 Hungary
10.3.1.8.1 Hungary Sustainable Adhesives Market Estimates and Forecasts, by Type (2020-2032) (USD Billion)
10.3.1.8.2 Hungary Sustainable Adhesives Market Estimates and Forecasts, by Raw Material (2020-2032) (USD Billion)
10.3.1.8.3 Hungary Sustainable Adhesives Market Estimates and Forecasts, by End-Use Industry (2020-2032) (USD Billion)
10.3.1.9 Turkey
10.3.1.9.1 Turkey Sustainable Adhesives Market Estimates and Forecasts, by Type (2020-2032) (USD Billion)
10.3.1.9.2 Turkey Sustainable Adhesives Market Estimates and Forecasts, by Raw Material (2020-2032) (USD Billion)
10.3.1.9.3 Turkey Sustainable Adhesives Market Estimates and Forecasts, by End-Use Industry (2020-2032) (USD Billion)
10.3.1.10 Rest of Eastern Europe
10.3.1.10.1 Rest of Eastern Europe Sustainable Adhesives Market Estimates and Forecasts, by Type (2020-2032) (USD Billion)
10.3.1.10.2 Rest of Eastern Europe Sustainable Adhesives Market Estimates and Forecasts, by Raw Material (2020-2032) (USD Billion)
10.3.1.10.3 Rest of Eastern Europe Sustainable Adhesives Market Estimates and Forecasts, by End-Use Industry (2020-2032) (USD Billion)
10.3.2 Western Europe
10.3.2.1 Trends Analysis
10.3.2.2 Western Europe Sustainable Adhesives Market Estimates and Forecasts, by Country (2020-2032) (USD Billion)
10.3.2.3 Western Europe Sustainable Adhesives Market Estimates and Forecasts, by Type (2020-2032) (USD Billion)
10.3.2.4 Western Europe Sustainable Adhesives Market Estimates and Forecasts, by Raw Material (2020-2032) (USD Billion)
10.3.2.5 Western Europe Sustainable Adhesives Market Estimates and Forecasts, by End-Use Industry (2020-2032) (USD Billion)
10.3.2.6 Germany
10.3.2.6.1 Germany Sustainable Adhesives Market Estimates and Forecasts, by Type (2020-2032) (USD Billion)
10.3.2.6.2 Germany Sustainable Adhesives Market Estimates and Forecasts, by Raw Material (2020-2032) (USD Billion)
10.3.2.6.3 Germany Sustainable Adhesives Market Estimates and Forecasts, by End-Use Industry (2020-2032) (USD Billion)
10.3.2.7 France
10.3.2.7.1 France Sustainable Adhesives Market Estimates and Forecasts, by Type (2020-2032) (USD Billion)
10.3.2.7.2 France Sustainable Adhesives Market Estimates and Forecasts, by Raw Material (2020-2032) (USD Billion)
10.3.2.7.3 France Sustainable Adhesives Market Estimates and Forecasts, by End-Use Industry (2020-2032) (USD Billion)
10.3.2.8 UK
10.3.2.8.1 UK Sustainable Adhesives Market Estimates and Forecasts, by Type (2020-2032) (USD Billion)
10.3.2.8.2 UK Sustainable Adhesives Market Estimates and Forecasts, by Raw Material (2020-2032) (USD Billion)
10.3.2.8.3 UK Sustainable Adhesives Market Estimates and Forecasts, by End-Use Industry (2020-2032) (USD Billion)
10.3.2.9 Italy
10.3.2.9.1 Italy Sustainable Adhesives Market Estimates and Forecasts, by Type (2020-2032) (USD Billion)
10.3.2.9.2 Italy Sustainable Adhesives Market Estimates and Forecasts, by Raw Material (2020-2032) (USD Billion)
10.3.2.9.3 Italy Sustainable Adhesives Market Estimates and Forecasts, by End-Use Industry (2020-2032) (USD Billion)
10.3.2.10 Spain
10.3.2.10.1 Spain Sustainable Adhesives Market Estimates and Forecasts, by Type (2020-2032) (USD Billion)
10.3.2.10.2 Spain Sustainable Adhesives Market Estimates and Forecasts, by Raw Material (2020-2032) (USD Billion)
10.3.2.10.3 Spain Sustainable Adhesives Market Estimates and Forecasts, by End-Use Industry (2020-2032) (USD Billion)
10.3.2.11 Netherlands
10.3.2.11.1 Netherlands Sustainable Adhesives Market Estimates and Forecasts, by Type (2020-2032) (USD Billion)
10.3.2.11.2 Netherlands Sustainable Adhesives Market Estimates and Forecasts, by Raw Material (2020-2032) (USD Billion)
10.3.2.11.3 Netherlands Sustainable Adhesives Market Estimates and Forecasts, by End-Use Industry (2020-2032) (USD Billion)
10.3.2.12 Switzerland
10.3.2.12.1 Switzerland Sustainable Adhesives Market Estimates and Forecasts, by Type (2020-2032) (USD Billion)
10.3.2.12.2 Switzerland Sustainable Adhesives Market Estimates and Forecasts, by Raw Material (2020-2032) (USD Billion)
10.3.2.12.3 Switzerland Sustainable Adhesives Market Estimates and Forecasts, by End-Use Industry (2020-2032) (USD Billion)
10.3.2.13 Austria
10.3.2.13.1 Austria Sustainable Adhesives Market Estimates and Forecasts, by Type (2020-2032) (USD Billion)
10.3.2.13.2 Austria Sustainable Adhesives Market Estimates and Forecasts, by Raw Material (2020-2032) (USD Billion)
10.3.2.13.3 Austria Sustainable Adhesives Market Estimates and Forecasts, by End-Use Industry (2020-2032) (USD Billion)
10.3.2.14 Rest of Western Europe
10.3.2.14.1 Rest of Western Europe Sustainable Adhesives Market Estimates and Forecasts, by Type (2020-2032) (USD Billion)
10.3.2.14.2 Rest of Western Europe Sustainable Adhesives Market Estimates and Forecasts, by Raw Material (2020-2032) (USD Billion)
10.3.2.14.3 Rest of Western Europe Sustainable Adhesives Market Estimates and Forecasts, by End-Use Industry (2020-2032) (USD Billion)
10.4 Asia Pacific
10.4.1 Trends Analysis
10.4.2 Asia Pacific Sustainable Adhesives Market Estimates and Forecasts, by Country (2020-2032) (USD Billion)
10.4.3 Asia Pacific Sustainable Adhesives Market Estimates and Forecasts, by Type (2020-2032) (USD Billion)
10.4.4 Asia Pacific Sustainable Adhesives Market Estimates and Forecasts, by Raw Material (2020-2032) (USD Billion)
10.4.5 Asia Pacific Sustainable Adhesives Market Estimates and Forecasts, by End-Use Industry (2020-2032) (USD Billion)
10.4.6 China
10.4.6.1 China Sustainable Adhesives Market Estimates and Forecasts, by Type (2020-2032) (USD Billion)
10.4.6.2 China Sustainable Adhesives Market Estimates and Forecasts, by Raw Material (2020-2032) (USD Billion)
10.4.6.3 China Sustainable Adhesives Market Estimates and Forecasts, by End-Use Industry (2020-2032) (USD Billion)
10.4.7 India
10.4.7.1 India Sustainable Adhesives Market Estimates and Forecasts, by Type (2020-2032) (USD Billion)
10.4.7.2 India Sustainable Adhesives Market Estimates and Forecasts, by Raw Material (2020-2032) (USD Billion)
10.4.7.3 India Sustainable Adhesives Market Estimates and Forecasts, by End-Use Industry (2020-2032) (USD Billion)
10.4.8 Japan
10.4.8.1 Japan Sustainable Adhesives Market Estimates and Forecasts, by Type (2020-2032) (USD Billion)
10.4.8.2 Japan Sustainable Adhesives Market Estimates and Forecasts, by Raw Material (2020-2032) (USD Billion)
10.4.8.3 Japan Sustainable Adhesives Market Estimates and Forecasts, by End-Use Industry (2020-2032) (USD Billion)
10.4.9 South Korea
10.4.9.1 South Korea Sustainable Adhesives Market Estimates and Forecasts, by Type (2020-2032) (USD Billion)
10.4.9.2 South Korea Sustainable Adhesives Market Estimates and Forecasts, by Raw Material (2020-2032) (USD Billion)
10.4.9.3 South Korea Sustainable Adhesives Market Estimates and Forecasts, by End-Use Industry (2020-2032) (USD Billion)
10.4.10 Vietnam
10.4.10.1 Vietnam Sustainable Adhesives Market Estimates and Forecasts, by Type (2020-2032) (USD Billion)
10.4.10.2 Vietnam Sustainable Adhesives Market Estimates and Forecasts, by Raw Material (2020-2032) (USD Billion)
10.4.10.3 Vietnam Sustainable Adhesives Market Estimates and Forecasts, by End-Use Industry (2020-2032) (USD Billion)
10.4.11 Singapore
10.4.11.1 Singapore Sustainable Adhesives Market Estimates and Forecasts, by Type (2020-2032) (USD Billion)
10.4.11.2 Singapore Sustainable Adhesives Market Estimates and Forecasts, by Raw Material (2020-2032) (USD Billion)
10.4.11.3 Singapore Sustainable Adhesives Market Estimates and Forecasts, by End-Use Industry (2020-2032) (USD Billion)
10.4.12 Australia
10.4.12.1 Australia Sustainable Adhesives Market Estimates and Forecasts, by Type (2020-2032) (USD Billion)
10.4.12.2 Australia Sustainable Adhesives Market Estimates and Forecasts, by Raw Material (2020-2032) (USD Billion)
10.4.12.3 Australia Sustainable Adhesives Market Estimates and Forecasts, by End-Use Industry (2020-2032) (USD Billion)
10.4.13 Rest of Asia Pacific
10.4.13.1 Rest of Asia Pacific Sustainable Adhesives Market Estimates and Forecasts, by Type (2020-2032) (USD Billion)
10.4.13.2 Rest of Asia Pacific Sustainable Adhesives Market Estimates and Forecasts, by Raw Material (2020-2032) (USD Billion)
10.4.13.3 Rest of Asia Pacific Sustainable Adhesives Market Estimates and Forecasts, by End-Use Industry (2020-2032) (USD Billion)
10.5 Middle East and Africa
10.5.1 Middle East
10.5.1.1 Trends Analysis
10.5.1.2 Middle East Sustainable Adhesives Market Estimates and Forecasts, by Country (2020-2032) (USD Billion)
10.5.1.3 Middle East Sustainable Adhesives Market Estimates and Forecasts, by Type (2020-2032) (USD Billion)
10.5.1.4 Middle East Sustainable Adhesives Market Estimates and Forecasts, by Raw Material (2020-2032) (USD Billion)
10.5.1.5 Middle East Sustainable Adhesives Market Estimates and Forecasts, by End-Use Industry (2020-2032) (USD Billion)
10.5.1.6 UAE
10.5.1.6.1 UAE Sustainable Adhesives Market Estimates and Forecasts, by Type (2020-2032) (USD Billion)
10.5.1.6.2 UAE Sustainable Adhesives Market Estimates and Forecasts, by Raw Material (2020-2032) (USD Billion)
10.5.1.6.3 UAE Sustainable Adhesives Market Estimates and Forecasts, by End-Use Industry (2020-2032) (USD Billion)
10.5.1.7 Egypt
10.5.1.7.1 Egypt Sustainable Adhesives Market Estimates and Forecasts, by Type (2020-2032) (USD Billion)
10.5.1.7.2 Egypt Sustainable Adhesives Market Estimates and Forecasts, by Raw Material (2020-2032) (USD Billion)
10.5.1.7.3 Egypt Sustainable Adhesives Market Estimates and Forecasts, by End-Use Industry (2020-2032) (USD Billion)
10.5.1.8 Saudi Arabia
10.5.1.8.1 Saudi Arabia Sustainable Adhesives Market Estimates and Forecasts, by Type (2020-2032) (USD Billion)
10.5.1.8.2 Saudi Arabia Sustainable Adhesives Market Estimates and Forecasts, by Raw Material (2020-2032) (USD Billion)
10.5.1.8.3 Saudi Arabia Sustainable Adhesives Market Estimates and Forecasts, by End-Use Industry (2020-2032) (USD Billion)
10.5.1.9 Qatar
10.5.1.9.1 Qatar Sustainable Adhesives Market Estimates and Forecasts, by Type (2020-2032) (USD Billion)
10.5.1.9.2 Qatar Sustainable Adhesives Market Estimates and Forecasts, by Raw Material (2020-2032) (USD Billion)
10.5.1.9.3 Qatar Sustainable Adhesives Market Estimates and Forecasts, by End-Use Industry (2020-2032) (USD Billion)
10.5.1.10 Rest of Middle East
10.5.1.10.1 Rest of Middle East Sustainable Adhesives Market Estimates and Forecasts, by Type (2020-2032) (USD Billion)
10.5.1.10.2 Rest of Middle East Sustainable Adhesives Market Estimates and Forecasts, by Raw Material (2020-2032) (USD Billion)
10.5.1.10.3 Rest of Middle East Sustainable Adhesives Market Estimates and Forecasts, by End-Use Industry (2020-2032) (USD Billion)
10.5.2 Africa
10.5.2.1 Trends Analysis
10.5.2.2 Africa Sustainable Adhesives Market Estimates and Forecasts, by Country (2020-2032) (USD Billion)
10.5.2.3 Africa Sustainable Adhesives Market Estimates and Forecasts, by Type (2020-2032) (USD Billion)
10.5.2.4 Africa Sustainable Adhesives Market Estimates and Forecasts, by Raw Material (2020-2032) (USD Billion)
10.5.2.5 Africa Sustainable Adhesives Market Estimates and Forecasts, by End-Use Industry (2020-2032) (USD Billion)
10.5.2.6 South Africa
10.5.2.6.1 South Africa Sustainable Adhesives Market Estimates and Forecasts, by Type (2020-2032) (USD Billion)
10.5.2.6.2 South Africa Sustainable Adhesives Market Estimates and Forecasts, by Raw Material (2020-2032) (USD Billion)
10.5.2.6.3 South Africa Sustainable Adhesives Market Estimates and Forecasts, by End-Use Industry (2020-2032) (USD Billion)
10.5.2.7 Nigeria
10.5.2.7.1 Nigeria Sustainable Adhesives Market Estimates and Forecasts, by Type (2020-2032) (USD Billion)
10.5.2.7.2 Nigeria Sustainable Adhesives Market Estimates and Forecasts, by Raw Material (2020-2032) (USD Billion)
10.5.2.7.3 Nigeria Sustainable Adhesives Market Estimates and Forecasts, by End-Use Industry (2020-2032) (USD Billion)
10.5.2.8 Rest of Africa
10.5.2.8.1 Rest of Africa Sustainable Adhesives Market Estimates and Forecasts, by Type (2020-2032) (USD Billion)
10.5.2.8.2 Rest of Africa Sustainable Adhesives Market Estimates and Forecasts, by Raw Material (2020-2032) (USD Billion)
10.5.2.8.3 Rest of Africa Sustainable Adhesives Market Estimates and Forecasts, by End-Use Industry (2020-2032) (USD Billion)
10.6 Latin America
10.6.1 Trends Analysis
10.6.2 Latin America Sustainable Adhesives Market Estimates and Forecasts, by Country (2020-2032) (USD Billion)
10.6.3 Latin America Sustainable Adhesives Market Estimates and Forecasts, by Type (2020-2032) (USD Billion)
10.6.4 Latin America Sustainable Adhesives Market Estimates and Forecasts, by Raw Material (2020-2032) (USD Billion)
10.6.5 Latin America Sustainable Adhesives Market Estimates and Forecasts, by End-Use Industry (2020-2032) (USD Billion)
10.6.6 Brazil
10.6.6.1 Brazil Sustainable Adhesives Market Estimates and Forecasts, by Type (2020-2032) (USD Billion)
10.6.6.2 Brazil Sustainable Adhesives Market Estimates and Forecasts, by Raw Material (2020-2032) (USD Billion)
10.6.6.3 Brazil Sustainable Adhesives Market Estimates and Forecasts, by End-Use Industry (2020-2032) (USD Billion)
10.6.7 Argentina
10.6.7.1 Argentina Sustainable Adhesives Market Estimates and Forecasts, by Type (2020-2032) (USD Billion)
10.6.7.2 Argentina Sustainable Adhesives Market Estimates and Forecasts, by Raw Material (2020-2032) (USD Billion)
10.6.7.3 Argentina Sustainable Adhesives Market Estimates and Forecasts, by End-Use Industry (2020-2032) (USD Billion)
10.6.8 Colombia
10.6.8.1 Colombia Sustainable Adhesives Market Estimates and Forecasts, by Type (2020-2032) (USD Billion)
10.6.8.2 Colombia Sustainable Adhesives Market Estimates and Forecasts, by Raw Material (2020-2032) (USD Billion)
10.6.8.3 Colombia Sustainable Adhesives Market Estimates and Forecasts, by End-Use Industry (2020-2032) (USD Billion)
10.6.9 Rest of Latin America
10.6.9.1 Rest of Latin America Sustainable Adhesives Market Estimates and Forecasts, by Type (2020-2032) (USD Billion)
10.6.9.2 Rest of Latin America Sustainable Adhesives Market Estimates and Forecasts, by Raw Material (2020-2032) (USD Billion)
10.6.9.3 Rest of Latin America Sustainable Adhesives Market Estimates and Forecasts, by End-Use Industry (2020-2032) (USD Billion)
11. Company Profiles
11.1 Henkel AG & Co. KGaA
11.1.1 Company Overview
11.1.2 Financial
11.1.3 Product/ Services Offered
11.1.4 SWOT Analysis
11.2 3M Company
11.2.1 Company Overview
11.2.2 Financial
11.2.3 Product/ Services Offered
11.2.4 SWOT Analysis
11.3 BASF SE
11.3.1 Company Overview
11.3.2 Financial
11.3.3 Product/ Services Offered
11.3.4 SWOT Analysis
11.4 Sika AG
11.4.1 Company Overview
11.4.2 Financial
11.4.3 Product/ Services Offered
11.4.4 SWOT Analysis
11.5 H.B. Fuller Company
11.5.1 Company Overview
11.5.2 Financial
11.5.3 Product/ Services Offered
11.5.4 SWOT Analysis
11.6 Arkema Group
11.6.1 Company Overview
11.6.2 Financial
11.6.3 Product/ Services Offered
11.6.4 SWOT Analysis
11.7 Solvay SA
11.7.1 Company Overview
11.7.2 Financial
11.7.3 Product/ Services Offered
11.7.4 SWOT Analysis
11.8 Eastman Chemical Company
11.8.1 Company Overview
11.8.2 Financial
11.8.3 Product/ Services Offered
11.8.4 SWOT Analysis
11.9 Dow Chemical Company
11.9.1 Company Overview
11.9.2 Financial
11.9.3 Product/ Services Offered
11.9.4 SWOT Analysis
11.10 LORD Corporation
11.10.1 Company Overview
11.10.2 Financial
11.10.3 Product/ Services Offered
11.10.4 SWOT Analysis
12. Use Cases and Best Practices
13. Conclusion
An accurate research report requires proper strategizing as well as implementation. There are multiple factors involved in the completion of good and accurate research report and selecting the best methodology to compete the research is the toughest part. Since the research reports we provide play a crucial role in any company’s decision-making process, therefore we at SNS Insider always believe that we should choose the best method which gives us results closer to reality. This allows us to reach at a stage wherein we can provide our clients best and accurate investment to output ratio.
Each report that we prepare takes a timeframe of 350-400 business hours for production. Starting from the selection of titles through a couple of in-depth brain storming session to the final QC process before uploading our titles on our website we dedicate around 350 working hours. The titles are selected based on their current market cap and the foreseen CAGR and growth.
The 5 steps process:
Step 1: Secondary Research:
Secondary Research or Desk Research is as the name suggests is a research process wherein, we collect data through the readily available information. In this process we use various paid and unpaid databases which our team has access to and gather data through the same. This includes examining of listed companies’ annual reports, Journals, SEC filling etc. Apart from this our team has access to various associations across the globe across different industries. Lastly, we have exchange relationships with various university as well as individual libraries.
Step 2: Primary Research
When we talk about primary research, it is a type of study in which the researchers collect relevant data samples directly, rather than relying on previously collected data. This type of research is focused on gaining content specific facts that can be sued to solve specific problems. Since the collected data is fresh and first hand therefore it makes the study more accurate and genuine.
We at SNS Insider have divided Primary Research into 2 parts.
Part 1 wherein we interview the KOLs of major players as well as the upcoming ones across various geographic regions. This allows us to have their view over the market scenario and acts as an important tool to come closer to the accurate market numbers. As many as 45 paid and unpaid primary interviews are taken from both the demand and supply side of the industry to make sure we land at an accurate judgement and analysis of the market.
This step involves the triangulation of data wherein our team analyses the interview transcripts, online survey responses and observation of on filed participants. The below mentioned chart should give a better understanding of the part 1 of the primary interview.
Part 2: In this part of primary research the data collected via secondary research and the part 1 of the primary research is validated with the interviews from individual consultants and subject matter experts.
Consultants are those set of people who have at least 12 years of experience and expertise within the industry whereas Subject Matter Experts are those with at least 15 years of experience behind their back within the same space. The data with the help of two main processes i.e., FGDs (Focused Group Discussions) and IDs (Individual Discussions). This gives us a 3rd party nonbiased primary view of the market scenario making it a more dependable one while collation of the data pointers.
Step 3: Data Bank Validation
Once all the information is collected via primary and secondary sources, we run that information for data validation. At our intelligence centre our research heads track a lot of information related to the market which includes the quarterly reports, the daily stock prices, and other relevant information. Our data bank server gets updated every fortnight and that is how the information which we collected using our primary and secondary information is revalidated in real time.
Step 4: QA/QC Process
After all the data collection and validation our team does a final level of quality check and quality assurance to get rid of any unwanted or undesired mistakes. This might include but not limited to getting rid of the any typos, duplication of numbers or missing of any important information. The people involved in this process include technical content writers, research heads and graphics people. Once this process is completed the title gets uploader on our platform for our clients to read it.
Step 5: Final QC/QA Process:
This is the last process and comes when the client has ordered the study. In this process a final QA/QC is done before the study is emailed to the client. Since we believe in giving our clients a good experience of our research studies, therefore, to make sure that we do not lack at our end in any way humanly possible we do a final round of quality check and then dispatch the study to the client.
Key Segments:
By Type
Renewable
Recyclable
Biodegradable
Green
By Raw Material
Water Based
Plant Based
EVA Based
Acrylic Based
By End Use Industry
Packaging
Woodworking
Construction
Medical
Request for Segment Customization as per your Business Requirement: Segment Customization Request
Regional Coverage:
North America
US
Canada
Mexico
Europe
Eastern Europe
Poland
Romania
Hungary
Turkey
Rest of Eastern Europe
Western Europe
Germany
France
UK
Italy
Spain
Netherlands
Switzerland
Austria
Rest of Western Europe
Asia Pacific
China
India
Japan
South Korea
Vietnam
Singapore
Australia
Rest of Asia Pacific
Middle East & Africa
Middle East
UAE
Egypt
Saudi Arabia
Qatar
Rest of Middle East
Africa
Nigeria
South Africa
Rest of Africa
Latin America
Brazil
Argentina
Colombia
Rest of Latin America
Request for Country Level Research Report: Country Level Customization Request
Available Customization
With the given market data, SNS Insider offers customization as per the company’s specific needs. The following customization options are available for the report:
Product Analysis
Criss-Cross segment analysis (e.g. Product X Application)
Product Matrix which gives a detailed comparison of the product portfolio of each company
Geographic Analysis
Additional countries in any of the regions
Company Information
Detailed analysis and profiling of additional market players (Up to five)
Antimicrobial Preservatives Market size was USD 3.1 Billion in 2023 and is projected to reach USD 4.6 Billion by 2032, at a CAGR of 4.5% from 2024 to 2032.
The Atmospheric water generator Market size was USD 2.58 billion in 2023 and is expected to Reach USD 7.21 billion by 2032 and grow at a CAGR of 12.09% over the forecast period of 2024-2032.
The Rodenticides market size was valued at USD 5.52 billion in 2023 and is expected to reach USD 9.10 billion by 2032, growing at a CAGR of 5.72% over the forecast period of 2024-2032.
The Cashew Nutshell Liquid Market size was valued at USD 431.33 million in 2023 and is expected to reach USD 821.26 million by 2032, growing at a CAGR of 7.42% over the forecast period of 2024-2032.
Fluoropolymers Market size was estimated at USD 9.66 billion in 2023 and is expected to reach USD 16.20 billion by 2032 at a CAGR of 5.91% from 2024-2032.
Frankincense Oil Market was valued at USD 253.0 Million in 2023 and is expected to reach USD 479.3 Million by 2032, growing at a CAGR of 7.4% from 2024 to 2032.
Hi! Click one of our member below to chat on Phone