Co-Packaged Optics Market Report Scope & Overview
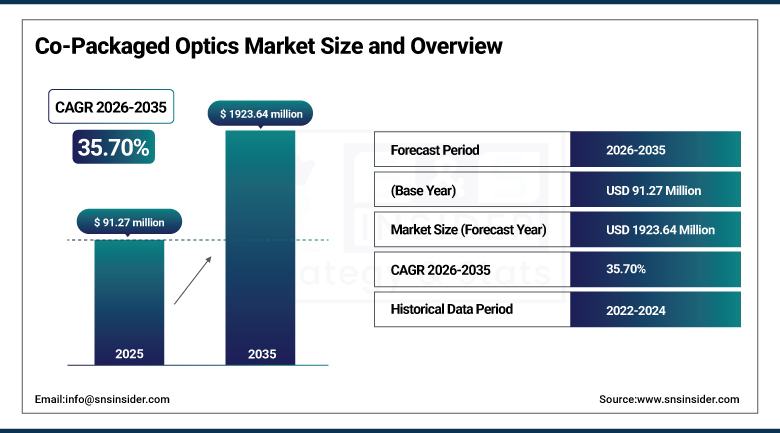
The Co-Packaged Optics Market Size was valued at USD 91.27 million in 2025 and is expected to reach USD 1,923.64 million by 2035, growing at a CAGR of 35.70% from 2026–2035.
The global co-packaged optics market stands at the frontier of one of the most consequential architectural transitions in data centre and high-performance computing infrastructure design, as the exponential growth of AI training and inference workloads is creating bandwidth and power consumption demands that the established pluggable optical transceiver paradigm is approaching its physical limits to serve efficiently. Co-packaged optics, which integrate optical engines directly alongside switching ASICs or processor dies within a single package rather than attaching them externally through the copper backplane and cage connector interfaces that pluggable transceivers require, addresses the interconnect bottleneck by dramatically reducing the electrical signal path between switch logic and optical conversion, cutting power consumption per bit transmitted by 30 to 50% relative to pluggable transceiver solutions, and enabling the bandwidth density scaling that AI cluster networking at the scale of hundreds of thousands of GPU nodes demands. The urgency of the CPO opportunity is defined by the arithmetic of AI infrastructure growth: training foundation models at the scale of GPT-5 and beyond requires network fabrics that can move exabytes of data between GPU accelerators per day at latencies measured in microseconds, and the thermal density, power consumption, and bandwidth density limits of pluggable transceiver technology are creating hard constraints on AI cluster scale that CPO’s architectural advantages are uniquely positioned to resolve.
Broadcom’s May 2025 third-generation CPO technology announcement supporting 200G per lane data rate, paired with Corning’s collaboration on CPO optical component supply for the Bailly switch and Broadcom’s OFC 2025 ecosystem readiness demonstration with improved thermal management prototypes and OSAT process enhancements, represents the commercial ecosystem crystallisation milestone that hyperscale data centre procurement commitments require before volume CPO switch deployment can begin in earnest.
Market Size and Forecast
-
Market Size In 2026E: USD 123.26 Million
-
Market Size By 2035: USD 1,923.64 million
-
CAGR: 35.70% From 2026 To 2035
-
Fastest Growing Region: North America
-
Largest Region: Asia Pacific
To Get more information on Co-Packaged Optics Market - Request Free Sample Report
Co-Packaged Optics Market Trends
-
Rising adoption of silicon photonics is improving scalability, CMOS compatibility, and cost efficiency in CPO manufacturing.
-
Growing wafer-scale integration is enabling direct co-packaging of optical transceivers with switching ASICs for higher power efficiency.
-
Increasing investments in advanced thermal management and liquid cooling solutions are supporting next-generation CPO deployments.
-
Expanding industry standardization initiatives are improving interoperability and multi-vendor adoption in data center environments.
-
CPO technology is increasingly being adopted in AI accelerators, HPC systems, and quantum computing applications for high-bandwidth, low-latency connectivity.
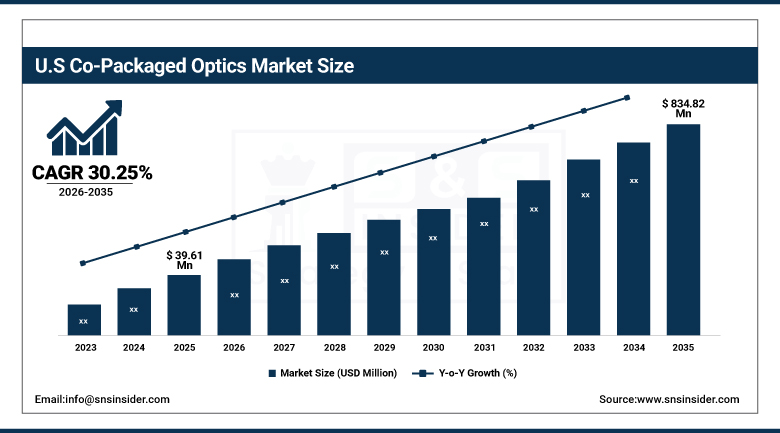
U.S. Co-Packaged Optics Market Size Outlook:
The U.S. co-packaged optics market was valued at approximately USD 39.61 million in 2025 and is expected to reach approximately USD 834.82 million by 2035, growing at a CAGR of 30.25%. The U.S. co-packaged optics market is positioned to be one of the fastest-growing components of the North American hyperscale data centre infrastructure supply chain, driven by the extraordinary concentration of hyperscale AI infrastructure investment in U.S. data centre campuses operated by AWS, Microsoft Azure, Google Cloud, Meta, and Oracle whose combined AI infrastructure capital expenditure is measured in hundreds of billions of dollars annually and whose network fabric upgrade requirements from pluggable to CPO-based switching represent the most commercially significant near-term procurement pipeline in the global optical networking equipment market.
The United States CPO market benefits from the concentration of the world’s leading CPO technology developers including Broadcom, Marvell Technology, Intel, and Ayar Labs whose R&D centres and initial product commercialisation activities are based primarily in U.S. facilities, combined with the geographic proximity of Silicon Valley’s semiconductor design ecosystem and the hyperscale cloud operator campuses whose early adopter procurement decisions will define the CPO market’s commercial trajectory globally. The U.S. government’s interest in CPO technology extends beyond commercial data centres to include defense and intelligence community HPC applications where the power efficiency, bandwidth density, and size weight and power advantages of CPO-based fabric are particularly compelling for aircraft, shipboard, and ground vehicle computing systems.
NVIDIA’s ecosystem development toward silicon photonics and co-packaged optics integration in next-generation AI switches targeting large GPU clusters, and the August 2025 acceleration of these developments by the wider NVIDIA ecosystem, represents the most commercially consequential CPO adoption signal in the global market given NVIDIA’s dominant position in AI accelerator supply and the company’s ability to define data centre architecture standards through its product ecosystem choices.
Co-Packaged Optics Market Segment Analysis
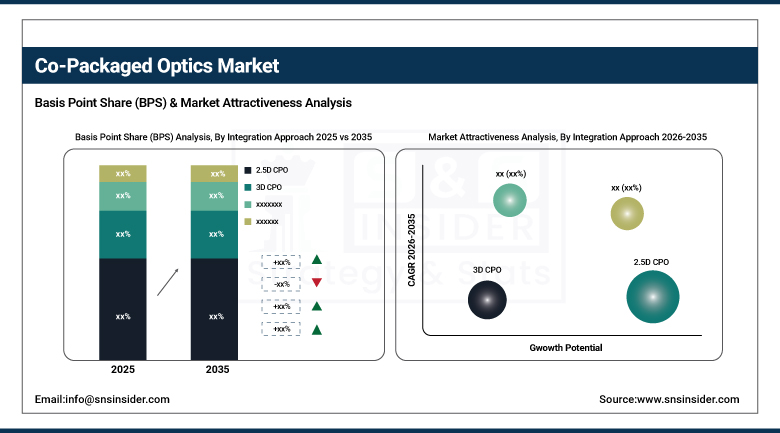
- By Integration Approach, 2.5D CPO dominated the market with an estimated share of around 68% in 2025 due to its integration maturity, established supply chain, and compatibility with existing packaging infrastructure in data centers and HPC environments. 3D CPO is projected to be the fastest-growing segment owing to rising demand for higher bandwidth density, compact integration, and improved energy efficiency in AI and cloud infrastructure.
- By Data Rate, the Less-than-1.6T and 1.6T segments collectively accounted for approximately 72% of the market share in 2025, supported by strong deployment across current-generation 51.2 Tbps switching platforms. Greater-than-1.6T segments are expected to witness the fastest growth driven by next-generation AI networking and 102.4 Tbps switching requirements.
- By Application, Data Centers and High-Performance Computing held the dominant market share of around 64% in 2025 due to early hyperscale adoption of CPO technology. Telecommunications and Networking is anticipated to be the fastest-growing segment fueled by rising demand for 800G and 1.6T optical backbone infrastructure and 5G network expansion.
- By End User, Cloud Service Providers dominated the co-packaged optics market with an estimated share of around 58% in 2025. Telecom Operators are projected to be the fastest-growing segment.
By Integration Approach, 2.5D CPO Leads Integration Approach, 3D CPO Grows Fastest
2.5D CPO retained the leading integration approach position in 2025, as the technology’s relative maturity in packaging integration processes, availability of established assembly and testing infrastructure at leading OSAT facilities, and the more manageable thermal co-location challenges of 2.5D configurations relative to 3D stacked approaches make it the deployment-practical choice for the first commercial generation of CPO switches including Broadcom’s Bailly and Tomahawk-based CPO implementations. The 2.5D CPO approach, which positions optical engines adjacent to but not stacked above the switch ASIC on a common substrate, reduces the electrical path between electrical and optical domains relative to pluggable solutions while maintaining the physical separation that enables more conventional thermal management approaches to handle the combined heat generation of both switch ASIC and optical engine components.
3D CPO is the fastest-growing integration approach segment, propelled by the architectural necessity of next-generation AI switch and accelerator designs whose bandwidth density and power budget requirements exceed what 2.5D configurations can achieve, as the shorter electrical paths, higher optical density, and improved thermal coupling that 3D stacking enables translate directly into the superior per-bit energy efficiency and bandwidth density that AI cluster fabric designers are specifying for 2027 and beyond generation infrastructure. The development of wafer-scale integration approaches where optical engines are integrated directly at the wafer level during ASIC fabrication, most prominently pioneered by Intel’s Integrated Photonics Solutions Group and Ayar Labs’s TeraPHY optical I/O technology, represents the leading edge of 3D CPO integration demonstrating the physical interconnect and power efficiency performance levels that the AI computing industry requires to continue scaling cluster bandwidth without proportional growth in infrastructure power consumption.
By Application, Data Centers & HPC Lead Application, Telecoms & Networking Grows Fastest
Data centers and high-performance computing retained the dominant application position in 2025, representing the commercial context in which CPO technology’s value proposition is most immediately and urgently relevant as AI infrastructure bandwidth demands are growing at rates that the pluggable transceiver ecosystem can only partially address through product evolution without the fundamental architectural step-change that CPO integration delivers. The hyperscale data centre operators including AWS, Microsoft Azure, Google Cloud, and Meta collectively represent the world’s most commercially significant CPO procurement pipeline, as their continuous infrastructure expansion programmes require successive generations of switch fabric capability whose bandwidth and power efficiency requirements are the specification targets around which CPO product development roadmaps are aligned.
Telecommunications and networking is the fastest-growing application segment for co-packaged optics, as the bandwidth demands of coherent optical backbone network capacity expansion, 5G transport network densification, and the growing deployment of optical interconnects within telecommunications central offices and edge computing nodes create a growing CPO application space beyond the data centre. The transition of telecommunications network switching and routing equipment toward disaggregated white box architectures whose open hardware designs are increasingly specified to incorporate CPO-based optical interfaces rather than pluggable transceiver cages represents a structural adoption pathway that major telecommunications operators including AT&T, Comcast, Deutsche Telekom, and China Mobile are evaluating as a means of reducing power consumption and increasing bandwidth of their core network infrastructure at a lifecycle upgrade cost comparable to conventional pluggable-based equipment replacement.
By End User, Cloud Service Providers Lead End User, Government & Defense Grows
Cloud service providers retained the dominant end user position in the co-packaged optics market in 2025, as the hyperscale cloud operators’ AI infrastructure capital expenditure programmes constitute the primary commercial demand driver whose procurement timelines, bandwidth requirements, and power efficiency imperatives are directly shaping CPO product development priorities and production ramp schedules across every major CPO technology developer and optical engine supplier in the global ecosystem. The major hyperscale cloud operators’ AI infrastructure buildout is characterised by the unprecedented scale of GPU cluster deployment whose network fabric bandwidth requirements exceed what any previous generation of computing infrastructure demanded, creating the specific CPO adoption urgency that is moving the technology from early adopter commercial availability to mainstream deployment planning across the global hyperscale infrastructure community.
Government and defence represents a growing and commercially distinct end user segment whose CPO adoption motivation is driven by the unique operational environment requirements of military and intelligence community computing systems rather than the commercial data centre cost efficiency considerations that motivate hyperscale cloud operator adoption. The U.S. Department of Defense’s investment in high-density, high-bandwidth computing infrastructure for AI-enabled intelligence analysis, autonomous system coordination, and electronic warfare applications creates procurement demand for CPO-based networking components whose size, weight, and power advantages relative to pluggable transceiver alternatives are particularly compelling in airborne, shipboard, and vehicle-mounted computing contexts where the power budget available for computing and communications electronics is severely constrained.
Regional Insights
|
Region |
Major Country |
Share Within Region, 2025 (%) |
|---|---|---|
|
North America |
United States |
87.4% |
|
Europe |
Germany |
22.3% |
|
Asia Pacific |
China |
61.7% |
|
Middle East & Africa |
Saudi Arabia |
38.4% |
|
Latin America |
Brazil |
44.2% |
North America Fastest Growing CPO Regional Market Insights
North America is the fastest-growing regional market for co-packaged optics, driven by the extraordinary concentration of hyperscale AI infrastructure investment in U.S. data centre campuses whose procurement decisions will define the global CPO adoption trajectory, the leadership position of U.S.-based CPO technology developers including Broadcom, Marvell, and Intel whose commercial product launches are setting the specification standards for initial CPO deployments, and the CHIPS Act investments supporting domestic silicon photonics fabrication capacity. The U.S. market’s CPO adoption timeline is being accelerated by the hyperscale cloud operators’ published AI infrastructure capital expenditure commitments, which collectively exceed USD 400 billion for 2025 alone across AWS, Microsoft, Google, and Meta, a proportion of which is specifically directed toward the network fabric upgrades from pluggable to CPO-based switching that AI cluster bandwidth requirements of LLM training and inference workloads are making necessary.
Get Customized Report as per Your Business Requirement - Enquiry Now
Europe Co-Packaged Optics Market Insights
Europe is an important co-packaged optics market whose development is being driven by the European hyperscale data centre expansion of U.S. cloud operators in Ireland, the Netherlands, Germany, and Nordic countries, combined with the European AI infrastructure investment programme whose European sovereignty cloud initiatives including GAIA-X and the European Chips Act are directing public funding toward European-based AI computing infrastructure that will include CPO technology as a procurement specification in successive upgrade generations. Germany accounts for approximately 22.3% of European CPO revenues, anchored by the Frankfurt hyperscale data centre concentration serving as the primary cloud hub for European financial services and manufacturing sectors, combined with Deutsche Telekom’s core network infrastructure upgrade investment and the research computing facilities of major German scientific institutions whose HPC infrastructure modernization includes CPO-capable network fabric specifications.
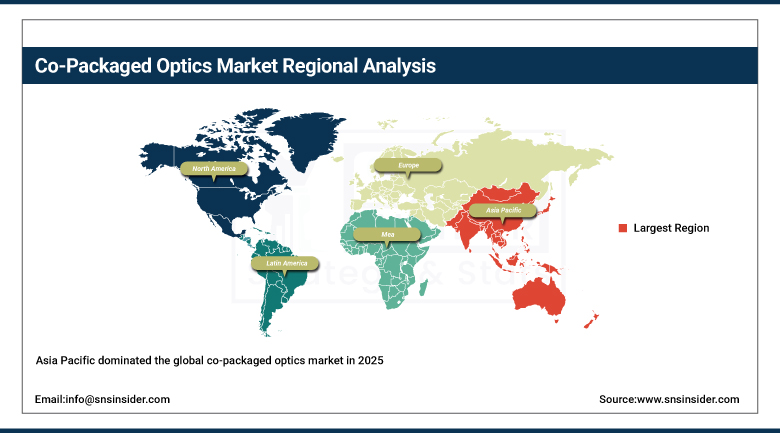
Asia Pacific Dominates Co-Packaged Optics Market Insights
Asia Pacific dominated the global co-packaged optics market in 2025, driven by the region’s status as the world’s largest concentration of hyperscale data centre infrastructure, the primary manufacturing base for optical component and integrated photonics production, and the most active regional market for AI computing infrastructure investment creating the primary commercial demand pull for CPO technology. China accounts for approximately 61.7% of Asia Pacific revenues through its extraordinary combination of hyperscale cloud infrastructure operated by Alibaba Cloud, Tencent Cloud, ByteDance, and Baidu, the world’s largest optical component manufacturing industry concentrated in the Pearl River Delta and Yangtze River Delta technology corridors, and domestic semiconductor and photonics companies whose CPO component and integration capabilities are advancing at competitive rates. Japan’s contribution to Asia Pacific CPO market revenues reflects both Furukawa Electric’s leading position in CPO optical connector and component supply, with the company’s March 2025 compact 12-fiber optical connector for CPO applications demonstrating Japan’s commercial photonics manufacturing strength, and the growing hyperscale data centre investment in Japanese facilities driven by AI infrastructure demand.
Latin America and MEA Co-Packaged Optics Market Insights
Latin America and the Middle East and Africa are early-stage co-packaged optics markets where the primary near-term demand is generated by hyperscale data centre investments of U.S. cloud operators establishing regional infrastructure presence to serve growing cloud services demand from enterprise and consumer customers, rather than indigenous CPO development activity. Brazil accounts for approximately 44.2% of Latin American CPO revenues through the São Paulo hyperscale data centre cluster serving as the primary cloud infrastructure hub for Latin American enterprise cloud adoption, with AWS, Microsoft Azure, and Google Cloud all operating significant capacity in the region whose future network fabric specifications will progressively incorporate CPO technology as it transitions from early adopter to mainstream deployment. Saudi Arabia leads Middle East and Africa CPO revenues at approximately 38.4% of the regional total, driven by the Kingdom’s hyperscale data centre investment programme supporting Vision 2030’s cloud-first digital transformation and AI economy development objectives.
Market Dynamics
Growth Drivers: AI infrastructure bandwidth crisis creating urgent CPO adoption imperative at hyperscale data centres
The primary structural growth driver for the co-packaged optics market is the mathematically inevitable AI infrastructure bandwidth crisis being created by the exponential growth of AI training cluster scale, where the bandwidth requirements of all-to-all GPU communication patterns during distributed training grow quadratically with cluster size, creating a point within the next generation of LLM training infrastructure at which pluggable transceiver technology’s power consumption and bandwidth density limitations become hard constraints on training cluster feasibility. Broadcom’s demonstration that CPO-based switching can reduce the power consumed by optical I/O in a 51.2 Tbps switch by approximately 2 kilowatts relative to an equivalent pluggable transceiver configuration provides a quantified power saving per switch that, scaled across thousands of switches in a frontier AI training cluster, translates into tens of megawatts of data centre power budget available for additional compute capacity rather than interconnect overhead. Silicon photonics’ manufacturing cost trajectory, aligned with semiconductor foundry capacity expansion and the cumulative yield improvements that production volume experience delivers, is progressively closing the cost premium that CPO-based solutions have historically carried, approaching the breakeven point at which CPO’s power and bandwidth density advantages can be obtained without a significant unit cost penalty that would delay adoption.
Restraints: Thermal co-location management complexity for combined ASIC and optical engine heat generation
A significant restraint on the co-packaged optics market is the thermal management complexity created by co-locating heat-generating optical engine components adjacent to heat-generating switch ASIC dies whose combined thermal output at 51.2 Tbps and beyond creates hotspot densities requiring sophisticated thermal management solutions including targeted liquid cooling and advanced thermal interface materials that add engineering complexity and cost to CPO switch designs. The lack of standardized CPO module interfaces, connector formats, and optical engine specifications across different switch ASIC vendors has historically prevented multi-vendor interoperability, limited procurement competition and creating supply concentration risks that delay volume deployment commitments from hyperscale operators whose supply chain resilience requirements are stringent.
Opportunities: Next-generation AI switch beyond 51.2 Tbps requiring CPO as the only viable interconnect architecture
The next-generation AI switch market at 102.4 Tbps and above represents the commercial transition point at which CPO moves from a premium technical solution to the only commercially viable interconnect architecture for switches whose bandwidth and power requirements exceed pluggable technology’s fundamental capability envelope, creating a mandatory adoption imperative driven by AI cluster scale requirements. The extension of CPO technology to AI accelerator chip-to-chip interconnects, where optical I/O between GPU or TPU dies eliminates the electrical bumping and substrate routing bottlenecks limiting current chiplet interconnect bandwidth, represents a market opportunity substantially larger than the CPO switch market alone and whose realisation would make CPO a fundamental enabling technology for AI accelerator architecture rather than simply an improvement to switch peripheral interface.
Recent Developments
- 2025: Broadcom introduced its third-generation co-packaged optics technology in May 2025 with 200G-per-lane capability for AI-scale networks, demonstrating ecosystem readiness with improved thermal management prototypes, OSAT process enhancements, and Corning’s optical component supply collaboration for the 51.2 Tbps Bailly Ethernet switch, positioning Broadcom as the first vendor to achieve commercial-grade CPO deployment readiness at hyperscale specifications.
- 2025: Corning Incorporated announced a collaboration with Broadcom in May 2025 to supply advanced optical components for CPO infrastructure in AI data centres, contributing optical fiber connectivity and component expertise to Broadcom’s Bailly CPO switch ecosystem and demonstrating the value chain integration between established optical component manufacturers and semiconductor switch ASIC developers that CPO commercialization requires.
Co-Packaged Optics Compnies are:
-
NVIDIA Corporation
-
Intel Corporation
-
Marvell Technology Inc
-
Cisco Systems Inc
-
Ayar Labs Inc
-
Coherent Corp
-
Lumentum Holdings Inc
-
II-VI Incorporated
-
Furukawa Electric Co., Ltd
-
Corning Incorporated
-
Celestial AI
-
Credo Technology Group Holding Ltd
-
Arista Networks Inc
-
Juniper Networks Inc
-
IBM Corporation
-
Lightwave Logic Inc
-
NewPhotonics Ltd
-
Kyocera Corporation
Co-Packaged Optics Market Report Scope:
| Report Attributes | Details |
|---|---|
| Market Size in 2025 | USD 91.27 Million |
| Market Size by 2035 | USD 1,923.64 Million |
| CAGR | CAGR of 35.70% From 2026 to 2035 |
| Base Year | 2025 |
| Forecast Period | 2026-2035 |
| Historical Data | 2022-2024 |
| Report Scope & Coverage | Market Size, Segments Analysis, Competitive Landscape, Regional Analysis, DROC & SWOT Analysis, Forecast Outlook |
| Key Segments | •By Integration Approach (2.5D CPO, 3D CPO, Others) •By Data Rate (Less Than 1.6T, 1.6T, Greater Than 1.6T) •By Application (Data Centers & HPC, Telecommunications & Networking, Defense & Aerospace, Others) •By End User (Cloud Service Providers, Telecom Operators, Government & Defense, Others) |
| Regional Analysis/Coverage | North America (US, Canada), Europe (Germany, UK, France, Italy, Spain, Russia, Poland, Rest of Europe), Asia Pacific (China, India, Japan, South Korea, Australia, ASEAN Countries, Rest of Asia Pacific), Middle East & Africa (UAE, Saudi Arabia, Qatar, South Africa, Rest of Middle East & Africa), Latin America (Brazil, Argentina, Mexico, Colombia, Rest of Latin America). |
| Company Profiles | Broadcom Inc., NVIDIA Corporation, Intel Corporation, Marvell Technology Inc., Cisco Systems Inc., Ranovus Inc., Ayar Labs Inc., Coherent Corp., Lumentum Holdings Inc., II-VI Incorporated, Furukawa Electric Co., Ltd., Corning Incorporated, Celestial AI, Credo Technology Group Holding Ltd., Arista Networks Inc., Juniper Networks Inc., IBM Corporation, Lightwave Logic Inc., NewPhotonics Ltd., and Kyocera Corporation. |
Get in Touch
