InGaAs Camera Market Report Scope & Overview:
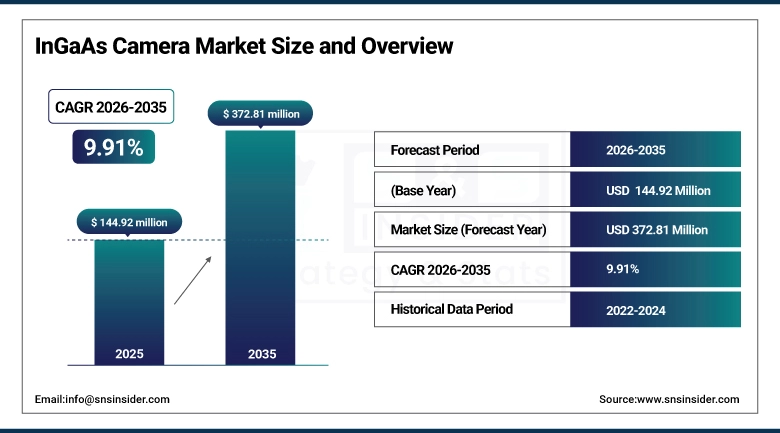
The InGaAs Camera Market was valued at USD 144.92 million in 2025 and is expected to reach USD 372.81 million by 2035, growing at a CAGR of 9.91% from 2026-2035.
The growth of InGaAs camera market is driven due to the increasing demand for high-resolution imaging in low light and infrared conditions across various industries such as defense, industrial automation and scientific research. Sensors for InGaAs cameras can sense the shortwave infrared (SWIR) spectrum of light ranging approximately from 900 nm to 1700 nma IR wavelength range where silicon-based cameras are blind and thus providing valuable functionality such as being able to image through thin layers of atmospheric haze, detect counterfeit materials based on spectral fingerprinting, recognize chemical compositions and provide non-destructive testing capabilities. Recent advances in SWIR technology are fuelling this market, with the growing penetration of InGaAs cameras for use in smart vision systems in developed and developing countries. AI-Powered Image Processing and Miniaturized Sensor Architectures Two developments that are creating new frontiers in application focused on agriculture, pharmaceuticals, and semiconductor inspection.
According to industry data, the Military & Defense segment dominated the InGaAs Camera Market with approximately 31.84% revenue share in 2025, driven by the unique capability of SWIR imaging to deliver superior performance in low-light and adverse environmental conditions for night-vision, target acquisition, and surveillance while Industrial Automation is expected to register the fastest CAGR of approximately 11.01% driven by the rapid penetration of machine vision and robotics requiring precise infrared inspection capabilities.
Market Size and Forecast
-
Market Size in 2025: USD 144.92 Million
-
Market Size by 2032: USD 372.81 Million
-
CAGR: 9.91% from 2026 to 2035
-
Base Year: 2025
-
Forecast Period: 2026-2035
-
Historical Data:2022-2024
To Get more information on InGaAs Camera Market - Request Free Sample Report
InGaAs Camera Market Trends
-
Rapid development of uncooled InGaAs camera technology enabling compact, cost-effective SWIR imaging solutions for commercial applications including agricultural sorting, food quality inspection, and industrial process monitoring without the complexity of cooling systems.
-
Growing integration of AI-powered image processing algorithms with InGaAs cameras for real-time defect detection, spectral classification, material identification, and automated quality control in semiconductor and pharmaceutical manufacturing environments.
-
Increasing miniaturization of InGaAs sensor modules enabling integration into UAVs, handheld inspection devices, smartphone attachments, and wearable industrial platforms expanding the addressable market beyond traditional fixed installation applications.
-
Rising adoption of hyperspectral InGaAs imaging systems in agriculture for crop stress detection, soil composition analysis, and precision irrigation management enabling non-destructive, real-time field assessment using SWIR spectral signatures.
-
Growing deployment of InGaAs cameras in fiber optic telecommunications for optical time domain reflectometry (OTDR), laser beam characterization, and network fault detection at NIR and SWIR wavelengths critical for fiber communication systems.
-
Increasing use of InGaAs cameras in solar cell inspection for identifying micro-cracks, electrical defects, and shunting areas through electroluminescence and photoluminescence imaging that is invisible to standard silicon cameras.
-
Rising development of extended-SWIR InGaAs cameras sensitive beyond 2.0 microns for gas sensing, chemical detection, explosive identification, and military laser warning applications requiring sensitivity at longer infrared wavelengths.
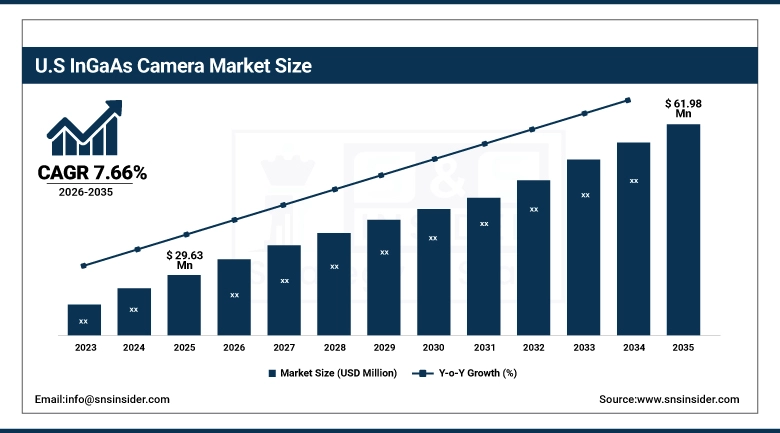
U.S. InGaAs Camera Market was valued at USD 29.63 million in 2025 and is expected to reach USD 61.98 million by 2035, registering a CAGR of 7.66% during 2026-2035.
The U.S. is anticipated to be the largest global InGaAs camera market, bolstered by order backlog of advanced imaging systems for defense purposes, the presence of leading inGaAs camera manufacturing companies including Sensors Unlimited, Princeton Instruments and Teledyne Imaging, along with substantial investments into R&D across defense & semiconductor manufacturers and high-end scientific research institutes. The U.S. Department of Defense remains committed substantially funding RDT&E for advanced imaging technologies development across surveillance, targeting and autonomous system applications.
This also driven significant new commercial market opportunities beyond the traditional defense applications due to the faster adoption of InGaAs cameras in Industry 4.0 smart factory, capable of delivering unparalleled detection performance for semiconductor wafer inspection, PCB quality control and pharmaceutical tablet integrity verification that is not possible using standard visible-light cameras.
InGaAs Camera Market Segment Insights
-
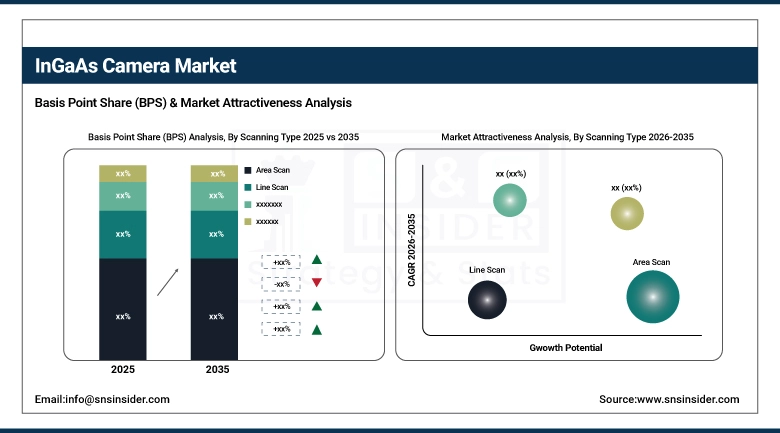
Based on Scanning Type, Area Scan accounted for the largest market share (57.95%) in 2025; Line Scan expected to be the fastest-growing segment (CAGR of 10.80%).
-
Based on Cooling Technology, Cooled accounted for the largest market share (73.88%) in 2025; Uncooled expected to be the fastest-growing segment (CAGR of 11.33%).
-
Based on Application, Military & Defense accounted for the largest market share (31.84%) in 2025; Industrial Automation expected to be the fastest-growing segment (CAGR of 11.01%).
InGaAs Camera Market Segment Analysis
By Scanning Type, Area Scan dominates, Line Scan expected to grow fastest
InGaAs camera market for area scan cameras accounted for the 57.95% revenue share in 2025 A high-resolution, full-frame image based camera, with applications for industrial inspection, scientific imaging and defense surveillance are the ideal areas scan cameras. It's also capable of covering much larger regions in a single shot, which means quicker processing times and easier integration into multi-axis imaging systems. Growing popularity of area scan because of its wide range of applications in military surveillance, environmental monitoring and medical imaging has further strengthened the dominance of this segment.
The line scan segment is projected to register the fastest CAGR of more than 10.80% from 2026-2035, attributed to the rising demand for continuous & high-speed imaging in industrial applications and web inspection, conveyor belt quality control process and high-throughput pharmaceutical tablet inspection. Because they are imaged at speeds that approach the speed of light, line scan cameras are highly suited to imaging continuous moving objects, more-so than area scan cameras which would involve complicated motion synchronization with an automated production line.
By Cooling Technology, Cooled dominates, Uncooled expected to grow fastest
Cooled InGaAs cameras held the largest revenue share of approximately 73.88% in 2025, due to its better sensitivity and image quality for professional and scientific applications. Thermal noise is decreased with cooling systems, meaning the images taken in low-light and long-exposure environments are clearer or more sensitive. This makes cooled cameras especially useful in fields including defense, astronomy and scientific research, where image clarity, stability and sensitivity are some of the key requirements. We are identifes the global leaders in cooled InGaAs technology for advanced applications;FLIR Systems and Teledyne Imaging.
The uncooled SWIR segment is projected to be the fastest growing segment and will grow at a CAGR of approximately 11.33% from 2026-2035 due to widespread demand for smaller, lighter, lower-cost SWIR imaging systems. Uncooled cameras are reaching performance levels increasingly competitive to refrigerated systems at a much lower level of cost and complexity which make them available commercially for food inspection, agricultural sorting, and machine vision applications where the extreme sensibility of cooled systems is not necessary by making use of InGaAs detection sensor technology as it matures.
By Application, Military & Defense leads, Industrial Automation expected to grow fastest
The Military & Defense segment dominated with approximately 31.84% revenue share in 2025. InGaAs cameras are widely used by defense agencies for night-vision, target acquisition, threat detection, laser warning and multi-spectral surveillance. InGaAs cameras are essential for many modern military surveillance platforms due to their unique ability to provide performance where illumination levels are low, in haze and in obscured media. The Increased Geopolitical Tensions And The Global Military Modernization Programs Will Continue To Drive Demand For Defense InGaAs Cameras.
Industrial Automation is expected to grow at the fastest CAGR of approximately 11.01% from 2026-2035, InGaAs Cameras are popular in automated inspection systems to make manufacturing operations more efficient, detect defects that are not visible to standard cameras while improving process precision and operational reliability. High-speed and precision-based SWIR imaging is gradually increasing in adoption across the semiconductor, electronics, pharmaceutical, and food processing industries with the advent of smart factories and IoT-driven automation..
Market Regional Analysis
|
Region |
Major Country |
Share within Region (%) |
|---|---|---|
|
North America |
United States |
40% |
|
Europe |
Germany |
30% |
|
Asia Pacific |
China |
35% |
|
Middle East & Africa |
Israel |
28% |
|
Latin America |
Brazil |
35% |
North America InGaAs Camera Market Insights
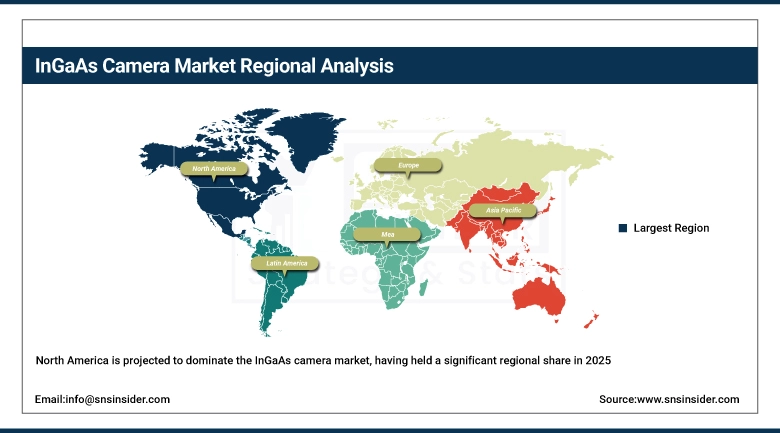
North America is projected to dominate the InGaAs camera market, having held a significant regional share in 2025 (between both defense spending and appetite for advanced automation technologies) with key technology players including major participants such as Sensors Unlimited, Princeton Instruments, Teledyne Imaging Raptor Photonics — dominating in North American regions. Due to investments in DoD imaging technology, extensive aerospace applications and the toughest semiconductor industry inspection requirements in a regionally context, the U.S. continues to lead demand growth through successive product generations.
Get Customized Report as per Your Business Requirement - Enquiry Now
Asia Pacific InGaAs Camera Market Insights
Asia Pacific is a fast-growing InGaAs camera market mainly with industrialization soaring on imagery applications in China, Japan, South Korea and India increasing demand of SWIR imaging expanding electronics and semiconductor sectors. The Asia Pacific market has been dominated by China due to the rapid development of the semiconductor industry. As demand for manufacturing automation and defense imaging is set to accelerate, the region is expected to post a robust growth CAGR over the forecast period.
Europe InGaAs Camera Market Insights
Europe holds a significant position in the global InGaAs camera market, supported by growing adoption of SWIR cameras in industrial automation, food inspection, pharmaceutical quality control, and agricultural applications in Germany, France, the United Kingdom, and the Netherlands. European defense agencies are also investing in advanced SWIR imaging for border surveillance, battlefield awareness, and UAV-mounted reconnaissance systems.
Middle East & Africa and Latin America InGaAs Camera Market Insights
Middle East InGaAs Camera market is influenced by the defense and security followed by defense sectors in various countries, where Israel holds a significant contribution through extensive nuclear and advanced defence technology research. InGaAs camera activities in Latin America are a recently emerging market, with initial commercial market development coming from agricultural and food inspection applications for Brazil.
Market Growth Drivers:
Technological Convergence and Expanding SWIR Imaging Applications Fueling Strong Market Expansion: The InGaAs Camera Market is registering robust growth with increasing demand for high resolution short-wave infrared (SWIR) imaging in military surveillance, industrial automation & scientific research applications. Recent breakthroughs in uncooled InGaAs sensor technology that promises low-cost and efficient imaging are ensuring that advanced spectrometers have a larger operating envelope beyond defense applications. Image processing utilizing AI improves over system performance to enhance areas like real-time analytics, object detection and precision imaging. The establishment of smaller InGaAs sensor modules for UAV platforms provides aerial surveillance, infrastructure inspection and environmental monitoring boosting adoption further. Demand is additionally expanding further by virtue of expanding applications in regions, for example, agribusiness, pharmaceuticals, semiconductor observation and material investigation. Overall these technological and application driven developments are making InGaAs cameras mainstream as industrial & commercial imaging systems with considerable marketisation potential through 2035.
Market Restraints
High Cost Burden and Regulatory Barriers Limiting Commercial Penetration: The InGaAs camera market is experiencing considerable restraints rather resulting due to the high cost structure of cooled InGaAs camera systems that still have a manufacturers price greater than conventional silicon-based imaging solutions. The cost difference limits uptake in major commercial sectors, particularly those which are price sensitive such as agriculture, consumer electronics, and also small-scale industrial inspection where payback is often a key issue. Moreover, strict and convoluted import/export restrictions of SWIR imaging technologies create compliance headaches for manufacturers while making cross-border trade less than seamless. These regulations particularly affect defense and high-performance imaging systems, hampering the worldwide rollout of these technologies as well as limiting potential scale-up in regions driving emerging markets.
Market Opportunities
Expanding Commercialization Across Industrial, Agricultural, and Aerospace Applications: Factors such as increasing commercialization of the uncooled InGaAs cameras across various end-use industries is creating significant expansion opportunities in the InGaAs camera market In agriculture; crop sorting, moisture detection, and food quality inspection—are some applications for these systems in which once again efficiency is increased as the amount of waste decreases. Today, SWIR imaging is gaining traction in the semiconductor and solar cell markets to help identify defects and conduct precise wafer analysis for optimized manufacturing processes . In addition, InGaAs cameras on UAV platforms are also facilitating improved monitoring of infrastructure, surveillance and environmental studies. Demand for more from applications such as scientific research, life science and material analysis is also driving adoption.
Recent Developments:
-
2025 : Teledyne FLIR expanded its InGaAs camera product line with new compact, high-resolution SWIR camera modules designed for integration into UAV systems and handheld inspection platforms.
-
2024 : Hamamatsu Photonics launched a new series of compact uncooled InGaAs image sensors targeting industrial machine vision and food inspection applications at significantly reduced cost compared to cooled alternatives.
-
2024 : Sensors Unlimited (Collins Aerospace) announced expansion of its defense-grade InGaAs camera production capacity to address growing U.S. DoD demand for advanced SWIR imaging in next-generation reconnaissance systems.
-
2024 : Xenics launched its new Cheetah-640 GigE InGaAs area scan camera with 640x512 resolution and Gigabit Ethernet interface, targeting scientific research, spectroscopy, and high-speed industrial inspection.
-
2024 : Princeton Instruments released an enhanced InGaAs camera series for astronomy and astrophysics applications with deep cooling capability to -85°C for ultra-low noise, high-sensitivity NIR/SWIR detection.
InGaAs Camera Market Key Players
-
Teledyne FLIR (Teledyne Technologies)
-
Hamamatsu Photonics K.K.
-
Sensors Unlimited (Collins Aerospace)
-
Xenics NV
-
Princeton Instruments (Teledyne Technologies)
-
Allied Vision Technologies GmbH
-
Raptor Photonics Ltd.
-
First Sensor AG (TE Connectivity)
-
Jenoptik AG
-
New Imaging Technologies (NIT)
-
Photon Etc.
-
Infrared Laboratories, Inc.
-
Lynred (formerly Sofradir-ULIS)
-
SCD (SemiConductor Devices)
-
i3system Inc.
-
CETC (No. 44 Research Institute)
-
Teledyne Imaging Sensors
-
Photonic Science Ltd.
-
Lumenera Corporation
-
Adimec Advanced Image Systems
| Report Attributes | Details |
|---|---|
| Market Size in 2025 | USD 144.92 Million |
| Market Size by 2035 | USD 372.81 Million |
| CAGR | CAGR of 9.91% From 2026 to 2035 |
| Base Year | 2025 |
| Forecast Period | 2026-2035 |
| Historical Data | 2022-2024 |
| Report Scope & Coverage | Market Size, Segments Analysis, Competitive Landscape, Regional Analysis, DROC & SWOT Analysis, Forecast Outlook |
| Key Segments | • By Scanning Type(Area Scan, Line Scan) • By Cooling Technology(Cooled, Uncooled) • By Application(Military & Defense, Industrial Automation, Surveillance, Safety, and Security, Scientific Research, Spectroscopy, Aerospace & Aviation, Agriculture, Others) |
| Regional Analysis/Coverage | North America (US, Canada), Europe (Germany, UK, France, Italy, Spain, Russia, Poland, Rest of Europe), Asia Pacific (China, India, Japan, South Korea, Australia, ASEAN Countries, Rest of Asia Pacific), Middle East & Africa (UAE, Saudi Arabia, Qatar, South Africa, Rest of Middle East & Africa), Latin America (Brazil, Argentina, Mexico, Colombia, Rest of Latin America). |
| Company Profiles | Teledyne FLIR (Teledyne Technologies), Hamamatsu Photonics K.K., Sensors Unlimited (Collins Aerospace), Xenics NV, Princeton Instruments (Teledyne Technologies), Allied Vision Technologies GmbH, Raptor Photonics Ltd., First Sensor AG (TE Connectivity), Jenoptik AG, New Imaging Technologies (NIT), Photon Etc., Infrared Laboratories, Inc., Lynred (formerly Sofradir-ULIS), SCD (SemiConductor Devices), i3system Inc., CETC (No. 44 Research Institute), Teledyne Imaging Sensors, Photonic Science Ltd., Lumenera Corporation, Adimec Advanced Image Systems. |
Frequently Asked Questions
North America dominated the InGaAs Camera Market in 2025, driven by strong defense spending on advanced imaging systems, the presence of key technology manufacturers including Sensors Unlimited and Teledyne Imaging, and significant R&D investment across defense and semiconductor research institutions.
The Military & Defense segment dominated the InGaAs Camera Market in 2025 with approximately 31.84% revenue share, driven by the unique SWIR imaging capabilities of InGaAs cameras for night-vision, target acquisition, and surveillance in low-light and adverse weather conditions.
The Area Scan segment dominated the InGaAs Camera Market in 2025, accounting for approximately 57.95% of global revenue, driven by their versatility, high spatial resolution, and widespread application across military surveillance, scientific imaging, and industrial inspection environments.
Rising demand for high-resolution shortwave infrared imaging in military surveillance, industrial automation, and scientific research — combined with advancements in uncooled InGaAs sensor technology reducing costs and expanding commercial deployability — is the primary driver of sustained market growth through 2032.
The InGaAs Camera Market was valued at USD 144.92 million in 2025.
The InGaAs Camera Market is expected to grow at a CAGR of 9.91% from 2026 to 2035.
Get in Touch
