Get More Information on Commercial Printing Market - Request Sample Report
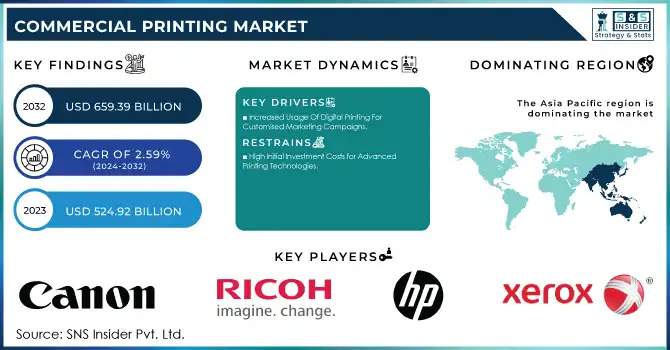
Commercial Printing Market size was valued at USD 486.3 billion in 2023 and is expected to grow to USD 622 billion by 2031 and grow at a CAGR of 3.12 % over the forecast period of 2024-2031
Commercial printing involves a wide range of techniques, from mass printing to binding, composition, and layout design, and press outputs. Phone books, journals, labels, catalogues, brochures, company forms, promotional materials, and training manuals are just a few of the printed goods that a commercial printer can create.
There is a paper input tray, an ink refill tray, a digital or analogy control panel, a memory card reader, and an output tray. It is widely used in the publishing and printing industries, as well as in large organizations that rely on efficient business procedures. Global demand is predicted to rise as a result of technical advances and expanded uses across a wide range of end-use sectors. Among the items are business forms, financial paperwork, and training manuals.
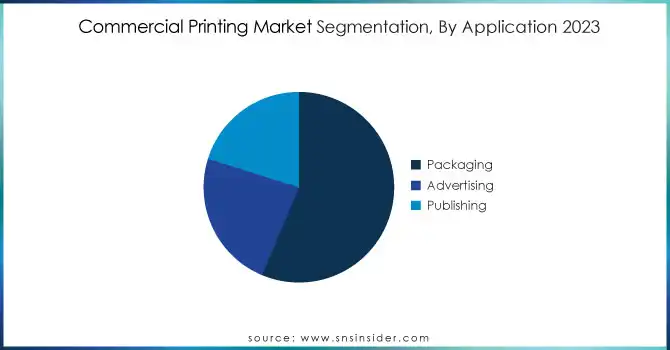
In 2022, the packaging segment had the highest revenue share of over 53.77%. Printing on labels, tags, and flexible packaging are all part of the packaging segment. Commercial printers have been observed utilizing digital technologies to improve the print quality of packaging. Furthermore, quick response (QR) codes are now a standard print on product packaging that may be scanned with a smartphone to display further info, such as product details and marketing content, to mention a few. 'In 2022, the lithographic printing category maintained the biggest share of 43.82%. The segment's dominance is due to the increased need for printing from packaging applications. Lithography technique has several advantages, including constant and excellent image quality, which leads to more usage. Lithographic printing is great for large volumes of static mailings like directories and product advertising. Flexographic technology is also one of the most often used. However, the post printing techniques required limit its use.
Report Attributes | Details |
---|---|
Key Segments | • By Technology (Digital Printing, Lithography Printing, Flexographic, Screen Printing, Gravure Printing, Others) • By Application (Packaging, Advertising, Publishing) |
Regional Coverage | North America (US, Canada, Mexico), Europe (Eastern Europe [Poland, Romania, Hungary, Turkey, Rest of Eastern Europe] Western Europe] Germany, France, UK, Italy, Spain, Netherlands, Switzerland, Austria, Rest of Western Europe]), Asia Pacific (China, India, Japan, South Korea, Vietnam, Singapore, Australia, Rest of Asia Pacific), Middle East & Africa (Middle East [UAE, Egypt, Saudi Arabia, Qatar, Rest of Middle East], Africa [Nigeria, South Africa, Rest of Africa], Latin America (Brazil, Argentina, Colombia, Rest of Latin America) |
Company Profiles | Quad/Graphies Inc., Acme Printing, Cenveo, RR Donnelley, Transcontinental Inc., LSC Communications US, LLC., Gorham Printing, Inc., Dai Nippon Printing, The Magazine Printing Company, Cimpress plc, Siegwerk, Toppan |
Increasing demand for promotional activities such as advertising in the retail industry
Users can make a lasting impact on their target audience by using high-quality commercial printing. The printing sector is an important aspect of every company's marketing strategy and provides a variety of services to fulfil the needs of its clients. Designing, printing, fulfilment, and finishing are among the services provided. These services are available on a variety of substrates, including paper, plastic, and canvas. Technological advances and rising demand for eco-friendly printers are important drivers driving growth in the global commercial printing industry. To meet rising demand, prominent businesses are providing environmentally friendly printing solutions.
Growing demand for environmentally friendly printers to reduce environmental effect
RESTRAIN:
Environmental Impact Reduction in the Printing Industry through Eco-Friendly Practices
Significant changes are being made to the commercial printing industry's activities and methods, including as the progressive substitution of sustainable solutions. With the importance of environmental consequences being stressed, several new measures for the printing industries are being created. Furthermore, the emissions of volatile organic compounds VOCs and other gases produced by the chemicals employed in the printing process have a number of negative effects. Green printing strategies have aided in the creation of novel, effective, and efficient methods of reducing waste. These difficulties arose throughout the printing process. Solvent-based inks are commonly used in printing because of the nature of the process. Printing technologies include gravure and flexography. When printing, these volatile solvents emit fumes.
OPPORTUNITY:
Print-on-demand's growing popularity
Print-on-demand's growing popularity is likely to generate considerable growth potential. Print-on-demand (POD) is a business concept that allows you to modify and sell products based on individual orders. It's a terrific method to put a new idea or product line to the test without the upfront expense and risk of purchasing inventory. Aside from these advantages, print on demand is environmentally beneficial. To lessen its environmental impact, it employs water-saving printing procedures and sends products in plastic-free packaging.
The growing demand for lithographic printing
CHALLENGES:
Growing market share for digital printing
Rising raw material costs
IMPACT OF RUSSIAN UKRAINE WAR
Inflationary newsprint costs have been a major source of concern for many years, Indian print publishers. With only a few weeks of supplies left, print publishers are even more concerned, especially those who rely on Russian imports, which account for 48% of total newsprint in the country.
The government decreased the customs charge on newsprint uncoated paper (glazed) and light-weight coated paper used to print newspapers and magazines from 12% to 7% in 2022 (as recommended in the Financial Bill 2022) Jain stated that they have now petitioned the government to abolish the 6% customs levy on newsprint. Despite the difficult situation, many Ukrainian printing businesses continue to operate and even fulfil commercial orders when possible. In addition to small targeted payments to printing firms, the Ukrainian government has devised measures for private entrepreneurs, including those in the printing industry, who have been exempted from several taxes. Many people in the packaging industry also volunteer for the Ukrainian armed forces.
By Technology
Digital Printing
Lithography Printing
Flexographic
Screen Printing
Gravure Printing
Others
By Application
Packaging
Advertising
Publishing
Books
Newspaper
Magazines
Others
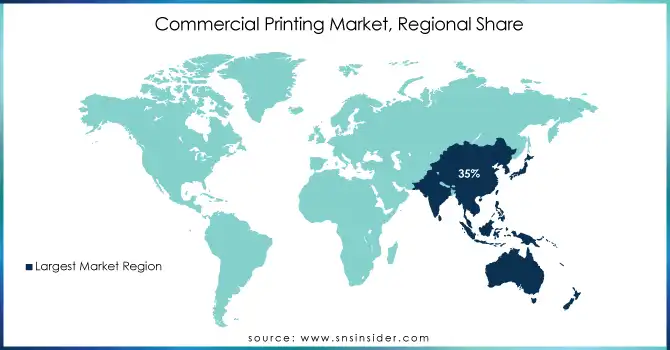
Asia Pacific is expected to develop at the fastest CAGR of 3.2%, and it was also the largest region. In 2023, the region will be the largest in the global market. The developments in the print industry are principally responsible for the regional expansion such as digital technologies, which are particularly prevalent in China and India. Traditional printers have been supplanted by high-tech commercial printers due to their high-speed capabilities as a result of such advancements. Furthermore, the region's e-commerce development and retail sector organization offer great opportunity for packaging growth in the packaging application, supporting the target market.
In 2023, North America owned the second-largest share of the commercial printing market, accounting for more than 33.15% of worldwide revenue. The increased demand for commercial printing for marketing, packaging, labeling, and advertising is driving regional expansion. Furthermore, the existence of significant regional firms such as Quad/Graphics Inc., Acme Printing, Cenevo, and RR Donnelley is expected to fuel the industry's growth.
Need any customization research on Commercial Printing Market - Enquiry Now
REGIONAL COVERAGE:
North America
US
Canada
Mexico
Europe
Eastern Europe
Poland
Romania
Hungary
Turkey
Rest of Eastern Europe
Western Europe
Germany
France
UK
Italy
Spain
Netherlands
Switzerland
Austria
Rest of Western Europe
Asia Pacific
China
India
Japan
South Korea
Vietnam
Singapore
Australia
Rest of Asia Pacific
Middle East & Africa
Middle East
UAE
Egypt
Saudi Arabia
Qatar
Rest of Middle East
Africa
Nigeria
South Africa
Rest of Africa
Latin America
Brazil
Argentina
Colombia
Rest of Latin America
Some of key players of Commercial Printing Market are Quad/Graphies Inc., Acme Printing, Cenveo, RR Donnelley, Transcontinental Inc., LSC Communications US, LLC., Gorham Printing, Inc., Dai Nippon Printing, The Magazine Printing Company, Cimpress plc, Siegwerk, Toppan and other players are listed in a final report.
Quad/Graphies Inc-Company Financial Analysis
In June 2022, Toppan developed a hologram capable of responding to bright light by showing text and images. This simplified verification for individuals without specialized devices or a QR code.
May 2022: Siegwerk revealed that SICURA Litho Pack ECO, their new UV offset ink for non-food paper and board applications, contains more than 40% renewable and vegetable-based components. Siegwerk claims that the improved UV offset.The ink series could include a higher percentage of bio-renewable component than standard UV inks.
Report Attributes | Details |
Market Size in 2023 |
US$ 486.3 Bn |
Market Size by 2031 |
US$ 622 Bn |
CAGR |
CAGR of 3.12 % From 2024 to 2031 |
Base Year |
2022 |
Forecast Period |
2024-2031 |
Historical Data |
2020-2021 |
Report Scope & Coverage |
Market Size, Segments Analysis, Competitive Landscape, Regional Analysis, DROC & SWOT Analysis, Forecast Outlook |
Market Restrain |
•Environmental Impact Reduction in the Printing Industry through Eco-Friendly Practices |
Key Drivers |
•Increasing demand for promotional activities such as advertising in the retail industry •Growing demand for environmentally friendly printers to reduce environmental effect |
Print-on-demand's growing popularity and the growing demand for lithographic printing.
Growing market share for digital printing and rising raw material costs.
Commercial Printing Market size was valued at USD 486.3 billion in 2023
North America is dominating the market.
Commercial Printing Market is anticipated to expand by 3.12 % from 2024 to 2031.
TABLE OF CONTENT
1. Introduction
1.1 Market Definition
1.2 Scope
1.3 Research Assumptions
2. Research Methodology
3. Market Dynamics
3.1 Drivers
3.2 Restraints
3.3 Opportunities
3.4 Challenges
4. Impact Analysis
4.1 Impact of the Russia-Ukraine War
4.2 Impact of Ongoing Recession
4.2.1 Introduction
4.2.2 Impact on major economies
4.2.2.1 US
4.2.2.2 Canada
4.2.2.3 Germany
4.2.2.4 France
4.2.2.5 United Kingdom
4.2.2.6 China
4.2.2.7 Japan
4.2.2.8 South Korea
4.2.2.9 Rest of the World
5. Value Chain Analysis
6. Porter’s 5 forces model
7. PEST Analysis
8. Commercial Printing Market Segmentation, By Technology
8.1 Digital Printing
8.2 Lithography Printing
8.3 Flexographic
8.4 Screen Printing
8.5 Gravure Printing
8.6 Others
9. Commercial Printing Market Segmentation, By Application
9.1 Packaging
9.2 Advertising
9.3 Publishing
9.3.1 Books.
9.3.2 Newspaper
9.3.3 Magazines
9.3.4 Others
10. Regional Analysis
10.1 Introduction
10.2 North America
10.2.1 North America Commercial Printing Market by Country
10.2.2North America Commercial Printing Market by Technology
10.2.3 North America Commercial Printing Market by Application
10.2.4 USA
10.2.4.1 USA Commercial Printing Market by Technology
10.2.4.2 USA Commercial Printing Market by Application
10.2.5 Canada
10.2.5.1 Canada Commercial Printing Market by Technology
10.2.5.2 Canada Commercial Printing Market by Application
10.2.6 Mexico
10.2.6.1 Mexico Commercial Printing Market by Technology
10.2.6.2 Mexico Commercial Printing Market by Application
10.3 Europe
10.3.1 Eastern Europe
10.3.1.1 Eastern Europe Commercial Printing Market by Country
10.3.1.2 Eastern Europe Commercial Printing Market by Technology
10.3.1.3 Eastern Europe Commercial Printing Market by Application
10.3.1.4 Poland
10.3.1.4.1 Poland Commercial Printing Market by Technology
10.3.1.4.2 Poland Commercial Printing Market by Application
10.3.1.5 Romania
10.3.1.5.1 Romania Commercial Printing Market by Technology
10.3.1.5.2 Romania Commercial Printing Market by Application
10.3.1.6 Hungary
10.3.1.6.1 Hungary Commercial Printing Market by Technology
10.3.1.6.2 Hungary Commercial Printing Market by Application
10.3.1.7 Turkey
10.3.1.7.1 Turkey Commercial Printing Market by Technology
10.3.1.7.2 Turkey Commercial Printing Market by Application
10.3.1.8 Rest of Eastern Europe
10.3.1.8.1 Rest of Eastern Europe Commercial Printing Market by Technology
10.3.1.8.2 Rest of Eastern Europe Commercial Printing Market by Application
10.3.2 Western Europe
10.3.2.1 Western Europe Commercial Printing Market by Country
10.3.2.2 Western Europe Commercial Printing Market by Technology
10.3.2.3 Western Europe Commercial Printing Market by Application
10.3.2.4 Germany
10.3.2.4.1 Germany Commercial Printing Market by Technology
10.3.2.4.2 Germany Commercial Printing Market by Application
10.3.2.5 France
10.3.2.5.1 France Commercial Printing Market by Technology
10.3.2.5.2 France Commercial Printing Market by Application
10.3.2.6 UK
10.3.2.6.1 UK Commercial Printing Market by Technology
10.3.2.6.2 UK Commercial Printing Market by Application
10.3.2.7 Italy
10.3.2.7.1 Italy Commercial Printing Market by Technology
10.3.2.7.2 Italy Commercial Printing Market by Application
10.3.2.8 Spain
10.3.2.8.1 Spain Commercial Printing Market by Technology
10.3.2.8.2 Spain Commercial Printing Market by Application
10.3.2.9 Netherlands
10.3.2.9.1 Netherlands Commercial Printing Market by Technology
10.3.2.9.2 Netherlands Commercial Printing Market by Application
10.3.2.10 Switzerland
10.3.2.10.1 Switzerland Commercial Printing Market by Technology
10.3.2.10.2 Switzerland Commercial Printing Market by Application
10.3.2.11 Austria
10.3.2.11.1 Austria Commercial Printing Market by Technology
10.3.2.11.2 Austria Commercial Printing Market by Application
10.3.2.12 Rest of Western Europe
10.3.2.12.1 Rest of Western Europe Commercial Printing Market by Technology
10.3.2.12.2 Rest of Western Europe Commercial Printing Market by Application
10.4 Asia-Pacific
10.4.1 Asia Pacific Commercial Printing Market by Country
10.4.2 Asia Pacific Commercial Printing Market by Technology
10.4.3 Asia Pacific Commercial Printing Market by Application
10.4.4 China
10.4.4.1 China Commercial Printing Market by Technology
10.4.4.2 China Commercial Printing Market by Application
10.4.5 India
10.4.5.1 India Commercial Printing Market by Technology
10.4.5.2 India Commercial Printing Market by Application
10.4.6 Japan
10.4.6.1 Japan Commercial Printing Market by Technology
10.4.6.2 Japan Commercial Printing Market by Application
10.4.7 South Korea
10.4.7.1 South Korea Commercial Printing Market by Technology
10.4.7.2 South Korea Commercial Printing Market by Application
10.4.8 Vietnam
10.4.8.1 Vietnam Commercial Printing Market by Technology
10.4.8.2 Vietnam Commercial Printing Market by Application
10.4.9 Singapore
10.4.9.1 Singapore Commercial Printing Market by Technology
10.4.9.2 Singapore Commercial Printing Market by Application
10.4.10 Australia
10.4.10.1 Australia Commercial Printing Market by Technology
10.4.10.2 Australia Commercial Printing Market by Application
10.4.11 Rest of Asia-Pacific
10.4.11.1 Rest of Asia-Pacific Commercial Printing Market by Technology
10.4.11.2 Rest of Asia-Pacific APAC Commercial Printing Market by Application
10.5 Middle East & Africa
10.5.1 Middle East
10.5.1.1 Middle East Commercial Printing Market by Country
10.5.1.2 Middle East Commercial Printing Market by Technology
10.5.1.3 Middle East Commercial Printing Market by Application
10.5.1.4 UAE
10.5.1.4.1 UAE Commercial Printing Market by Technology
10.5.1.4.2 UAE Commercial Printing Market by Application
10.5.1.5 Egypt
10.5.1.5.1 Egypt Commercial Printing Market by Technology
10.5.1.5.2 Egypt Commercial Printing Market by Application
10.5.1.6 Saudi Arabia
10.5.1.6.1 Saudi Arabia Commercial Printing Market by Technology
10.5.1.6.2 Saudi Arabia Commercial Printing Market by Application
10.5.1.7 Qatar
10.5.1.7.1 Qatar Commercial Printing Market by Technology
10.5.1.7.2 Qatar Commercial Printing Market by Application
10.5.1.8 Rest of Middle East
10.5.1.8.1 Rest of Middle East Commercial Printing Market by Technology
10.5.1.8.2 Rest of Middle East Commercial Printing Market by Application
10.5.2 Africa
10.5.2.1 Africa Commercial Printing Market by Country
10.5.2.2 Africa Commercial Printing Market by Technology
10.5.2.3 Africa Commercial Printing Market by Application
10.5.2.4 Nigeria
10.5.2.4.1 Nigeria Commercial Printing Market by Technology
10.5.2.4.2 Nigeria Commercial Printing Market by Application
10.5.2.5 South Africa
10.5.2.5.1 South Africa Commercial Printing Market by Technology
10.5.2.5.2 South Africa Commercial Printing Market by Application
10.5.2.6 Rest of Africa
10.5.2.6.1 Rest of Africa Commercial Printing Market by Technology
10.5.2.6.2 Rest of Africa Commercial Printing Market by Application
10.6 Latin America
10.6.1 Latin America Commercial Printing Market by Country
10.6.2 Latin America Commercial Printing Market by Technology
10.6.3 Latin America Commercial Printing Market by Application
10.6.4 Brazil
10.6.4.1 Brazil Commercial Printing Market by Technology
10.6.4.2 Brazil Africa Commercial Printing Market by Application
10.6.5 Argentina
10.6.5.1 Argentina Commercial Printing Market by Technology
10.6.5.2 Argentina Commercial Printing Market by Application
10.6.6 Colombia
10.6.6.1 Colombia Commercial Printing Market by Technology
10.6.6.2 Colombia Commercial Printing Market by Application
10.6.7 Rest of Latin America
10.6.7.1 Rest of Latin America Commercial Printing Market by Technology
10.6.7.2 Rest of Latin America Commercial Printing Market by Application
11 Company Profile
11.1 Quad/Graphies Inc.
11.1.1 Company Overview
11.1.2 Financials
11.1.3 Product/Services Offered
11.1.4 SWOT Analysis
11.1.5 The SNS View
11.2 Acme Printing
11.2.1 Company Overview
11.2.2 Financials
11.2.3 Product/Services Offered
11.2.4 SWOT Analysis
11.2.5 The SNS View
11.3 Cenveo
11.3.1 Company Overview
11.3.2 Financials
11.3.3 Product/Services Offered
11.3.4 SWOT Analysis
11.3.5 The SNS View
11.4 RR Donnelley
11.4 Company Overview
11.4.2 Financials
11.4.3 Product/Services Offered
11.4.4 SWOT Analysis
11.4.5 The SNS View
11.5 Transcontinental Inc.
11.5.1 Company Overview
11.5.2 Financials
11.5.3 Product/Services Offered
11.5.4 SWOT Analysis
11.5.5 The SNS View
11.6 LSC Communications US, LLC.
11.6.1 Company Overview
11.6.2 Financials
11.6.3 Product/Services Offered
11.6.4 SWOT Analysis
11.6.5 The SNS View
11.7 Gorham Printing, Inc.
11.7.1 Company Overview
11.7.2 Financials
11.7.3 Product/Services Offered
11.7.4 SWOT Analysis
11.7.5 The SNS View
11.8 Dai Nippon Printing
11.8.1 Company Overview
11.8.2 Financials
11.8.3 Product/Services Offered
11.8.4 SWOT Analysis
11.8.5 The SNS View
11.9 The Magazine Printing Company
11.9.1 Company Overview
11.9.2 Financials
11.9.3 Product/ Services Offered
11.9.4 SWOT Analysis
11.9.5 The SNS View
11.10 Cimpress plc.
11.10.1 Company Overview
11.10.2 Financials
11.10.3 Product/Services Offered
11.10.4 SWOT Analysis
11.10.5 The SNS View
11.11 Siegwerk
11.11.1 Company Overview
11.11.2 Financials
11.11.3 Product/Services Offered
11.11.4 SWOT Analysis
11.11.5 The SNS View
11.12 Toppan
11.12.1 Company Overview
11.12.2 Financials
11.12.3 Product/Services Offered
11.12.4 SWOT Analysis
11.12.5 The SNS View
12. Competitive Landscape
12.1 Competitive Bench marking
12.2 Market Share Analysis
12.3 Recent Developments
12.3.1 Industry News
12.3.2 Company News
12.3.3 Mergers & Acquisitions
13. USE Cases and Best Practices
14. Conclusion
An accurate research report requires proper strategizing as well as implementation. There are multiple factors involved in the completion of good and accurate research report and selecting the best methodology to compete the research is the toughest part. Since the research reports we provide play a crucial role in any company’s decision-making process, therefore we at SNS Insider always believe that we should choose the best method which gives us results closer to reality. This allows us to reach at a stage wherein we can provide our clients best and accurate investment to output ratio.
Each report that we prepare takes a timeframe of 350-400 business hours for production. Starting from the selection of titles through a couple of in-depth brain storming session to the final QC process before uploading our titles on our website we dedicate around 350 working hours. The titles are selected based on their current market cap and the foreseen CAGR and growth.
The 5 steps process:
Step 1: Secondary Research:
Secondary Research or Desk Research is as the name suggests is a research process wherein, we collect data through the readily available information. In this process we use various paid and unpaid databases which our team has access to and gather data through the same. This includes examining of listed companies’ annual reports, Journals, SEC filling etc. Apart from this our team has access to various associations across the globe across different industries. Lastly, we have exchange relationships with various university as well as individual libraries.
Step 2: Primary Research
When we talk about primary research, it is a type of study in which the researchers collect relevant data samples directly, rather than relying on previously collected data. This type of research is focused on gaining content specific facts that can be sued to solve specific problems. Since the collected data is fresh and first hand therefore it makes the study more accurate and genuine.
We at SNS Insider have divided Primary Research into 2 parts.
Part 1 wherein we interview the KOLs of major players as well as the upcoming ones across various geographic regions. This allows us to have their view over the market scenario and acts as an important tool to come closer to the accurate market numbers. As many as 45 paid and unpaid primary interviews are taken from both the demand and supply side of the industry to make sure we land at an accurate judgement and analysis of the market.
This step involves the triangulation of data wherein our team analyses the interview transcripts, online survey responses and observation of on filed participants. The below mentioned chart should give a better understanding of the part 1 of the primary interview.
Part 2: In this part of primary research the data collected via secondary research and the part 1 of the primary research is validated with the interviews from individual consultants and subject matter experts.
Consultants are those set of people who have at least 12 years of experience and expertise within the industry whereas Subject Matter Experts are those with at least 15 years of experience behind their back within the same space. The data with the help of two main processes i.e., FGDs (Focused Group Discussions) and IDs (Individual Discussions). This gives us a 3rd party nonbiased primary view of the market scenario making it a more dependable one while collation of the data pointers.
Step 3: Data Bank Validation
Once all the information is collected via primary and secondary sources, we run that information for data validation. At our intelligence centre our research heads track a lot of information related to the market which includes the quarterly reports, the daily stock prices, and other relevant information. Our data bank server gets updated every fortnight and that is how the information which we collected using our primary and secondary information is revalidated in real time.
Step 4: QA/QC Process
After all the data collection and validation our team does a final level of quality check and quality assurance to get rid of any unwanted or undesired mistakes. This might include but not limited to getting rid of the any typos, duplication of numbers or missing of any important information. The people involved in this process include technical content writers, research heads and graphics people. Once this process is completed the title gets uploader on our platform for our clients to read it.
Step 5: Final QC/QA Process:
This is the last process and comes when the client has ordered the study. In this process a final QA/QC is done before the study is emailed to the client. Since we believe in giving our clients a good experience of our research studies, therefore, to make sure that we do not lack at our end in any way humanly possible we do a final round of quality check and then dispatch the study to the client.
The Super Capacitors Market size was valued at USD 568.71 million in 2023. It is estimated to grow to USD 1388.12 million by 2032 and grow at a CAGR of 11.8% over the forecast period of 2024-2032.
The Smart Lighting Market Size was valued at USD 11.95 billion in 2023, and is expected to reach USD 40.09 billion by 2032, and grow at a CAGR of 14.44% over the forecast period 2024-2032.
The Semi-insulating silicon carbide wafer market size was valued at USD 430.3 million in 2022 and is expected to grow to USD 1753.80 million by 2030 and grow at a CAGR Of 19.3 % over the forecast period of 2023-2030.
The Contraband Detectors Market Size was valued at USD 4.50 billion in 2023 and is expected to reach USD 8.03 billion by 2031 and grow at a CAGR of 7.5% over the forecast period 2024-2031.
The Smart Glass Market Size was valued at USD 10.6 billion in 2023 and is expected to reach USD 25.08 billion growing at a CAGR of 10.2% by Forecast 2032
The Electronic Packaging Market size was valued at USD 1.01 billion in 2023 and is expected to reach USD 4.48 billion by 2032 and grow at a CAGR of 18.02% over the forecast period 2024-2032.
Hi! Click one of our member below to chat on Phone