Sheet Metal Market Report Scope & Overview:
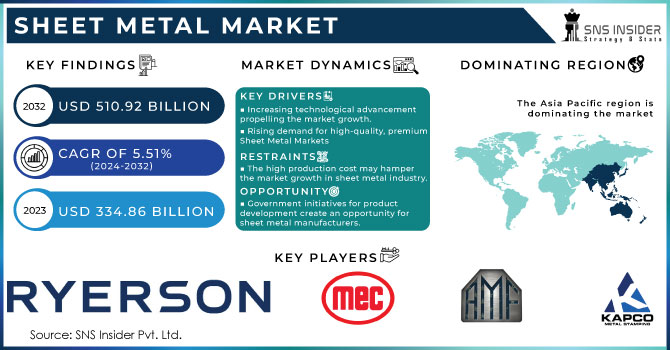
The Sheet Metal Market Size was valued at USD 334.86 billion in 2023 and is expected to reach USD 510.92 billion by 2032 and grow at a CAGR of 5.51% over the forecast period 2024-2032.
Get More Information on Sheet Metal Market - Request Sample Report
One of the most often utilized building materials in the construction industry for a variety of purposes is sheet metal. Increase in the building and construction projects propelling the steel metal market.
As per the United State Census Bureau, construction spending in the U.S. increased by around 4% and reaching 1.29 trillion. In the construction industry, sheet metal is used in various applications such as ductwork, rain gutters, roofing, and others.
Moreover, the growing use of automation in sheet metal manufacturing is one of the major trends in the sheet metal business. Automation has transformed the sheet metal business by boosting the quality and accuracy of sheet metal parts, decreasing labor costs, and increasing production efficiency.
In addition, the market is seeing a sharp increase in demand, especially in premium markets, for new grades of sheet metal and premium components. Leading pioneers in this field, such as Figur G15 and Desktop Metal, Inc., are pushing market research and analysis. Applications for thin or flat stell metal sheets and plates can be found in many different industries, such as the manufacture of fuel-efficient airplanes, commercial aircraft, and automobiles.
The heavy industries are also seeing an increase in demand for Carbon fiber . Lowering the weight of the machine arms in heavy industries can increase productivity and lifespan. This leads to significant savings and an improvement in operational efficiency. An increase in carbon fiber usage drives the sheet metal market growth.
Sheet Metal Market Dynamics
Drivers
-
Increasing technological advancement propelling the market growth.
Sheet metal fabrication is one of the industries that is growing the fastest in the globe. Despite the fact that it is still seen as a traditional strategy, there is currently a spike in the usage of modern technologies. Traditionally, sheet metal production jobs including cutting, machining, welding, and final product assembly were done mostly by hand with manual tools. In the present period, several of these tools have been superseded with simpler yet more sophisticated ones. The advancement of technology and enhanced supply chain procedures are driving the sheet metal fabricating industry.
In addition to digitization's contribution to the development of hard automation techniques, new developments in digital technology have made it possible for "soft" automation procedures to arise. Modern tools and other equipment equipped with sensors will enable manufacturers and workers to monitor and measure nearly all pertinent variables. Another important benefit of digitization is the ability to make decisions based on data. Manufacturing businesses can use enterprise resource planning systems and related technology to evaluate every facet of their operations and efficacy. Initiatives for data interchange and streamlining within particular companies as well as throughout the industry might be supported by this information. The CAGR of the sheet metal market is expected to benefit from these expanding advancements throughout the forecast period.
-
Increasing demand for sustainable construction materials drives the market growth.
-
Rising demand for high-quality, premium Sheet Metal Markets
Restraint
-
The high production cost may hamper the market growth in sheet metal industry.
High labor, tooling, and equipment costs, as well as the influence of extended forming periods on production rate in some applications, are impeding the market's growth. Manufacturers of metal parts are becoming more and more inclined to use additive manufacturing, casting, and forging as manufacturing procedures. The expansion of the sheet metal industry is impacted by these techniques because they offer cheap manufacturing costs, complicated geometries, high production rates, and improved quality.
Opportunities
- Government initiatives for product development create an opportunity for sheet metal manufacturers.
Sheet Metal Market Segmentation Analysis
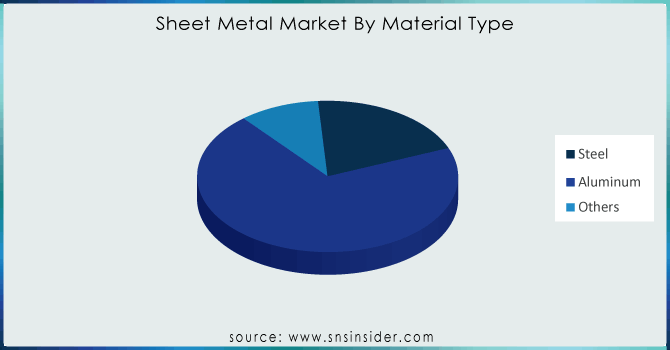
By Material Type
Based on material type segment aluminum held the largest market share around 73.22% in 2023. The automobile, construction, and heavy industries (oil and gas, food processing, chemicals) are among the end-use sectors with the highest demand for steel sheet products. Cookware and kitchenware, sinks, grills, and pans, are made using stainless steel sheets. They are also extensively utilized in washing machines, including pots, countertops, refrigerators, and dishwashers.
The market is anticipated to be driven during the projected period by the growing significance of steel in the building industry as well as infrastructural advancements in both established and developing nations. Aside from this, during the next seven years, there will likely be a significant increase in demand for steel sheet products due to its many advantages, including strength, longevity, durability, affordability, and low maintenance costs.
Get Customized Report as per your Business Requirement - Request For Customized Report
By Application
The building and construction segment held the highest revenue share around 57.54% in 2023. Roofing, walling, and cladding are the key applications in the construction industry. Increasing the use of stainless-steel sheets in the curtain wall and roofing has influenced the market for sheet metals positively. This can be majorly attributed to functional properties and aesthetic appeal offered by stainless steel. The use of numerous stainless-steel alloys in building & construction has witnessed growth over the last few years.
Demand for aluminum roofing sheets is increasing over the upcoming time. The qualities of aluminum metal sheets include resistance to rust, insulation, high resale value, durability, longer lifespan, and lightweight. These items are used in stadiums, parking bays, airports, cladding, residential and commercial roofing, industrial warehouses, sheds, and halls.
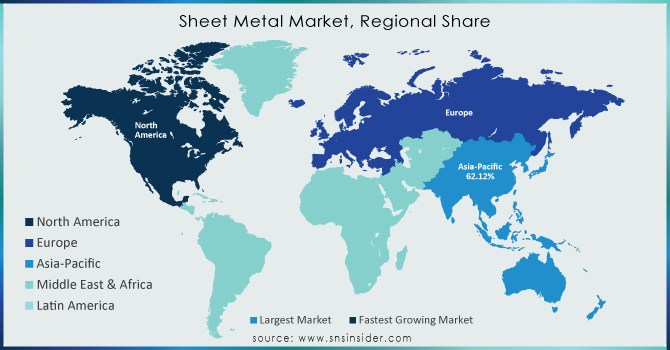
Sheet Metal Market Regional Outlook
Asia Pacific led the sheet metal market with the highest revenue share of around 62.12% in 2023. Factors such as the availability of skilled and low-cost labor, integration across the industry from raw material to end-product stages, and government policies towards encouraging the manufacturing sector in developing nations such as China and India, are propelling regional growth. China held the largest share in the Asia Pacific region with a large concentration of mining operations, metal producers, and makers of metal products, the nation is a center for manufacturing.
Europe held the second largest market share in the sheet metal market. Due to the introduction of innovative, environmentally friendly sheet metal products. It is anticipated that the growing application of sheet metal in a variety of end-use sectors will present the sheet metal market with numerous opportunities for expansion. In addition, the European sheet metal market with the biggest market share belonged to Germany, while the fastest-growing market was the UK.
Key Players
Ryerson Holding Corporation, Classic Sheet Metal, Inc., Ironform Corporation, Kapco Metal Stamping, All Metals Fabricating Inc., Marlin Steel Wire Products LLC, Mayville Engineering Company, Inc., Metcam, Inc., Moreng Metal Products, Inc., Noble Industries, Inc., O’Neal Manufacturing Services., Osh Cut LLC, Standard Iron & Wire Works, Inc., The Metalworking Group, BTD Manufacturing, Dynamic Aerospace and Defense Group (Hydram Engineering), Marlin Steel Wire Products LLC, Noble Industries Inc., and Others.
RECENT DEVELOPMENT
In September 2022, Desktop Metal launched a computerized system to shape standard sheet metal directly from a digital design file. It provides Figur 15 which may help the company to increase its segment.
In April 2022, Nippon Steel introduced ZAM-EX, a line of steel sheets designed especially for international markets that are extremely resistant to corrosion.
| Report Attributes | Details |
| Market Size in 2023 | US$ 334.86 billion |
| Market Size by 2032 | US$ 510.92 Billion |
| CAGR | CAGR of 5.51% From 2024 to 2032 |
| Base Year | 2023 |
| Forecast Period | 2024-2032 |
| Historical Data | 2020-2022 |
| Report Scope & Coverage | Market Size, Segments Analysis, Competitive Landscape, Regional Analysis, DROC & SWOT Analysis, Forecast Outlook |
| Key Segments | • By Material Type (Steel, Aluminum, Others) • By Application (Automotive & Transportation, Building & Construction, Industrial Machinery, Oil & Gas, Others) |
| Regional Analysis/Coverage | North America (US, Canada, Mexico), Europe (Eastern Europe [Poland, Romania, Hungary, Turkey, Rest of Eastern Europe] Western Europe] Germany, France, UK, Italy, Spain, Netherlands, Switzerland, Austria, Rest of Western Europe]), Asia Pacific (China, India, Japan, South Korea, Vietnam, Singapore, Australia, Rest of Asia Pacific), Middle East & Africa (Middle East [UAE, Egypt, Saudi Arabia, Qatar, Rest of Middle East], Africa [Nigeria, South Africa, Rest of Africa], Latin America (Brazil, Argentina, Colombia, Rest of Latin America) |
| Company Profiles | AGC Inc., Fuyao Glass Industry Group Co., Ltd., Nippon Sheet Glass Co., Ltd, Owens Illinois Inc, Koa Glass, Saint Gobain, Amcor, Vitro, S.A.B. DE C.V., Ltd., Sisecam Group, Guardian Industries, Heinz Glass, 3B - the fiberglass company, Nihon Yamamura., Xinyi Glass Holdings Co., Central Glass Co. Ltd., and other players |
| Key Drivers | • Increasing the technological advancement propelling the market growth. |
| Restraints | • The high production cost may hamper the market growth in sheet metal industry. |
Frequently Asked Questions
Ans: The China led the Sheet Metal Market in Asia Pacific region with highest revenue share in 2023.
Ans: Factors such as increasing technology advancement drive the growth for steel meatal market.
Ans: The building & construction segment will grow rapidly in the Sheet Metal Market from 2024-2032.
Ans: The expected CAGR of the global Sheet Metal Market during the forecast period is 5.51%
Ans: USD 510.92 Billion is the projected Sheet Metal Market size of the market by 2032.
Get in Touch
