Compostable Food Service Packaging Market Report Scope & Overview:
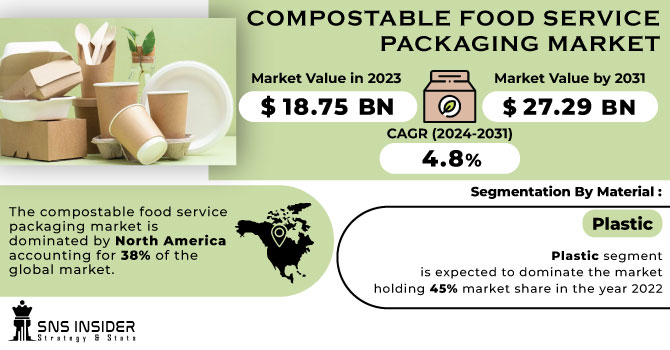
The Compostable Food Service Packaging Market size was USD 18.75 billion in 2023 and is expected to Reach USD 27.29 billion by 2031 and grow at a CAGR of 4.8% over the forecast period of 2024-2031.
Over the next five years, a compound annual growth rate of 3.5% is expected for the percentage growth of chain restaurants and cafes worldwide. People are more often dining out in restaurants and cafés as their disposable income increases. In cities, where there is a growing demand for convenient and affordable food options, more and more people are moving. The demand for fast food and casual dining chains is being driven by consumers who are demanding healthier, more convenient options of food.
Get E-PDF Sample Report on Compostable Food Service Packaging Market - Request Sample Report
The fastest growing region for chain restaurants and cafes is expected to be Asia Pacific, with a compound annual growth rate of 5.2%, and the second fastest growing region for chain restaurants and cafes is expected to be North America, with a compound annual growth rate of 3.2%.
MARKET DYNAMICS
KEY DRIVERS:
-
A growing demand for sustainable solutions
Businesses are also under pressure to adopt more environmentally sound practices and many prefer compostable food packaging as a means of reducing their environmental footprint.
-
A viable solution which can help to reduce waste and safeguard the environment is compostable food service packaging
RESTRAIN:
-
Limited composting infrastructure
There is a lack of good recycling infrastructure, which can make it difficult to properly discard bioplastic packaging across many areas.
-
The cost of composted food service packaging is now higher compared to conventional plastic packaging
OPPORTUNITY:
-
Companies have the opportunity to produce new and innovative compostable packaging for food services
-
The development of a composting infrastructure, which would facilitate the proper disposal of compostable packaging, is an opportunity to invest
CHALLENGES:
-
The compostable food service packaging market is becoming increasingly competitive, which makes it difficult for any one company to stand out
IMPACT OF RUSSIAN UKRAINE WAR:
The main raw materials used for the manufacture of compostable food packaging, such as plastic, paper, are primarily produced in Russia and Ukraine. The war made it difficult for these materials to be supplied, and this has led to massive price increases. For instance, the price of plastic shot up by over 20% since the beginning of the conflict.
In addition, the war caused major disruption in the supply chain of bioplastic packaging for food services. The factors leading to this include port closures, transport delays and an increase in insurance costs. The supply of raw materials and delivery of finished products to customers has been difficult for manufacturers due to these interruptions.
In some regions there is a shortage of compostable food service packaging products, due to the combination of rising raw material price and supply chain disruption. This, in turn, caused some businesses to return to their traditional plastics packaging which has had a negative effect on the development of the biodegradable packaging market.
IMPACT OF ONGOING RECESSION:
In the current recession, as businesses seek more cost-effective alternatives, there is an expected reduction in demand for plastic based biodegradable packaging of food services. The reason is that as the demand for plastic products declines, prices are expected to decline of plastic resin, which is an essential raw material made out of recycled plastics into composite packaging. For instance, the price of polyethylene terephthalate (PET) resin, commonly used in compostable food trays and cups, is projected to decline by 5-10% in the next year.
On the other hand, it is foreseen that demand for biodegradable food service packaging based on paper will be relatively static over the period of recession. As a result, the use of paper as an alternative to plastics has been increasing and consumers have become more interested in paying for eco-friendly products. In addition, given the strong demand for paper products across other sectors such as printing and packaging, prices are expected to remain fairly stable for pulp, which is a key raw material used in Paper Based Compostable Packaging.
In general, depending on the specific type of material applied, there are likely to be different impacts from the recession on the market for Compostable Food Service Packaging. Although demand for plastics based compostable packaging may be declining, it is expected that the demand will continue to remain stable or even increase in paper based compostable packaging. In line with a wider trend of consumers favouring more environmentally and socially appropriate packaging solutions, this is the case.
KEY MARKET SEGMENTS
By Material
-
Plastic
-
Paper
-
Bagasse & Seaweed
Plastic segment is expected to dominate the market holding 45% market share in the year 2022
By Packaging Type
-
Bowls
-
Cutlery
-
Plates
-
Cups
-
Trays
-
Clamshell
-
Pouches & Sachets
-
Others
By End Use
-
Chain Café
-
Non-Chain Café
-
Chain Restaurants
-
Non-Chain Restaurants
-
Independent Sellers
-
Delivery Catering
-
Others
REGIONAL ANALYSIS:
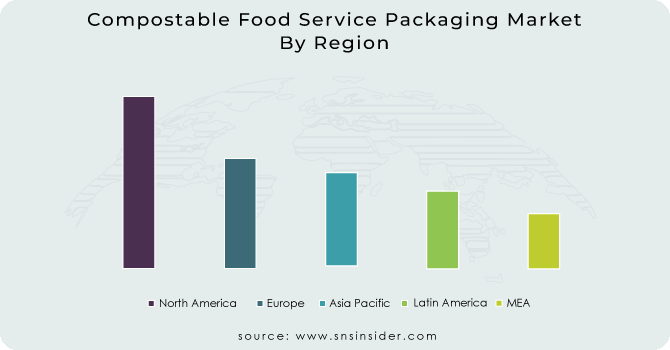
The compostable food service packaging market is dominated by North America, accounting for 38% of the global market. The environmental consequences of packaging waste are becoming more apparent to consumers in North America. The demand for more environmentally responsible packaging solutions, e.g. compostable food containers, has therefore increased.
With a market share of 35%, Europe is the second largest market in terms of composted food service packaging. Similar factors to those in North America include high awareness of the environment as well as stringent government regulations, and a good recycling infrastructure are also behind the European market.
With an 18% market share, the Asia Pacific region is the third biggest market in terms of biodegradable packaging for food services. The Asia Pacific market is projected to experience the highest rate of growth at compound annual growth rates over the forecast period, underpinned by factors like rising disposable income, increased urbanization and awareness about environmental issues.
With a market share of 5% and 4%, respectively, Latin America and the Middle East and Africa represent largely insignificant markets for compostable food service packaging.
Do You Need any Customization Research on Compostable Food Service Packaging Market - Enquire Now
REGIONAL COVERAGE:
North America
-
US
-
Canada
-
Mexico
Europe
-
Eastern Europe
-
Poland
-
Romania
-
Hungary
-
Turkey
-
Rest of Eastern Europe
-
-
Western Europe
-
Germany
-
France
-
UK
-
Italy
-
Spain
-
Netherlands
-
Switzerland
-
Austria
-
Rest of Western Europe
-
Asia Pacific
-
China
-
India
-
Japan
-
South Korea
-
Vietnam
-
Singapore
-
Australia
-
Rest of Asia Pacific
Middle East & Africa
-
Middle East
-
UAE
-
Egypt
-
Saudi Arabia
-
Qatar
-
Rest of Middle East
-
-
Africa
-
Nigeria
-
South Africa
-
Rest of Africa
-
Latin America
-
Brazil
-
Argentina
-
Colombia
-
Rest of Latin America
Key Players
Some major key players in the Compostable Food Service Packaging market are Mondi Group, Berry Global Group, Biopac, Fabrical, Smurfit Kappa Group plc, Westrock Company, Huhtamaki Oyj, Clear Water Paper Corporation, Ultra Green Packaging Inc, Georgia Pacific LLC and other players.
Mondi Group-Company Financial Analysis
RECENT DEVELOPMENT
-
In November 2022, to support its customers' increased demand for paper packaging, Huhtamaki Oyj is expanding the production capacity of Paper Packaging in Spain.
-
Berry Global announced in September 2021 that it was expanding its North American production of food service products to offer more sustainable packaging
| Report Attributes | Details |
| Market Size in 2023 | US$ 18.75 Bn |
| Market Size by 2031 | US$ 27.29 Bn |
| CAGR | CAGR of 4.8% From 2024 to 2031 |
| Base Year | 2023 |
| Forecast Period | 2024-2031 |
| Historical Data | 2020-2022 |
| Report Scope & Coverage | Market Size, Segments Analysis, Competitive Landscape, Regional Analysis, DROC & SWOT Analysis, Forecast Outlook |
| Key Segments | • by Material (Plastic, Paper, Bagasse & Seaweed) • by Packaging Type (Bowls, Cutlery, Plates, Cups, Trays, Clamshell, Pouches & Sachets, Others) • by End Use (Chain Café, Non-Chain Café, Chain Restaurants, Non-Chain Restaurants, Independent Sellers, Delivery Catering, Others) |
| Regional Analysis/Coverage | North America (US, Canada, Mexico), Europe (Eastern Europe [Poland, Romania, Hungary, Turkey, Rest of Eastern Europe] Western Europe] Germany, France, UK, Italy, Spain, Netherlands, Switzerland, Austria, Rest of Western Europe]), Asia Pacific (China, India, Japan, South Korea, Vietnam, Singapore, Australia, Rest of Asia Pacific), Middle East & Africa (Middle East [UAE, Egypt, Saudi Arabia, Qatar, Rest of Middle East], Africa [Nigeria, South Africa, Rest of Africa], Latin America (Brazil, Argentina, Colombia Rest of Latin America) |
| Company Profiles | Mondi Group, Berry Global Group, Biopac, Fabrical, Smurfit Kappa Group plc, Westrock Company, Huhtamaki Oyj, Clear Water Paper Corporation, Ultra Green Packaging Inc, Georgia Pacific LLC |
| Key Drivers | • A growing demand for sustainable solutions • A viable solution which can help to reduce waste and safeguard the environment is compostable food service packaging. |
| Key Restraints | • Limited composting infrastructure • The cost of composted food service packaging is now higher compared to conventional plastic packaging |
Get in Touch
