3D Scanner Market Report Scope & Overview:
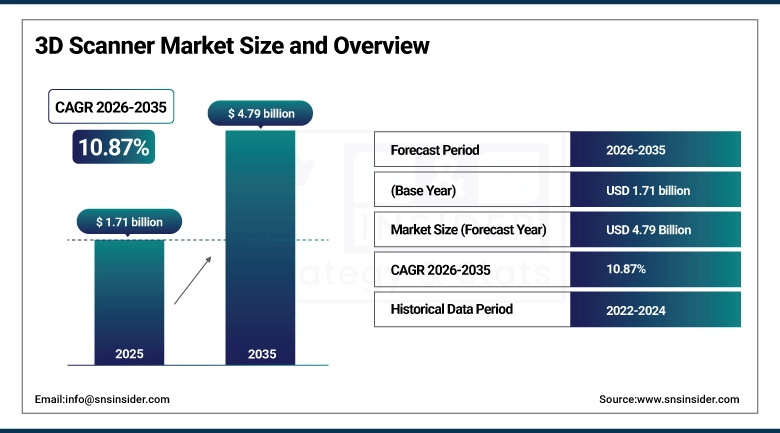
The 3D Scanner Market size was valued at USD 1.54 Billion in 2024 and is projected to reach USD 3.50 Billion by 2032, growing at a CAGR of 10.87% during 2025-2032.
The global 3D scanner market is booming, propelled by increases in the adoption of 3D scanners particularly in the automotive, aerospace, and healthcare industry for precision measurement, quality control and reverse engineering. The growing requirement for accelerated product development, and technological enhancements, such as portable and handheld scanners are enhancing accuracy, efficiency, and flexibility. Such factors are driving global adoption of 3D scanning in industrial and research. As a result, 3D scanning has become a critical tool for modern day production and innovation.
-
Around 75% of dental labs in developed countries now use 3D scanning for custom implants, crowns, and aligners.
-
3D scanning reduces product development cycles by 30–50%, enabling faster prototyping and fewer design errors.

To Get More Information On 3D Scanner Market - Request Free Sample Report
3D Scanner Market Trends:
-
3D scanners are becoming essential in dental, orthopedic, and surgical planning applications, enabling accurate models for diagnostics and treatment.
-
Growing demand for custom implants, prosthetics, and patient-specific surgical guides is fuelling adoption of 3D scanning in healthcare.
-
Enhanced imaging accuracy, reduced patient discomfort, and seamless integration with digital health workflows are accelerating healthcare adoption.
-
Explosive demand for immersive experiences in gaming, entertainment, and simulations is boosting the use of 3D scanning.
-
3D scanners are increasingly integrated with AI and digital platforms to enhance applications in manufacturing, metrology, and content creation.
-
3D scanning is emerging as a cornerstone technology in developing realistic, interactive, and scalable digital ecosystems.
3D Scanner Market Report Highlights:
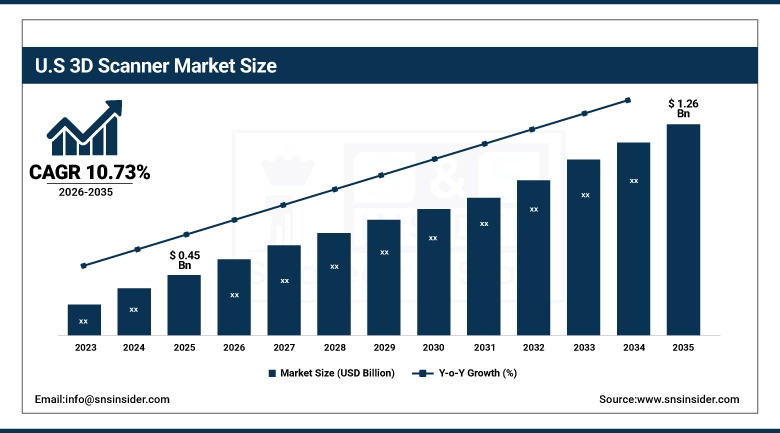
The U.S. 3D Scanner Market size was valued at USD 0.41 Billion in 2024 and is projected to reach USD 0.93 Billion by 2032, growing at a CAGR of 10.73% during 2025-2032. The U.S. market is growing rapidly due to the early increasing adoption of 3D scanners in automotive and aerospace industry, where precision engineering and prototyping play an integral role. The demand is further being propelled by advancements in the healthcare sector in particular for dental and orthopedic applications. Furthermore, such growth is due to the increasing integration of Industry 4.0 technologies, the faster digitization in manufacturing, and various government initiatives promoting technology leaps are driving the demand, thereby, making the U.S. a major region with a high market share for 3D scanners globally.

3D Scanner Market trends emphasize rising adoption across automotive, aerospace, and healthcare, alongside advancements in portable scanning technologies, reverse engineering, and quality control applications driving widespread global demand.
3D Scanner Market Segment Analysis:
-
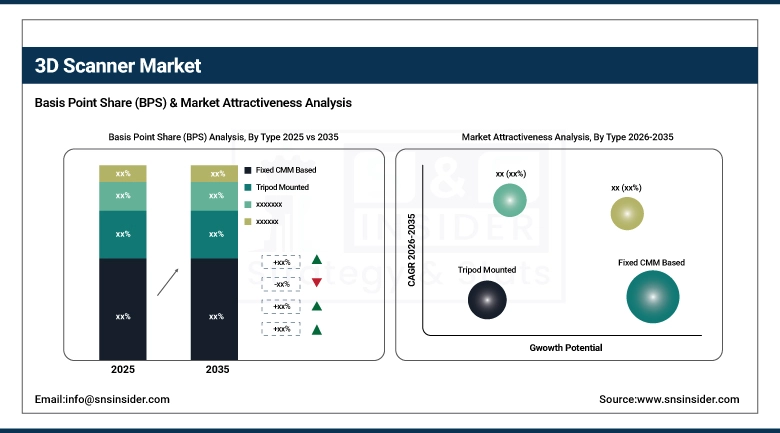
By type, fixed CMM based held the largest share of around 41.20% in 2024, whereas portable CMM is projected to be the fastest-growing segment with a CAGR of 12.26%.
-
By application, the quality control & inspection segment dominated the market with approximately 37.56% share in 2024, whereas virtual simulation segment is expected to register the highest growth with a CAGR of 12.21%.
-
By product, laser scanner accounted for the leading share of nearly 45.25% in 2024, and is anticipated to be the fastest-growing segment with a CAGR of 11.38%.
-
By end-user, the automotive segment led the market with about 42.10% share in 2024, while the healthcare segment is forecasted to grow the fastest at a CAGR of 12.61%.
By Type, Fixed CMM Based Leads Market While Portable CMM Based Registers Fastest Growth
In 2024, Fixed CMM Based 3D scanners accounted for major 3D scanner market share of over 41.20% of the global market, mainly due to their high precision and reliability as compared with other types of 3D scanners in key industrial applications and challenges posed by the automotive and aerospace and defense applications. High-end fixed CMM scanners are offered by companies, such as Hexagon AB, and are the preferred tools for repeatable inspection tasks at superior levels of accuracy. The fastest projected CAGR of 12.26% during 2024–2032 is for scanners based on Portable CMM Based, as they are rapidly gaining popularity due to their ability to be easily handled for on-site work, use less manpower, and real-time accurate scanning.

By Application, Quality Control & Inspection Dominate While Virtual Simulation Shows Rapid Growth
In 2024, Quality Control & Inspection dominated the market with a share of 37.56%, as industries are focusing on eliminating errors during production and emphasizing more on precise manufacturing. Automotive, aerospace, and manufacturing industries cannot do without scanners as they detect defects and validate compliance with stringent standards. Industrial inspection requires 3D scanners to be able to verify an object, making them accurate. Nikon Metrology has dedicated 3D scanners for these use cases. The Virtual Simulation segment visualizes the fastest-growing revenue CAGR of 12.21% during the forecast period 2024–2032 as the demand for digital twin technology, immersive product testing, and simulation-based design is rapidly increasing in various industries looking for innovation and cost optimization.
By Product, Laser Scanner Lead and Registers Fastest Growth
In 2024, Laser Scanner held the largest share of 45.25% in the 3D Scanner Market, on the basis of type as it provides higher accuracy and faster data acquisition, excellent applications in various segments including automotive and architecture. FARO Technologies and others, are well-known companies with advanced laser scanning systems, providing unparalleled detail and accuracy. These scanners are the market leaders typically due to the iteration with which they can accurately capture finely detailed object features. Comprehensive 3D Scanner Market analysis highlights the dominance of laser scanners. Laser Scanners are also expected to grow at the highest CAGR of 11.38% during 2024–2032, owing to increased deployment across industries for large-scale scanning, cultural heritage preservation, and healthcare imaging.
By End-User, Automotive Lead While Healthcare Grows the Fastest
The automotive segment accounted for the largest share of 42.10% in 2024, due to extensive use of scanners for prototyping, design validation, and quality inspection during vehicle production. Many 3D scanning solutions are available in the market by leading players, such as GOM GmbH (Zeiss Group) that are authentically popular among the automakers following its accuracy in components and assembly precision. Among these, healthcare is anticipated to witness the most rapid CAGR of 12.61% over the forecast period of 2024–2032 and is supported by increasing applications in the areas of dental care, orthopedics, and medical imaging. Increasing demand for custom implants and personalized treatments is propelling scanners adoption in this sector.
Asia Pacific 3D Scanner Market Insights:
Asia Pacific is projected to experience the fastest growth during the forecast period of 2024 to 2032, with a CAGR of 11.90%, due to the growth of the manufacturing base in China, India, and Japan. Increasing investments in automotive and electronics industries and government initiatives for industrial digitization are driving the growth of 3D scanning solutions. Market growth is markedly driven by regional players, such as Shining 3D, providing affordable and flexible scanning solutions that drive technology adoption across industries, especially in design, prototyping, and quality inspection applications.

Get Customized Report as Per Your Business Requirement - Enquiry Now
North America 3D Scanner Market Insights:
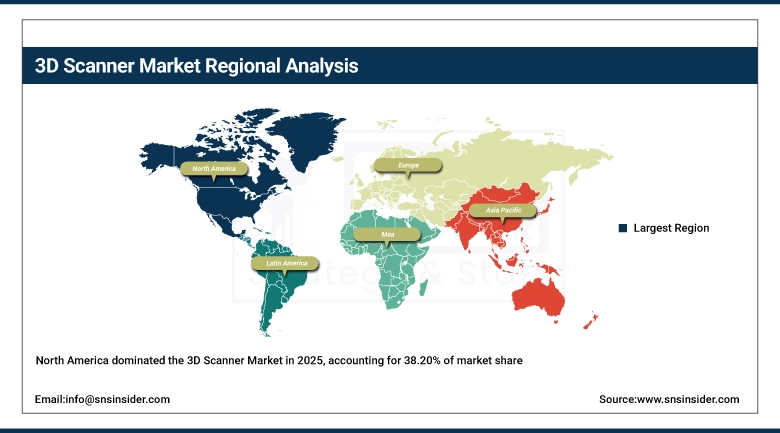
North America led the market with a 38.20% market share in 2024, driven by the increased adoption of block chain technology, the Asia Pacific and Europe follow consecutively. It has state-of-the-art infrastructure, high R&D investments and fast adoption rates of Industry 4.0. The leadership continues in the region through the weight of companies, such as FARO Technologies who are enablers of technology due to unique laser and portable 3D scanning solutions extensively used since years in manufacturing and industrial inspection which is further complimenting the trend toward Industrial digitization.
Europe 3D Scanner Market Insights:
Europe occupies a substantial share of the 3D Scanner Market, promoted by heavy penetration in automotive, aerospace, and healthcare industries Particularly in Germany, France, and the UK, the region boasts advanced manufacturing ecosystems and rich, nourished by high R&D investments. Key players in the assembly metrology market include Nikon Metrology, Zeiss Group, Mitutoyo, and Hexagon, persistently pushing the envelope of metrology technologies to fuel precision engineering, quality control and the digital transformation of the industrial sectors.
Latin America (LATAM) and Middle East & Africa (MEA) 3D Scanner Market Insights:
The Middle East & Africa 3D Scanner Market is expected to gain market growth with the increasing adoption of 3D scanner in the construction, oil & gas and healthcare sectors. The UAE, Saudi Arabia and South Africa are projected to play a noteworthy role in the development of the Middle East & Africa 3D Scanner Market. Led by Brazil and Argentina, Latin America is seeing rising automotive, aerospace and healthcare demand, as global players localize.
3D Scanner Market Growth Drivers:
-
Rising Integration of 3D Scanning with Healthcare Applications Such As Dental, Orthopedic, And Surgical Planning
The digital transformation is rapidly gaining phase across the healthcare system and these 3D scanners are evolving to be one of the fundamental sources in medical fields, such as dental care, orthopedics, and surgical planning. Using this technology, practitioners can create accurate models of bones, teeth, and tissues to improve diagnostics and personalized treatment. Proper scanner adoption in the same pace can be experienced as increase in preference for custom-made implants, prosthetics and also patient-specific surgical guides. In addition to this, increasing image precision, lower patient inconvenience and blending into computerized wellbeing work process is pushing the human services suppliers to receive 3D filtering advancements, which will keep on upholding enduring development in the market throughout the following couple of years.
-
Over 75% of dental restorations globally are now designed with digital scanning and CAD/CAM workflows.
-
3D scanning can lower design and fitting time by nearly 50% compared to traditional methods.
3D Scanner Market Restraints:
-
High Initial Cost of Advanced 3D Scanners and Associated Software Solutions Limiting Adoption Among Small and Medium Enterprises
High 3D scanning systems cost, expensive software, and maintenance costs are making it difficult for small and medium enterprises as well. This results in a slow but steady process of mass adoption, as many SMEs in manufacturing and healthcare are unable to spare budgets for high-end scanners. Though technology has become more prevalent and incredibly efficient in uses, they still require a significant investment which does remain a key restraint until costs continue to decline gradually. Therefore, a relatively low awareness about cost-benefit efficiencies continues to delay the widespread implementation of 3D scanning solutions for small firms.
3D Scanner Market Opportunities:
-
Expanding Role Of 3D Scanning In AR, VR, And Metaverse Applications for Enhanced Visualization and Digital Interaction
The explosive development of AR, VR, and the metaverse offers massive prospects for 3D scanning technologies. Scanners provide these ultra-high fidelity digital copies of these real-world objects and environments, which are essential for the immersive experiences present in gaming, entertainment, and training simulations. AI and Digital Platform Integration 3D scanning is widely adopted and is known by many for its applications in manufacturing and metrology. As demand grows for realistic, interactive digital content, scanners are becoming an essential piece of the puzzle for the next-generation digital ecosystem.
Around 60% of metaverse platforms rely on 3D scanned assets for creating realistic avatars, objects, and environments.
AI-enhanced 3D scanning reduces post-processing time by up to 70%, accelerating asset deployment in virtual platforms.
Competitive Landscape 3D Scanner Market:
FARO Technologies, a U.S.-based leader in 3D measurement solutions for manufacturing, construction and public safety, providing innovative hardware and software scanning solutions. The FARO Focus 3D Laser Scanner provides precision long-range scanning perfect for construction and architecture, whereas the FARO Quantum Max Arm offers portable coordinate measuring for complex parts. FARO is a trusted provider of portable 3D measurement, imaging, and realization solutions, enabling faster workflows and precision inspections and boosting productivity across a range of industries with its award-winning laser-based 3D scanning systems to deliver superior accuracy and efficiency.
-
In May 2024, users began reporting the FARO Orbis, a new approximate USD 55,000 scanner, noted for its extensive use of 3D-printed parts and potential for mobile deployment in challenging environments.
Hexagon AB is a Swedish technology company specializing in digital reality and industrial metrology. The Leica Absolute Tracker AT960 is capable of ultra-precise 3D scanning of massive volumes and is commonly employed in aerospace and automotive industries, while the Leica BLK360 Imaging Laser Scanner is a compact, high-resolution 3D reality capture tool for construction and surveying. Hexagon delivers industries, such as automotive, aerospace and defense, trailblazing capability to execute measure, smart factory and full Industry 4.0 solutions on a global stage with precision and integration with advanced hardware and integrated software solutions.
-
In January 2024, Leica (Hexagon) announced the retirement of the BLK360 G1 and introduced the BLK360 G2, featuring enhanced 4 mm point accuracy, four density settings (Fast to Dense+), and significantly faster scan times, 14 seconds without images and up to 1 minute 37 seconds with HDR panoramic capture.
Nikon Metrology, a division of Nikon Corporation, brings you best-in-class optical and laser-based 3D scanners specially designed for manufacturing and quality assurance and control applications. The ModelMaker H120 3D Scanner offers ultra-fast, portable scanning at unmatched accuracy for automotive and aerospace inspection, and the LC15Dx Laser Scanner provides high-resolution, contactless measurement of small parts. Drawing on its optical pedigree, Nikon provides accuracy and dependability for industrial processes, such as reverse engineering, prototyping, and demanding inspection applications within diverse high-volume industries globally.
-
In April 2024, Nikon IMBU (Industrial Metrology Business Unit) integrated its LC15Dx wireless non-contact laser scanner with AAT3D’s CAPPS NC on-machine metrology software, enabling real-time, in-process inspection directly within machining centers. This integration enhances manufacturing efficiency by facilitating wireless data transfer, reducing setup time, and delivering micron-level scanning accuracy on the shop floor.
GOM GmbH is a Zeiss Group company specializing in leading optical 3D metrology for product development and inspection solutions. The ATOS Q 3D Scanner provides high precision, high resolution scanning, ideal for automotive and aerospace quality control applications, and the GOM ScanCobot integrates scanning within robotic systems to enhance scanning productivity. GOM is renowned for delivering powerful hardware paired with intelligent software to provide accurate digital models, highly efficient workflows, and robust quality checks for industries where accuracy and efficiency are crucial for the manufacturing process.
-
In June 2025, GOM, through its U.S. partner CAPTURE 3D, launched the GOM Scan 1 3D scanner. This compact, affordable scanning solution utilizes blue-light structured light technology, offers mesh editing via GOM Inspect software, and supports measuring volumes up to 400 × 250 mm, ideal for applications ranging from reverse engineering to healthcare.
Creaform is a Canadian company, operating under AMETEK Inc., and a leader in portable 3D measurement technologies. HandySCAN 3D is fast and precise, fully handheld scanning for reverse engineering and quality control while the Go!SCAN 3D can make your 3D model to be easy-to-use and full-color 3D models for product design and healthcare. Creaform supports industries from automotive to medical with high-performance 3D scanning tools, made accessible by their lightweight, mobile design. Specialized in flexibility and accuracy, the company has become a global leader in portable metrology and industrial scanning solutions.
-
In April 2024, Creaform unveiled its updated HandySCAN BLACK+ Elite and redesigned HandySCAN SILVER Series, offering superior accuracy (e.g., 0.020 mm + 0.015 mm/m with the Accu+ Kit), improved scanning volume flexibility, ergonomic enhancements, and full compliance with rigorous ISO/VDI standards.
3D Scanner Market Key Players:
Some of the 3D Scanner Market Companies are:
-
3D Systems Inc.
-
FARO Technologies Inc.
-
Hexagon AB
-
Trimble Inc.
-
Creaform (AMETEK)
-
GOM GmbH
-
Topcon Corporation
-
Maptek Pty Ltd.
-
Autodesk Inc.
-
Artec 3D
-
Nikon Metrology
-
Carl Zeiss Industrial Quality Solutions
-
Konica Minolta Sensing
-
Shining 3D
-
Perceptron (Ametek)
-
Leica Geosystems (Hexagon)
-
Photoneo
-
Peel 3d
-
Revopoint 3D
-
3Shape A/S
Report Attributes | Details |
---|---|
Market Size in 2024 | USD 1.54 Billion |
Market Size by 2032 | USD 3.50 Billon |
CAGR | CAGR of 10.87% From 2025 to 2032 |
Base Year | 2024 |
Forecast Period | 2025-2032 |
Historical Data | 2021-2023 |
Report Scope & Coverage | Market Size, Segments Analysis, Competitive Landscape, Regional Analysis, DROC & SWOT Analysis, Forecast Outlook |
Key Segments | • By Type (Tripod Mounted, Fixed CMM Based, Portable CMM Based and Desktop) • By Application (Reverse Engineering, Quality Control & Inspection, Virtual Simulation and Others) • By Product (Laser Scanner, Structured Light Scanner, Optical Scanner and Others) • By End-User (Automotive, Aerospace & Defense, Healthcare, Architecture & Construction and Other) |
Regional Analysis/Coverage | North America (US, Canada), Europe (Germany, France, UK, Italy, Spain, Poland, Turkey, Rest of Europe), Asia Pacific (China, India, Japan, South Korea, Singapore, Australia, Taiwan, Rest of Asia Pacific), Middle East & Africa (UAE, Saudi Arabia, Qatar, South Africa, Rest of Middle East & Africa), Latin America (Brazil, Argentina, Rest of Latin America) |
Company Profiles | 3D Systems Inc., FARO Technologies Inc., Hexagon AB, Trimble Inc., Creaform (AMETEK), GOM GmbH, Topcon Corporation, Maptek Pty Ltd., Autodesk Inc., Artec 3D, Nikon Metrology, Carl Zeiss Industrial Quality Solutions, Konica Minolta Sensing, Shining 3D, Perceptron, Leica Geosystems, Photoneo, Peel 3d, Revopoint 3D and 3Shape A/S. |
Table Of Contents
1. Introduction
1.1 Market Definition & Scope
1.2 Research Assumptions & Abbreviations
1.3 Research Methodology
2. Executive Summary
2.1 Market Snapshot
2.2 Market Absolute $ Opportunity Assessment & Y-o-Y Analysis, 2021–2032
2.3 Market Size & Forecast, By Segmentation, 2021–2032
2.3.1 Market Size By Type
2.3.2 Market Size By Application
2.3.3 Market Size By Product
2.3.4 Market Size By End-User
2.4 Market Share & Bps Analysis By Region, 2024
2.5 Industry Growth Scenarios – Conservative, Likely & Optimistic
2.6 Industry CxO’s Perspective
3. Market Overview
3.1 Market Dynamics
3.1.1 Drivers
3.1.2 Restraints
3.1.3 Opportunities
3.1.4 Key Market Trends
3.2 Industry PESTLE Analysis
3.3 Key Industry Forces (Porter’s) Impacting Market Growth
3.4 Industry Supply Chain Analysis
3.4.1 Raw Material Suppliers
3.4.2 Manufacturers
3.4.3 Distributors/Suppliers
3.4.4 Customers/End-Users
3.5 Industry Life Cycle Assessment
3.6 Parent Market Overview
3.7 Market Risk Assessment
4. Statistical Insights & Trends Reporting
4.1 Technology Performance Statistics
4.1.1 Average scanning accuracy (microns/mm) across handheld, desktop, and industrial scanners
4.1.2 Average scan speed (points captured per second or frames per second)
4.1.3 Adoption share of structured light, laser, and photogrammetry scanners (%)
4.1.4 Range capability distribution (short-range <1m, mid-range 1–10m, long-range >10m)
4.2 Data Generation & Processing Insights
4.2.1 Average 3D scan data file size (MB/GB per scan) by application
4.2.2 Average scan-to-CAD processing time (minutes/hours per model)
4.2.3 Adoption ratio of cloud-based vs. on-premise 3D data processing (%)
4.2.4 Storage demand per project by industry (manufacturing, healthcare, heritage, aerospace)
4.3 Pricing & Cost Benchmarks
4.3.1 Average selling price (ASP) of 3D scanners by category (handheld, desktop, industrial)
4.3.2 Cost-per-scan benchmark (including hardware, software, and operator costs)
4.3.3 Decline rate (%) in 3D scanner prices over the last decade
4.3.4 Outsourcing cost per scan/project at 3D scanning service bureaus
4.4 Operational & Manufacturing Statistics
4.4.1 Global production capacity (in units per year) of 3D scanners by major manufacturers
4.4.2 Average product lifecycle/replacement cycle (years) of 3D scanners
4.4.3 Mean Time Between Failures (MTBF) of industrial-grade scanners (hours/years)
4.4.4 Regional concentration (%) of scanner manufacturing (China, Germany, U.S., Japan)
4.5 Distribution & Sales Metrics
4.5.1 Sales share by channel (direct OEM, distributors, online platforms)
4.5.2 Share of demand from government projects vs. private sector (%)
4.5.3 Dealer/partner network size of leading 3D scanner brands
4.5.4 Export/import share of 3D scanners by major regions
4.6 Integration & Ecosystem Statistics
4.6.1 Share of 3D scanners integrated with CAD/CAM software directly (%)
4.6.2 Adoption of scanners embedded in robotic arms or automated systems (%)
4.6.3 % of scanners connected with AR/VR or metaverse applications
4.6.4 Adoption of AI-powered post-processing in 3D scanning workflows (%)
4.7 Future Outlook & Emerging Trends
4.7.1 Forecast share of wireless/mobile 3D scanners in total shipments (%)
4.7.2 Predicted CAGR of AI-driven automated 3D scanning solutions
4.7.3 Share of 3D scanning integrated with additive manufacturing workflows (%)
4.7.4 Anticipated adoption rate of 3D scanning for digital twins and smart factories (%)
5. 3D Scanner Market Segmental Analysis & Forecast, By Type, 2021 – 2032, Value (Usd Billion)
5.1 Introduction
5.2 Tripod Mounted
5.2.1 Key Trends
5.2.2 Market Size & Forecast, 2021 – 2032
5.3 Fixed CMM Based
5.3.1 Key Trends
5.3.2 Market Size & Forecast, 2021 – 2032
5.4 Portable CMM Based
5.4.1 Key Trends
5.4.2 Market Size & Forecast, 2021 – 2032
5.5 Desktop
5.5.1 Key Trends
5.5.2 Market Size & Forecast, 2021 – 2032
6. 3D Scanner Market Segmental Analysis & Forecast, By Application, 2021 – 2032, Value (Usd Billion)
6.1 Introduction
6.2 Reverse Engineering
6.2.1 Key Trends
6.2.2 Market Size & Forecast, 2021 – 2032
6.3 Quality Control & Inspection
6.3.1 Key Trends
6.3.2 Market Size & Forecast, 2021 – 2032
6.4 Virtual Simulation
6.4.1 Key Trends
6.4.2 Market Size & Forecast, 2021 – 2032
6.5 Others
6.5.1 Key Trends
6.5.2 Market Size & Forecast, 2021 – 2032
7. 3D Scanner Market Segmental Analysis & Forecast, By Product, 2021 – 2032, Value (Usd Billion)
7.1 Introduction
7.2 Laser Scanner
7.2.1 Key Trends
7.2.2 Market Size & Forecast, 2021 – 2032
7.3 Structured Light Scanner
7.3.1 Key Trends
7.3.2 Market Size & Forecast, 2021 – 2032
7.4 Optical Scanner
7.4.1 Key Trends
7.4.2 Market Size & Forecast, 2021 – 2032
7.5 Others
7.5.1 Key Trends
7.5.2 Market Size & Forecast, 2021 – 2032
8. 3D Scanner Market Segmental Analysis & Forecast, By End-User, 2021 – 2032, Value (Usd Billion)
8.1 Introduction
8.2 Automotive
8.2.1 Key Trends
8.2.2 Market Size & Forecast, 2021 – 2032
8.3 Aerospace & Defense
8.3.1 Key Trends
8.3.2 Market Size & Forecast, 2021 – 2032
8.4 Healthcare
8.4.1 Key Trends
8.4.2 Market Size & Forecast, 2021 – 2032
8.5 Architecture & Construction
8.5.1 Key Trends
8.5.2 Market Size & Forecast, 2021 – 2032
8.6 Others
8.6.1 Key Trends
8.6.2 Market Size & Forecast, 2021 – 2032
9. 3D Scanner Market Segmental Analysis & Forecast By Region, 2021 – 2025, Value (Usd Billion)
9.1 Introduction
9.2 North America
9.2.1 Key Trends
9.2.2 3D Scanner Market Size & Forecast, By Type, 2021 – 2032
9.2.3 3D Scanner Market Size & Forecast, By Application, 2021 – 2032
9.2.4 3D Scanner Market Size & Forecast, By Product, 2021 – 2032
9.2.5 3D Scanner Market Size & Forecast, By End-User, 2021 – 2032
9.2.6 3D Scanner Market Size & Forecast, By Country, 2021 – 2032
9.2.6.1 USA
9.2.6.1.1 3D Scanner Market Size & Forecast, By Type, 2021 – 2032
9.2.6.1.2 3D Scanner Market Size & Forecast, By Application, 2021 – 2032
9.2.6.1.3 3D Scanner Market Size & Forecast, By Product, 2021 – 2032
9.2.6.1.4 3D Scanner Market Size & Forecast, By End-User, 2021 – 2032
9.2.6.2 Canada
9.2.6.2.1 3D Scanner Market Size & Forecast, By Type, 2021 – 2032
9.2.6.2.2 3D Scanner Market Size & Forecast, By Application, 2021 – 2032
9.2.6.2.3 3D Scanner Market Size & Forecast, By Product, 2021 – 2032
9.2.6.2.4 3D Scanner Market Size & Forecast, By End-User, 2021 – 2032
9.3 Europe
9.3.1 Key Trends
9.3.2 3D Scanner Market Size & Forecast, By Type, 2021 – 2032
9.3.3 3D Scanner Market Size & Forecast, By Application, 2021 – 2032
9.3.4 3D Scanner Market Size & Forecast, By Product, 2021 – 2032
9.3.5 3D Scanner Market Size & Forecast, By End-User, 2021 – 2032
9.3.6 3D Scanner Market Size & Forecast, By Country, 2021 – 2032
9.3.6.1 Germany
9.3.6.1.1 3D Scanner Market Size & Forecast, By Type, 2021 – 2032
9.3.6.1.2 3D Scanner Market Size & Forecast, By Application, 2021 – 2032
9.3.6.1.3 3D Scanner Market Size & Forecast, By Product, 2021 – 2032
9.3.6.1.4 3D Scanner Market Size & Forecast, By End-User, 2021 – 2032
9.3.6.2 UK
9.3.6.2.1 3D Scanner Market Size & Forecast, By Type, 2021 – 2032
9.3.6.2.2 3D Scanner Market Size & Forecast, By Application, 2021 – 2032
9.3.6.2.3 3D Scanner Market Size & Forecast, By Product, 2021 – 2032
9.3.6.2.4 3D Scanner Market Size & Forecast, By End-User, 2021 – 2032
9.3.6.3 France
9.3.6.3.1 3D Scanner Market Size & Forecast, By Type, 2021 – 2032
9.3.6.3.2 3D Scanner Market Size & Forecast, By Application, 2021 – 2032
9.3.6.3.3 3D Scanner Market Size & Forecast, By Product, 2021 – 2032
9.3.6.3.4 3D Scanner Market Size & Forecast, By End-User, 2021 – 2032
9.3.6.4 Italy
9.3.6.4.1 3D Scanner Market Size & Forecast, By Type, 2021 – 2032
9.3.6.4.2 3D Scanner Market Size & Forecast, By Application, 2021 – 2032
9.3.6.4.3 3D Scanner Market Size & Forecast, By Product, 2021 – 2032
9.3.6.4.4 3D Scanner Market Size & Forecast, By End-User, 2021 – 2032
9.3.6.5 Spain
9.3.6.5.1 3D Scanner Market Size & Forecast, By Type, 2021 – 2032
9.3.6.5.2 3D Scanner Market Size & Forecast, By Application, 2021 – 2032
9.3.6.5.3 3D Scanner Market Size & Forecast, By Product, 2021 – 2032
9.3.6.5.4 3D Scanner Market Size & Forecast, By End-User, 2021 – 2032
9.3.6.6 Russia
9.3.6.6.1 3D Scanner Market Size & Forecast, By Type, 2021 – 2032
9.3.6.6.2 3D Scanner Market Size & Forecast, By Application, 2021 – 2032
9.3.6.6.3 3D Scanner Market Size & Forecast, By Product, 2021 – 2032
9.3.6.6.4 3D Scanner Market Size & Forecast, By End-User, 2021 – 2032
9.3.6.7 Poland
9.3.6.7.1 3D Scanner Market Size & Forecast, By Type, 2021 – 2032
9.3.6.7.2 3D Scanner Market Size & Forecast, By Application, 2021 – 2032
9.3.6.7.3 3D Scanner Market Size & Forecast, By Product, 2021 – 2032
9.3.6.7.4 3D Scanner Market Size & Forecast, By End-User, 2021 – 2032
9.3.6.8 Rest of Europe
9.3.6.8.1 3D Scanner Market Size & Forecast, By Type, 2021 – 2032
9.3.6.8.2 3D Scanner Market Size & Forecast, By Application, 2021 – 2032
9.3.6.8.3 3D Scanner Market Size & Forecast, By Product, 2021 – 2032
9.3.6.8.4 3D Scanner Market Size & Forecast, By End-User, 2021 – 2032
9.4 Asia-Pacific
9.4.1 Key Trends
9.4.2 3D Scanner Market Size & Forecast, By Type, 2021 – 2032
9.4.3 3D Scanner Market Size & Forecast, By Application, 2021 – 2032
9.4.4 3D Scanner Market Size & Forecast, By Product, 2021 – 2032
9.4.5 3D Scanner Market Size & Forecast, By End-User, 2021 – 2032
9.4.6 3D Scanner Market Size & Forecast, By Country, 2021 – 2032
9.4.6.1 China
9.4.6.1.1 3D Scanner Market Size & Forecast, By Type, 2021 – 2032
9.4.6.1.2 3D Scanner Market Size & Forecast, By Application, 2021 – 2032
9.4.6.1.3 3D Scanner Market Size & Forecast, By Product, 2021 – 2032
9.4.6.1.4 3D Scanner Market Size & Forecast, By End-User, 2021 – 2032
9.4.6.2 India
9.4.6.2.1 3D Scanner Market Size & Forecast, By Type, 2021 – 2032
9.4.6.2.2 3D Scanner Market Size & Forecast, By Application, 2021 – 2032
9.4.6.2.3 3D Scanner Market Size & Forecast, By Product, 2021 – 2032
9.4.6.2.4 3D Scanner Market Size & Forecast, By End-User, 2021 – 2032
9.4.6.3 Japan
9.4.6.3.1 3D Scanner Market Size & Forecast, By Type, 2021 – 2032
9.4.6.3.2 3D Scanner Market Size & Forecast, By Application, 2021 – 2032
9.4.6.3.3 3D Scanner Market Size & Forecast, By Product, 2021 – 2032
9.4.6.3.4 3D Scanner Market Size & Forecast, By End-User, 2021 – 2032
9.4.6.4 South Korea
9.4.6.4.1 3D Scanner Market Size & Forecast, By Type, 2021 – 2032
9.4.6.4.2 3D Scanner Market Size & Forecast, By Application, 2021 – 2032
9.4.6.4.3 3D Scanner Market Size & Forecast, By Product, 2021 – 2032
9.4.6.4.4 3D Scanner Market Size & Forecast, By End-User, 2021 – 2032
9.4.6.5 Australia
9.4.6.5.1 3D Scanner Market Size & Forecast, By Type, 2021 – 2032
9.4.6.5.2 3D Scanner Market Size & Forecast, By Application, 2021 – 2032
9.4.6.5.3 3D Scanner Market Size & Forecast, By Product, 2021 – 2032
9.4.6.5.4 3D Scanner Market Size & Forecast, By End-User, 2021 – 2032
9.4.6.6 ASEAN Countries
9.4.6.6.1 3D Scanner Market Size & Forecast, By Type, 2021 – 2032
9.4.6.6.2 3D Scanner Market Size & Forecast, By Application, 2021 – 2032
9.4.6.6.3 3D Scanner Market Size & Forecast, By Product, 2021 – 2032
9.4.6.6.4 3D Scanner Market Size & Forecast, By End-User, 2021 – 2032
9.4.6.7 Rest of Asia-Pacific
9.4.6.7.1 3D Scanner Market Size & Forecast, By Type, 2021 – 2032
9.4.6.7.2 3D Scanner Market Size & Forecast, By Application, 2021 – 2032
9.4.6.7.3 3D Scanner Market Size & Forecast, By Product, 2021 – 2032
9.4.6.7.4 3D Scanner Market Size & Forecast, By End-User, 2021 – 2032
9.5 Latin America
9.5.1 Key Trends
9.5.2 3D Scanner Market Size & Forecast, By Type, 2021 – 2032
9.5.3 3D Scanner Market Size & Forecast, By Application, 2021 – 2032
9.5.4 3D Scanner Market Size & Forecast, By Product, 2021 – 2032
9.5.5 3D Scanner Market Size & Forecast, By End-User, 2021 – 2032
9.5.6 3D Scanner Market Size & Forecast, By Country, 2021 – 2032
9.5.6.1 Brazil
9.5.6.1.1 3D Scanner Market Size & Forecast, By Type, 2021 – 2032
9.5.6.1.2 3D Scanner Market Size & Forecast, By Application, 2021 – 2032
9.5.6.1.3 3D Scanner Market Size & Forecast, By Product, 2021 – 2032
9.5.6.1.4 3D Scanner Market Size & Forecast, By End-User, 2021 – 2032
9.5.6.2 Argentina
9.5.6.2.1 3D Scanner Market Size & Forecast, By Type, 2021 – 2032
9.5.6.2.2 3D Scanner Market Size & Forecast, By Application, 2021 – 2032
9.5.6.2.3 3D Scanner Market Size & Forecast, By Product, 2021 – 2032
9.5.6.2.4 3D Scanner Market Size & Forecast, By End-User, 2021 – 2032
9.5.6.3 Mexico
9.5.6.3.1 3D Scanner Market Size & Forecast, By Type, 2021 – 2032
9.5.6.3.2 3D Scanner Market Size & Forecast, By Application, 2021 – 2032
9.5.6.3.3 3D Scanner Market Size & Forecast, By Product, 2021 – 2032
9.5.6.3.4 3D Scanner Market Size & Forecast, By End-User, 2021 – 2032
9.5.6.4 Colombia
9.5.6.4.1 3D Scanner Market Size & Forecast, By Type, 2021 – 2032
9.5.6.4.2 3D Scanner Market Size & Forecast, By Application, 2021 – 2032
9.5.6.4.3 3D Scanner Market Size & Forecast, By Product, 2021 – 2032
9.5.6.4.4 3D Scanner Market Size & Forecast, By End-User, 2021 – 2032
9.5.6.5 Rest of Latin America
9.5.6.5.1 3D Scanner Market Size & Forecast, By Type, 2021 – 2032
9.5.6.5.2 3D Scanner Market Size & Forecast, By Application, 2021 – 2032
9.5.6.5.3 3D Scanner Market Size & Forecast, By Product, 2021 – 2032
9.5.6.5.4 3D Scanner Market Size & Forecast, By End-User, 2021 – 2032
9.6 Middle East & Africa
9.6.1 Key Trends
9.6.2 3D Scanner Market Size & Forecast, By Type, 2021 – 2032
9.6.3 3D Scanner Market Size & Forecast, By Application, 2021 – 2032
9.6.4 3D Scanner Market Size & Forecast, By Product, 2021 – 2032
9.6.5 3D Scanner Market Size & Forecast, By End-User, 2021 – 2032
9.6.6 3D Scanner Market Size & Forecast, By Country, 2021 – 2032
9.6.6.1 UAE
9.6.6.1.1 3D Scanner Market Size & Forecast, By Type, 2021 – 2032
9.6.6.1.2 3D Scanner Market Size & Forecast, By Application, 2021 – 2032
9.6.6.1.3 3D Scanner Market Size & Forecast, By Product, 2021 – 2032
9.6.6.1.4 3D Scanner Market Size & Forecast, By End-User, 2021 – 2032
9.6.6.2 Saudi Arabia
9.6.6.2.1 3D Scanner Market Size & Forecast, By Type, 2021 – 2032
9.6.6.2.2 3D Scanner Market Size & Forecast, By Application, 2021 – 2032
9.6.6.2.3 3D Scanner Market Size & Forecast, By Product, 2021 – 2032
9.6.6.2.4 3D Scanner Market Size & Forecast, By End-User, 2021 – 2032
9.6.6.3 Qatar
9.6.6.3.1 3D Scanner Market Size & Forecast, By Type, 2021 – 2032
9.6.6.3.2 3D Scanner Market Size & Forecast, By Application, 2021 – 2032
9.6.6.3.3 3D Scanner Market Size & Forecast, By Product, 2021 – 2032
9.6.6.3.4 3D Scanner Market Size & Forecast, By End-User, 2021 – 2032
9.6.6.4 Egypt
9.6.6.4.1 3D Scanner Market Size & Forecast, By Type, 2021 – 2032
9.6.6.4.2 3D Scanner Market Size & Forecast, By Application, 2021 – 2032
9.6.6.4.3 3D Scanner Market Size & Forecast, By Product, 2021 – 2032
9.6.6.4.4 3D Scanner Market Size & Forecast, By End-User, 2021 – 2032
9.6.6.5 South Africa
9.6.6.5.1 3D Scanner Market Size & Forecast, By Type, 2021 – 2032
9.6.6.5.2 3D Scanner Market Size & Forecast, By Application, 2021 – 2032
9.6.6.5.3 3D Scanner Market Size & Forecast, By Product, 2021 – 2032
9.6.6.5.4 3D Scanner Market Size & Forecast, By End-User, 2021 – 2032
9.6.6.6 Rest of Middle East & Africa
9.6.6.6.1 3D Scanner Market Size & Forecast, By Type, 2021 – 2032
9.6.6.6.2 3D Scanner Market Size & Forecast, By Application, 2021 – 2032
9.6.6.6.3 3D Scanner Market Size & Forecast, By Product, 2021 – 2032
9.6.6.6.4 3D Scanner Market Size & Forecast, By End-User, 2021 – 2032
10. Competitive Landscape
10.1 Key Players' Positioning
10.2 Competitive Developments
10.2.1 Key Strategies Adopted (%), By Key Players, 2024
10.2.2 Year-Wise Strategies & Development, 2021 – 2025
10.2.3 Number Of Strategies Adopted By Key Players, 2024
10.3 Market Share Analysis, 2024
10.4 Product/Service & Application Benchmarking
10.4.1 Product/Service Specifications & Features By Key Players
10.4.2 Product/Service Heatmap By Key Players
10.4.3 Application Heatmap By Key Players
10.5 Industry Start-Up & Innovation Landscape
10.6 Key Company Profiles
10.6.1 3D Systems Inc.
10.6.1.1 Company Overview & Snapshot
10.6.1.2 Product/Service Portfolio
10.6.1.3 Key Company Financials
10.6.1.4 SWOT Analysis
10.6.2 FARO Technologies Inc.
10.6.2.1 Company Overview & Snapshot
10.6.2.2 Product/Service Portfolio
10.6.2.3 Key Company Financials
10.6.2.4 SWOT Analysis
10.6.3 Hexagon AB
10.6.3.1 Company Overview & Snapshot
10.6.3.2 Product/Service Portfolio
10.6.3.3 Key Company Financials
10.6.3.4 SWOT Analysis
10.6.4 Trimble Inc.
10.6.4.1 Company Overview & Snapshot
10.6.4.2 Product/Service Portfolio
10.6.4.3 Key Company Financials
10.6.4.4 SWOT Analysis
10.6.5 Creaform
10.6.5.1 Company Overview & Snapshot
10.6.5.2 Product/Service Portfolio
10.6.5.3 Key Company Financials
10.6.5.4 SWOT Analysis
10.6.6 GOM GmbH
10.6.6.1 Company Overview & Snapshot
10.6.6.2 Product/Service Portfolio
10.6.6.3 Key Company Financials
10.6.6.4 SWOT Analysis
10.6.7 Topcon Corporation
10.6.7.1 Company Overview & Snapshot
10.6.7.2 Product/Service Portfolio
10.6.7.3 Key Company Financials
10.6.7.4 SWOT Analysis
10.6.8 Maptek Pty Ltd.
10.6.8.1 Company Overview & Snapshot
10.6.8.2 Product/Service Portfolio
10.6.8.3 Key Company Financials
10.6.8.4 SWOT Analysis
10.6.9 Autodesk Inc.
10.6.9.1 Company Overview & Snapshot
10.6.9.2 Product/Service Portfolio
10.6.9.3 Key Company Financials
10.6.9.4 SWOT Analysis
10.6.10 Artec 3D
10.6.10.1 Company Overview & Snapshot
10.6.10.2 Product/Service Portfolio
10.6.10.3 Key Company Financials
10.6.10.4 SWOT Analysis
10.6.11 Nikon Metrology
10.6.11.1 Company Overview & Snapshot
10.6.11.2 Product/Service Portfolio
10.6.11.3 Key Company Financials
10.6.11.4 SWOT Analysis
10.6.12 Carl Zeiss Industrial Quality Solutions
10.6.12.1 Company Overview & Snapshot
10.6.12.2 Product/Service Portfolio
10.6.12.3 Key Company Financials
10.6.12.4 SWOT Analysis
10.6.13 Konica Minolta Sensing
10.6.13.1 Company Overview & Snapshot
10.6.13.2 Product/Service Portfolio
10.6.13.3 Key Company Financials
10.6.13.4 SWOT Analysis
10.6.14 Shining 3D
10.6.14.1 Company Overview & Snapshot
10.6.14.2 Product/Service Portfolio
10.6.14.3 Key Company Financials
10.6.14.4 SWOT Analysis
10.6.15 Perceptron
10.6.15.1 Company Overview & Snapshot
10.6.15.2 Product/Service Portfolio
10.6.15.3 Key Company Financials
10.6.15.4 SWOT Analysis
10.6.16 Leica Geosystems
10.6.16.1 Company Overview & Snapshot
10.6.16.2 Product/Service Portfolio
10.6.16.3 Key Company Financials
10.6.16.4 SWOT Analysis
10.6.17 Photoneo
10.6.17.1 Company Overview & Snapshot
10.6.17.2 Product/Service Portfolio
10.6.17.3 Key Company Financials
10.6.17.4 SWOT Analysis
10.6.18 Peel 3d
10.6.18.1 Company Overview & Snapshot
10.6.18.2 Product/Service Portfolio
10.6.18.3 Key Company Financials
10.6.18.4 SWOT Analysis
10.6.19 Revopoint 3D
10.6.19.1 Company Overview & Snapshot
10.6.19.2 Product/Service Portfolio
10.6.19.3 Key Company Financials
10.6.19.4 SWOT Analysis
10.6.20 3Shape A/S
10.6.20.1 Company Overview & Snapshot
10.6.20.2 Product/Service Portfolio
10.6.20.3 Key Company Financials
10.6.20.4 SWOT Analysis
11. Analyst Recommendations
11.1 SNS Insider Opportunity Map
11.2 Industry Low-Hanging Fruit Assessment
11.3 Market Entry & Growth Strategy
11.4 Analyst Viewpoint & Suggestions On Market Growth
12. Assumptions
13. Disclaimer
14. Appendix
14.1 List Of Tables
14.2 List Of Figures
Key Segments:
By Type
-
Tripod Mounted
-
Fixed CMM Based
-
Portable CMM Based
-
Desktop
By Application
-
Reverse Engineering
-
Quality Control & Inspection
-
Virtual Simulation
-
Others
By Product
-
Laser Scanner
-
Structured Light Scanner
-
Optical Scanner
-
Others
By End-User
-
Automotive
-
Aerospace & Defense
-
Healthcare
-
Architecture & Construction
-
Other
Request for Segment Customization as per your Business Requirement: Segment Customization Request
Regional Coverage:
North America
-
US
-
Canada
Europe
-
Germany
-
UK
-
France
-
Italy
-
Spain
-
Russia
-
Poland
-
Rest of Europe
Asia Pacific
-
China
-
India
-
Japan
-
South Korea
-
Australia
-
ASEAN Countries
-
Rest of Asia Pacific
Middle East & Africa
-
UAE
-
Saudi Arabia
-
Qatar
-
South Africa
-
Rest of Middle East & Africa
Latin America
-
Brazil
-
Argentina
-
Mexico
-
Colombia
-
Rest of Latin America
Request for Country Level Research Report: Country Level Customization Request
Available Customization
With the given market data, SNS Insider offers customization as per the company’s specific needs. The following customization options are available for the report:
-
Detailed Volume Analysis
-
Criss-Cross segment analysis (e.g. Product X Application)
-
Competitive Product Benchmarking
-
Geographic Analysis
-
Additional countries in any of the regions
-
Customized Data Representation
-
Detailed analysis and profiling of additional market players
An accurate research report requires proper strategizing as well as implementation. There are multiple factors involved in the completion of good and accurate research report and selecting the best methodology to compete the research is the toughest part. Since the research reports we provide play a crucial role in any company’s decision-making process, therefore we at SNS Insider always believe that we should choose the best method which gives us results closer to reality. This allows us to reach at a stage wherein we can provide our clients best and accurate investment to output ratio.
Each report that we prepare takes a timeframe of 350-400 business hours for production. Starting from the selection of titles through a couple of in-depth brain storming session to the final QC process before uploading our titles on our website we dedicate around 350 working hours. The titles are selected based on their current market cap and the foreseen CAGR and growth.
The 5 steps process:
Step 1: Secondary Research:
Secondary Research or Desk Research is as the name suggests is a research process wherein, we collect data through the readily available information. In this process we use various paid and unpaid databases which our team has access to and gather data through the same. This includes examining of listed companies’ annual reports, Journals, SEC filling etc. Apart from this our team has access to various associations across the globe across different industries. Lastly, we have exchange relationships with various university as well as individual libraries.

Step 2: Primary Research
When we talk about primary research, it is a type of study in which the researchers collect relevant data samples directly, rather than relying on previously collected data. This type of research is focused on gaining content specific facts that can be sued to solve specific problems. Since the collected data is fresh and first hand therefore it makes the study more accurate and genuine.
We at SNS Insider have divided Primary Research into 2 parts.
Part 1 wherein we interview the KOLs of major players as well as the upcoming ones across various geographic regions. This allows us to have their view over the market scenario and acts as an important tool to come closer to the accurate market numbers. As many as 45 paid and unpaid primary interviews are taken from both the demand and supply side of the industry to make sure we land at an accurate judgement and analysis of the market.
This step involves the triangulation of data wherein our team analyses the interview transcripts, online survey responses and observation of on filed participants. The below mentioned chart should give a better understanding of the part 1 of the primary interview.

Part 2: In this part of primary research the data collected via secondary research and the part 1 of the primary research is validated with the interviews from individual consultants and subject matter experts.
Consultants are those set of people who have at least 12 years of experience and expertise within the industry whereas Subject Matter Experts are those with at least 15 years of experience behind their back within the same space. The data with the help of two main processes i.e., FGDs (Focused Group Discussions) and IDs (Individual Discussions). This gives us a 3rd party nonbiased primary view of the market scenario making it a more dependable one while collation of the data pointers.
Step 3: Data Bank Validation
Once all the information is collected via primary and secondary sources, we run that information for data validation. At our intelligence centre our research heads track a lot of information related to the market which includes the quarterly reports, the daily stock prices, and other relevant information. Our data bank server gets updated every fortnight and that is how the information which we collected using our primary and secondary information is revalidated in real time.

Step 4: QA/QC Process
After all the data collection and validation our team does a final level of quality check and quality assurance to get rid of any unwanted or undesired mistakes. This might include but not limited to getting rid of the any typos, duplication of numbers or missing of any important information. The people involved in this process include technical content writers, research heads and graphics people. Once this process is completed the title gets uploader on our platform for our clients to read it.
Step 5: Final QC/QA Process:
This is the last process and comes when the client has ordered the study. In this process a final QA/QC is done before the study is emailed to the client. Since we believe in giving our clients a good experience of our research studies, therefore, to make sure that we do not lack at our end in any way humanly possible we do a final round of quality check and then dispatch the study to the client.