image

Consumer IoT Market Report Scope & Overview:

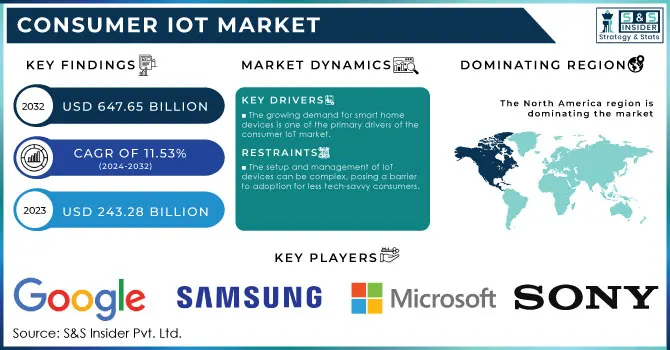
The Consumer IoT Market was worth USD 240.98 billion in 2023 and is predicted to grow to USD 625.3 billion by 2031, increasing at a 12.66% CAGR between 2024 and 2031.

Consumer IoT (Internet of Things) is a subset of the broader concept of the Internet of Things, characterized by its specific application and the equipment it employs. The Internet of Things serves as a network that interconnects diverse devices, networks, and systems, enabling seamless communication and optimal utilization.

Consumer IoT Market Revenue Analysis

Get more information on Consumer IoT Market - Request Free Sample Report

For example, a smart house is a fantastic example of consumer IoT since it connects all smart gadgets to the same network and perfectly applies and achieves customer ease of communication and usage. The global consumer IoT market is predicted to grow as a result of factors such as smart device adoption and a surge in internet users. Furthermore, rising fitness consciousness and rising disposable incomes in emerging nations drive total industry growth. However, the rising danger of data breaches linked with consumer IoT is a significant impediment to the worldwide consumer IoT market. On the contrary, expanding government support for IoT research and development, as well as favorable government rules to encourage green building, are likely to offer profitable prospects for the consumer IoT market.

Market Dynamics

Drivers

  • Application of Wireless Smart Sensors

  • The global increase in Internet penetration rate

  • The introduction of the fifth generation of cellular mobile communications, or 5G, will drive industry development.

The increased use of wireless smart sensors and networks significantly impacts the market. Furthermore, the expanding IP address space and improved security solutions made possible by IPv6 favorably influence the industry. Furthermore, increased urbanization, lifestyle changes, an increase in the need for data centers as cloud platforms become more popular, an increase in investments, and a growing market for connected devices all benefit the consumer Internet of Things (IoT) business.

Restrains

  • Concerns about data security

  • Privacy breaches

As digital technologies grow increasingly pervasive in our everyday lives as consumers, the danger of cyberattacks increases. Flaws are regularly introduced into the market by new items. Consumer Reports uncovered 11 security issues in four new video doorbells and home security cameras in 2021, warning users of hacking or breaches of personal data such as email addresses and Wi-Fi passwords. 

Opportunities

  • Government financing for IoT research and development

  • Government policies that encourage green building

  • Increase in global Internet penetration rate

Challenges

  • Excessive power consumption by connected devices is projected to stymie industry expansion.

  • Inadequate updates and obsolete software

To protect the security of IoT devices, updates are necessary. When new vulnerabilities are found, devices should be updated on a regular basis. Smartphones and laptops often receive monthly (or more regularly in certain circumstances) updates, whereas IoT devices sometimes do. These devices frequently lack a well-defined security update and patching methodology.

OEMs must routinely prioritize cyber security while building IoT devices. As a result, more susceptible gadgets to cyber-attacks are manufactured. This implies that a gadget that was safe when the client originally bought it is now dangerous and vulnerable to hackers and other security threats.

The Russia-Ukraine War

The war can create economic uncertainty in the region and beyond, which can impact consumer spending. During times of instability, consumers tend to be more cautious with their finances, leading to a potential slowdown in the adoption and purchase of IoT devices. In response to the conflict, governments may introduce new regulations or restrictions that impact the IoT market. These regulations could include data localization requirements, restrictions on cross-border data flows, or increased security and privacy measures. Such changes may require IoT device manufacturers to adapt their products and operations, potentially leading to additional costs and challenges. The conflict between Russia and Ukraine has broader implications for cybersecurity. As tensions rise, there is an increased risk of cyber-attacks targeting critical infrastructure, including IoT devices. This can undermine consumer confidence in IoT technology and raise concerns about privacy and data security, potentially slowing down the adoption of IoT devices.

The geopolitical implications of the conflict may lead to shifts in alliances and trade dynamics. This can affect the global IoT market, as it relies on international cooperation and collaboration. Changes in political relationships and trade agreements could impact the availability and affordability of consumer IoT devices in different markets.

Impact of Recessions 

Economic downturns often lead to job losses, reduced income levels, and financial uncertainty for many individuals. This can make IoT devices relatively less affordable, as consumers prioritize basic needs over technology purchases. High-priced IoT devices may experience a more significant impact as consumers tighten their budgets. Recessions can create a sense of caution among consumers, causing them to delay or postpone technology adoption. IoT devices, especially newer and more innovative ones, may face resistance as consumers become more risk-averse and hesitant to invest in unfamiliar technologies during financially uncertain times. During recessions, consumers tend to focus on cost-saving measures and value for money. IoT devices that offer clear cost-saving benefits, such as smart energy management systems or home security solutions, may continue to see demand. However, IoT devices considered as luxury or entertainment-oriented, like smart home assistants or connected toys, may experience a decline in demand.

The IoT market relies not only on consumer demand but also on the underlying infrastructure, including connectivity, cloud platforms, and data analytics. During a recession, companies may reduce investments in IoT infrastructure due to financial constraints, which could limit the growth of the consumer IoT market.

Key Market Segmentation

By Connectivity

  • Wired

  • Wireless

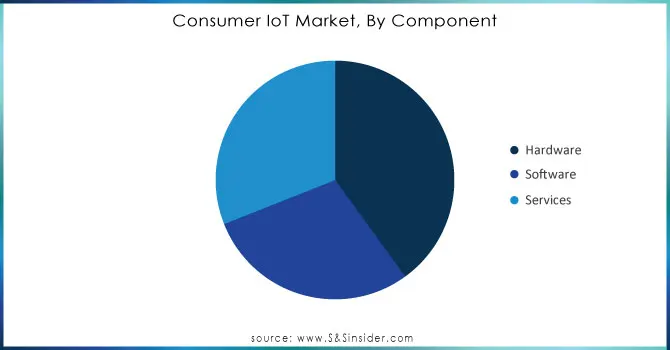
By Offering

  • Hardware

  • Software

  • Services

By End User

Regional Analysis 

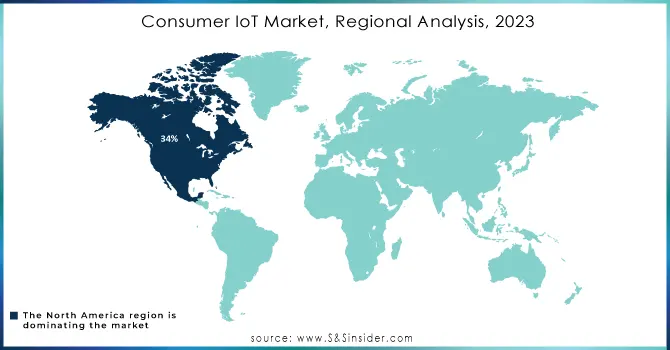
North America stands as the most lucrative region within the consumer IoT industry. The soaring desire for intelligent devices across consumer electronics, wearables, and home automation applications has catapulted the consumer IoT market in this region to unprecedented heights. Moreover, the escalating health awareness, triggered by the surge in chronic illnesses and diabetic patients, coupled with the user-friendly nature of medical devices, is fueling the market's expansion in this area. The widespread adoption of smart connected devices and the rapid digitization across various consumer end-use applications have further propelled the IoT expansion in North America. According to a 2022 ValuePenguin survey of over 1,450 customers, while 44.2 % of Americans now use smartwatches like Fitbits and Apple Watches, 68 % are willing to utilize a fitness tracker to receive health insurance reductions.

Consumer-IoT-Market-By-Region

Need any customization research on Consumer IoT Market - Enquiry Now

REGIONAL COVERAGE:

North America

  • US

  • Canada

  • Mexico

Europe

  • Eastern Europe

    • Poland

    • Romania

    • Hungary

    • Turkey

    • Rest of Eastern Europe

  • Western Europe

    • Germany

    • France

    • UK

    • Italy

    • Spain

    • Netherlands

    • Switzerland

    • Austria

    • Rest of Western Europe

Asia Pacific

  • China

  • India

  • Japan

  • South Korea

  • Vietnam

  • Singapore

  • Australia

  • Rest of Asia Pacific

Middle East & Africa

  • Middle East

    • UAE

    • Egypt

    • Saudi Arabia

    • Qatar

    • Rest of Middle East

  • Africa

    • Nigeria

    • South Africa

    • Rest of Africa

Latin America

  • Brazil

  • Argentina

  • Colombia

  • Rest of Latin America

Key Players:

The major players are Honeywell International Inc., Microsoft, IBM Corp., Apple Inc., AT&T, Cisco Systems, Inc., Alphabet Inc., Intel Corp., LG Corp., TE Connectivity, Samsung, Sony Corp., Amazon.com, Inc., Texas Instruments, Schneider Electric, and others.

Microsoft-Company Financial Analysis

Company Landscape Analysis

Recent Developments:

In June 2020, Amazon.com, Inc. announced the Halo Band, which features an accelerometer, temperature sensor, two microphones, and a heart rate monitor.

Alphabet Inc. owns it. Google purchased Fitbit in 2021 to expand its presence in the wearables business. The firm does not make wearables but does provide software for building smartwatches.

In May 2020, Koninklijke Philips N.V. received CE marking and FDA certification for their wireless wearable biosensor to monitor coronavirus patients.

In April 2020, Sony revealed new true wireless earbuds and over-ear headphones, including two new mid-range versions. These earbuds analyze ambient sound components in real-time and, among other things, enable one-touch access to Siri.

Consumer IoT Market Report Scope:
Report Attributes Details
Market Size in 2023  US$ 240.98 Bn 
Market Size by 2031  US$ 625.3 Bn
CAGR   CAGR of 12.66 % From 2024 to 2031
Base Year 2023
Forecast Period  2024-2031
Historical Data  2020-2021
Report Scope & Coverage Market Size, Segments Analysis, Competitive  Landscape, Regional Analysis, DROC & SWOT Analysis, Forecast Outlook
Key Segments • By Connectivity (Wired, Wireless)
• By Offering (Hardware, Software, Services)
• By End User (Home Automation, Consumer Electronics, Automotive, Healthcare, Others)
Regional Analysis/Coverage North America (US, Canada, Mexico), Europe (Eastern Europe [Poland, Romania, Hungary, Turkey, Rest of Eastern Europe] Western Europe] Germany, France, UK, Italy, Spain, Netherlands, Switzerland, Austria, Rest of Western Europe]). Asia Pacific (China, India, Japan, South Korea, Vietnam, Singapore, Australia, Rest of Asia Pacific), Middle East & Africa (Middle East [UAE, Egypt, Saudi Arabia, Qatar, Rest of Middle East], Africa [Nigeria, South Africa, Rest of Africa], Latin America (Brazil, Argentina, Colombia Rest of Latin America)
Company Profiles Honeywell International Inc., Microsoft, IBM Corp., Apple Inc., AT&T, Cisco Systems, Inc., Alphabet Inc., Intel Corp., LG Corp., TE Connectivity, Samsung, Sony Corp., Amazon.com, Inc., Texas Instruments, Schneider Electric
Key Drivers • Application of Wireless Smart Sensors
• The global increase in Internet penetration rate
• The introduction of the fifth generation of cellular mobile communications, or 5G, will drive industry development.
Market Restraints • Concerns about data security
• Privacy breaches


Frequently Asked Questions

Ans: The Consumer IoT Market is to grow at a CAGr of 27.54% Over the Forecast Period 2023-2030.

Ans: There are three options available to purchase this report,

A. Single User License USD 4650

Features: A non-printable PDF to be accessed by just one user at a time

  • No Excel would be delivered along with the PDF

  • 1 complimentary analyst briefing session of 30 minutes to be provided post-purchase and delivery of the study

  • 1 complimentary update to be provided after 6 months of purchase

  • Additional 80 analyst hours of free customization to add extra slices of information that might be missing from the study


B. Enterprise User License: USD 6,450

Features:

  • A printable/ sharable and downloadable PDF

  • No limit over the number of users

  • An Excel spreadsheet would be delivered along with the PDF

  • 2 complimentary analyst briefing sessions of 30 minutes each to be provided post-purchase and delivery of the study

  • 2 complimentary updates to be provided within 1 year of purchase

  • Additional 100 analyst hours of free customization to add extra slices of information that might be missing from the study.


C: Excel Datasheet: USD 2,325

  • ME sheet is provided in Excel format.

  • 1 complimentary analyst briefing session of 30 minutes to be provided post purchase and delivery of the study

Ans. The North American region is dominating the Consumer IoT Market.

Ans: The Consumer IoT Market size was valued at USD 217.2 billion in 2022.

Ans:

  • Government financing for IoT research and development
  • Government policies that encourage green building
  • Increase in global Internet penetration rate 

Table of Contents

1. Introduction
1.1 Market Definition
1.2 Scope
1.3 Research Assumptions

2. Research Methodology

3. Market Dynamics
3.1 Drivers
3.2 Restraints
3.3 Opportunities
3.4 Challenges

4. Impact Analysis
4.1 Impact of Russia-Ukraine War
4.2 Impact of Ongoing Recession
4.2.1 Introduction
4.2.2 Impact on major economies
4.2.2.1 US
4.2.2.2 Canada
4.2.2.3 Germany
4.2.2.4 France
4.2.2.5 United Kingdom
4.2.2.6 China
4.2.2.7 japan
4.2.2.8 South Korea
4.2.2.9 Rest of the World

5. Value Chain Analysis

6. Porter’s 5 forces model

7. PEST Analysis

8. Consumer IoT Market, By Connectivity
8.1 Wired
8.2 Wireless

9. Consumer IoT Market By Offering
9.1 Hardware
9.2 Software
9.3 Services

10. Consumer IoT Market, By End-user
10.1 Home Automation
10.2 Consumer Electronics
10.3 Automotive
10.4 Healthcare
10.5 Others

11. Regional Analysis
11.1 Introduction
11.2 North America
11.2.1 North America Consumer IoT Market By Country
11.2.2North America Consumer IoT Market By Connectivity
11.2.3 North America Consumer IoT Market By Offering
11.2.4 North America Consumer IoT Market By End-user
11.2.5 USA
11.2.5.1 USA Consumer IoT Market By Connectivity
11.2.5.2 USA Consumer IoT Market By Offering
11.2.5.3 USA Consumer IoT Market By End-user
11.2.6 Canada
11.2.6.1 Canada Consumer IoT Market By Connectivity
11.2.6.2 Canada Consumer IoT Market By Offering
11.2.6.3 Canada Consumer IoT Market By End-user
11.2.7 Mexico
11.2.7.1 Mexico Consumer IoT Market By Connectivity
11.2.7.2 Mexico Consumer IoT Market By Offering
11.2.7.3 Mexico Consumer IoT Market By End-user
11.3 Europe
11.3.1 Eastern Europe
11.3.1.1 Eastern Europe Consumer IoT Market By Country
11.3.1.2 Eastern Europe Consumer IoT Market By Connectivity
11.3.1.3 Eastern Europe Consumer IoT Market By Offering
11.3.1.4 Eastern Europe Consumer IoT Market By End-user
11.3.1.5 Poland
11.3.1.5.1 Poland Consumer IoT Market By Connectivity
11.3.1.5.2 Poland Consumer IoT Market By Offering
11.3.1.5.3 Poland Consumer IoT Market By End-user
11.3.1.6 Romania
11.3.1.6.1 Romania Consumer IoT Market By Connectivity
11.3.1.6.2 Romania Consumer IoT Market By Offering
11.3.1.6.4 Romania Consumer IoT Market By End-user
11.3.1.7 Turkey
11.3.1.7.1 Turkey Consumer IoT Market By Connectivity
11.3.1.7.2 Turkey Consumer IoT Market By Offering
11.3.1.7.3 Turkey Consumer IoT Market By End-user
11.3.1.8 Rest of Eastern Europe
11.3.1.8.1 Rest of Eastern Europe Consumer IoT Market By Connectivity
11.3.1.8.2 Rest of Eastern Europe Consumer IoT Market By Offering
11.3.1.8.3 Rest of Eastern Europe Consumer IoT Market By End-user
11.3.2 Western Europe
11.3.2.1 Western Europe Consumer IoT Market By Connectivity
11.3.2.2 Western Europe Consumer IoT Market By Offering
11.3.2.3 Western Europe Consumer IoT Market By End-user
11.3.2.4 Germany
11.3.2.4.1 Germany Consumer IoT Market By Connectivity
11.3.2.4.2 Germany Consumer IoT Market By Offering
11.3.2.4.3 Germany Consumer IoT Market By End-user
11.3.2.5 France
11.3.2.5.1 France Consumer IoT Market By Connectivity
11.3.2.5.2 France Consumer IoT Market By Offering
11.3.2.5.3 France Consumer IoT Market By End-user
11.3.2.6 UK
11.3.2.6.1 UK Consumer IoT Market By Connectivity
11.3.2.6.2 UK Consumer IoT Market By Offering
11.3.2.6.3 UK Consumer IoT Market By End-user
11.3.2.7 Italy
11.3.2.7.1 Italy Consumer IoT Market By Connectivity
11.3.2.7.2 Italy Consumer IoT Market By Offering
11.3.2.7.3 Italy Consumer IoT Market By End-user
11.3.2.8 Spain
11.3.2.8.1 Spain Consumer IoT Market By Connectivity
11.3.2.8.2 Spain Consumer IoT Market By Offering
11.3.2.8.3 Spain Consumer IoT Market By End-user
11.3.2.9 Netherlands
11.3.2.9.1 Netherlands Consumer IoT Market By Connectivity
11.3.2.9.2 Netherlands Consumer IoT Market By Offering
11.3.2.9.3 Netherlands Consumer IoT Market By End-user
11.3.2.10 Switzerland
11.3.2.10.1 Switzerland Consumer IoT Market By Connectivity
11.3.2.10.2 Switzerland Consumer IoT Market By Offering
11.3.2.10.3 Switzerland Consumer IoT Market By End-user
11.3.2.11.1 Austria
11.3.2.11.2 Austria Consumer IoT Market By Connectivity
11.3.2.11.3 Austria Consumer IoT Market By Offering
11.3.2.11.4 Austria Consumer IoT Market By End-user
11.3.2.12 Rest of Western Europe
11.3.2.12.1 Rest of Western Europe Consumer IoT Market By Connectivity
11.3.2.12.2 Rest of Western Europe Consumer IoT Market By Offering
11.3.2.12.3 Rest of Western Europe Consumer IoT Market By End-user
11.4 Asia-Pacific
11.4.1 Asia-Pacific Consumer IoT Market By Country
11.4.2 Asia-Pacific Consumer IoT Market By Connectivity
11.4.3 Asia-Pacific Consumer IoT Market By Offering
11.4.4 Asia-Pacific Consumer IoT Market By End-user
11.4.5 China
11.4.5.1 China Consumer IoT Market By Connectivity
11.4.5.2 China Consumer IoT Market By Offering
11.4.5.3 China Consumer IoT Market By End-user
11.4.6 India
11.4.6.1 India Consumer IoT Market By Connectivity
11.4.6.2 India Consumer IoT Market By Offering
11.4.6.3 India Consumer IoT Market By End-user
11.4.7 Japan
11.4.7.1 Japan Consumer IoT Market By Connectivity
11.4.7.2 Japan Consumer IoT Market By Offering
11.4.7.3 Japan Consumer IoT Market By End-user
11.4.8 South Korea
11.4.8.1 South Korea Consumer IoT Market By Connectivity
11.4.8.2 South Korea Consumer IoT Market By Offering
11.4.8.3 South Korea Consumer IoT Market By End-user
11.4.9 Vietnam
11.4.9.1 Vietnam Consumer IoT Market By Connectivity
11.4.9.2 Vietnam Consumer IoT Market By Offering
11.4.9.3 Vietnam Consumer IoT Market By End-user
11.4.10 Singapore
11.4.10.1 Singapore Consumer IoT Market By Connectivity
11.4.10.2 Singapore Consumer IoT Market By Offering
11.4.10.3 Singapore Consumer IoT Market By End-user
11.4.11 Australia
11.4.11.1 Australia Consumer IoT Market By Connectivity
11.4.11.2 Australia Consumer IoT Market By Offering
11.4.11.3 Australia Consumer IoT Market By End-user
11.4.12 Rest of Asia-Pacific
11.4.12.1 Rest of Asia-Pacific Consumer IoT Market By Connectivity
11.4.12.2 Rest of Asia-Pacific Consumer IoT Market By Offering
11.4.12.3 Rest of Asia-Pacific Consumer IoT Market By End-user
11.5 Middle East & Africa
11.5.1 Middle East
11.5.1.1 Middle East Consumer IoT Market By country
11.5.1.2 Middle East Consumer IoT Market By Connectivity
11.5.1.3 Middle East Consumer IoT Market By Offering
11.5.1.4 Middle East Consumer IoT Market By End-user
11.5.1.5 UAE
11.5.1.5.1 UAE Consumer IoT Market By Connectivity
11.5.1.5.2 UAE Consumer IoT Market By Offering
11.5.1.5.3 UAE Consumer IoT Market By End-user
11.5.1.6 Egypt
11.5.1.6.1 Egypt Consumer IoT Market By Connectivity
11.5.1.6.2 Egypt Consumer IoT Market By Offering
11.5.1.6.3 Egypt Consumer IoT Market By End-user
11.5.1.7 Saudi Arabia
11.5.1.7.1 Saudi Arabia Consumer IoT Market By Connectivity
11.5.1.7.2 Saudi Arabia Consumer IoT Market By Offering
11.5.1.7.3 Saudi Arabia Consumer IoT Market By End-user
11.5.1.8 Qatar
11.5.1.8.1 Qatar Consumer IoT Market By Connectivity
11.5.1.8.2 Qatar Consumer IoT Market By Offering
11.5.1.8.3 Qatar Consumer IoT Market By End-user
11.5.1.9 Rest of Middle East
11.5.1.9.1 Rest of Middle East Consumer IoT Market By Connectivity
11.5.1.9.2 Rest of Middle East Consumer IoT Market By Offering
11.5.1.9.3 Rest of Middle East Consumer IoT Market By End-user
11.5.2 Africa
11.5.2.1 Africa Consumer IoT Market By Country
11.5.2.2 Africa Consumer IoT Market By Connectivity
11.5.2.3 Africa Consumer IoT Market By Offering
11.5.2.4 Africa Consumer IoT Market By End-user
11.5.2.5 Nigeria
11.5.2.5.1 Nigeria Consumer IoT Market By Connectivity
11.5.2.5.2 Nigeria Consumer IoT Market By Offering
11.5.2.5.3 Nigeria Consumer IoT Market By End-user
11.5.2.6 South Africa
11.5.2.6.1 South Africa Consumer IoT Market By Connectivity
11.5.2.6.2 South Africa Consumer IoT Market By Offering
11.5.2.6.3 South Africa Consumer IoT Market By End-user
11.5.2.7 Rest of Africa
11.5.2.7.1 Rest of Africa Consumer IoT Market By Connectivity
11.5.2.7.2 Rest of Africa Consumer IoT Market By Offering
11.5.2.7.3 Rest of Africa Consumer IoT Market By End-user
11.6 Latin America
11.6.1 Latin America Consumer IoT Market By country
11.6.2 Latin America Consumer IoT Market By Connectivity
11.6.3 Latin America Consumer IoT Market By Offering
11.6.4 Latin America Consumer IoT Market By End-user
11.6.5 Brazil
11.6.5.1 Brazil America Consumer IoT Market By Connectivity
11.6.5.2 Brazil America Consumer IoT Market By Offering
11.6.5.3 Brazil America Consumer IoT Market By End-user
11.6.6 Argentina
11.6.6.1 Argentina America Consumer IoT Market By Connectivity
11.6.6.2 Argentina America Consumer IoT Market By Offering
11.6.6.3 Argentina America Consumer IoT Market By End-user
11.6.7 Colombia
11.6.7.1 Colombia America Consumer IoT Market By Connectivity
11.6.7.2 Colombia America Consumer IoT Market By Offering
11.6.7.3 Colombia America Consumer IoT Market By End-user
11.6.8 Rest of Latin America
11.6.8.1 Rest of Latin America Consumer IoT Market By Connectivity
11.6.8.2 Rest of Latin America Consumer IoT Market By Offering
11.6.8.3 Rest of Latin America Consumer IoT Market By End-user

12 Company profile
12.1 Honeywell International Inc.
12.1.1 Company Overview
12.1.2 Financials
12.1.3 Product/Services/Offerings
12.1.4 SWOT Analysis
12.1.5 The SNS View
12.2 Microsoft.
12.2.1 Company Overview
12.2.2 Financials
12.2.3 Product/Services/Offerings
12.2.4 SWOT Analysis
12.2.5 The SNS View
12.3 IBM Corp.
12.3.1 Company Overview
12.3.2 Financials
12.3.3 Product/Services/Offerings
12.3.4 SWOT Analysis
12.3.5 The SNS View
12.4 Apple Inc.
12.4.1 Company Overview
12.4.2 Financials
12.4.3 Product/Services/Offerings
12.4.4 SWOT Analysis
12.4.5 The SNS View
12.5 Cisco Systems, Inc.
12.5.1 Company Overview
12.5.2 Financials
12.5.3 Product/Services/Offerings
12.5.4 SWOT Analysis
12.5.5 The SNS View
12.6 Alphabet Inc.
12.6.1 Company Overview
12.6.2 Financials
12.6.3 Product/Services/Offerings
12.6.4 SWOT Analysis
12.6.5 The SNS View
12.7 Intel Corp
12.7.1 Company Overview
12.7.2 Financials
12.7.3 Product/Services/Offerings
12.7.4 SWOT Analysis
12.7.5 The SNS View
12.8 LG Corp.
12.8.1 Company overview
12.8.2 Financials
12.8.3 Product/Services/Offerings
12.8.4 SWOT Analysis
12.8.5 The SNS View
12.9 TE Connectivity.
12.9.1 Company Overview
12.9.2 Financials
12.9.3 Product/Services/Offerings
12.9.4 SWOT Analysis
12.9.5 The SNS View
12.10 Samsung.
12.10.1 Company Overview
12.10.2 Financials
12.10.3 Product/Services/Offerings
12.10.4 SWOT Analysis
12.10.5 The SNS View

13. Competitive Landscape
13.1 Competitive Benchmarking
13.2 Market Share Analysis
13.3 Recent Developments
13.3.1 Industry News
13.3.2 Company News
13.3.3 Mergers & Acquisitions

14. Use Case and Best Practices

15. Conclusion

An accurate research report requires proper strategizing as well as implementation. There are multiple factors involved in the completion of good and accurate research report and selecting the best methodology to compete the research is the toughest part. Since the research reports we provide play a crucial role in any company’s decision-making process, therefore we at SNS Insider always believe that we should choose the best method which gives us results closer to reality. This allows us to reach at a stage wherein we can provide our clients best and accurate investment to output ratio.

Each report that we prepare takes a timeframe of 350-400 business hours for production. Starting from the selection of titles through a couple of in-depth brain storming session to the final QC process before uploading our titles on our website we dedicate around 350 working hours. The titles are selected based on their current market cap and the foreseen CAGR and growth.


The 5 steps process:

Step 1: Secondary Research:

Secondary Research or Desk Research is as the name suggests is a research process wherein, we collect data through the readily available information. In this process we use various paid and unpaid databases which our team has access to and gather data through the same. This includes examining of listed companies’ annual reports, Journals, SEC filling etc. Apart from this our team has access to various associations across the globe across different industries. Lastly, we have exchange relationships with various university as well as individual libraries.

Secondary Research

Step 2: Primary Research

When we talk about primary research, it is a type of study in which the researchers collect relevant data samples directly, rather than relying on previously collected data.  This type of research is focused on gaining content specific facts that can be sued to solve specific problems. Since the collected data is fresh and first hand therefore it makes the study more accurate and genuine.

We at SNS Insider have divided Primary Research into 2 parts.

Part 1 wherein we interview the KOLs of major players as well as the upcoming ones across various geographic regions. This allows us to have their view over the market scenario and acts as an important tool to come closer to the accurate market numbers. As many as 45 paid and unpaid primary interviews are taken from both the demand and supply side of the industry to make sure we land at an accurate judgement and analysis of the market.

This step involves the triangulation of data wherein our team analyses the interview transcripts, online survey responses and observation of on filed participants. The below mentioned chart should give a better understanding of the part 1 of the primary interview.

Primary Research

Part 2: In this part of primary research the data collected via secondary research and the part 1 of the primary research is validated with the interviews from individual consultants and subject matter experts.

Consultants are those set of people who have at least 12 years of experience and expertise within the industry whereas Subject Matter Experts are those with at least 15 years of experience behind their back within the same space. The data with the help of two main processes i.e., FGDs (Focused Group Discussions) and IDs (Individual Discussions). This gives us a 3rd party nonbiased primary view of the market scenario making it a more dependable one while collation of the data pointers.

Step 3: Data Bank Validation

Once all the information is collected via primary and secondary sources, we run that information for data validation. At our intelligence centre our research heads track a lot of information related to the market which includes the quarterly reports, the daily stock prices, and other relevant information. Our data bank server gets updated every fortnight and that is how the information which we collected using our primary and secondary information is revalidated in real time.

Data Bank Validation

Step 4: QA/QC Process

After all the data collection and validation our team does a final level of quality check and quality assurance to get rid of any unwanted or undesired mistakes. This might include but not limited to getting rid of the any typos, duplication of numbers or missing of any important information. The people involved in this process include technical content writers, research heads and graphics people. Once this process is completed the title gets uploader on our platform for our clients to read it.

Step 5: Final QC/QA Process:

This is the last process and comes when the client has ordered the study. In this process a final QA/QC is done before the study is emailed to the client. Since we believe in giving our clients a good experience of our research studies, therefore, to make sure that we do not lack at our end in any way humanly possible we do a final round of quality check and then dispatch the study to the client.


  •            5000 (33% Discount)


  •            8950 (40% Discount)


  •            3050 (23% Discount)

Start a Conversation

Hi! Click one of our member below to chat on Phone