Continuous Glucose Monitoring Market Report Scope & Overview:
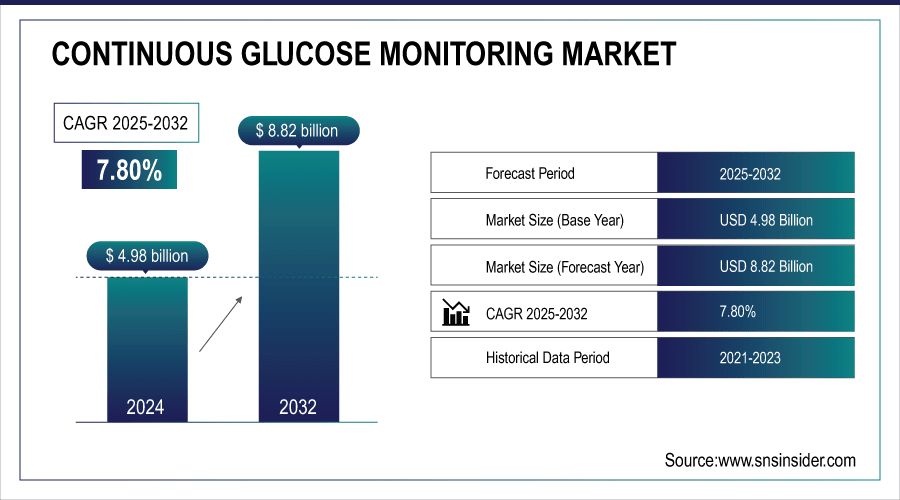
The Continuous Glucose Monitoring Market was valued at USD 4.98 billion in 2024 and is expected to reach USD 8.82 billion by 2032, growing at a CAGR of 7.80% from 2025-2032.
The Continuous Glucose Monitoring (CGM) Market is witnessing significant growth due to the rising prevalence of diabetes, driven by aging, obesity, and unhealthy lifestyles, particularly in low- and middle-income countries. CGM devices are minimally invasive, providing an effective method to manage diabetes by detecting abnormal blood glucose levels and preventing hypoglycemic events. These devices continuously monitor glucose fluctuations, transmitting data wirelessly to diabetes management systems, enabling patients to understand and control their condition better. Major risk factors contributing to diabetes include smoking, obesity, physical inactivity, high blood pressure, and elevated cholesterol levels, further fueling CGM adoption and market expansion.
According to WHO, global obesity surpassed 1 billion by 2022, including 650 million adults, 340 million adolescents, and 39 million children. By 2025, 167 million people are projected to face health issues from obesity and poor lifestyle, further driving CGM demand.
To Get More Information On Continuous Glucose Monitoring Market - Request Free Sample Report
| Country | Prevalence of diabetes (%) |
| Pakistan | 30.8 |
| French Polynesia | 25.2 |
| Kuwait | 24.9 |
| New Caledonia | 23.4 |
| Northern Mariana Islands | 23.4 |
| Nauru | 23.4 |
| The Marshall Islands | 23 |
| Mauritius | 22.6 |
| Kiribati | 22.1 |
| Egypt | 20.9 |
Note : The following table shows the top 10 countries or territories with the highest estimated prevalence of diabetes in adults aged 20–79 in 2021.
Continuous Glucose Monitoring Market Trends
-
Rising prevalence of diabetes is driving demand for continuous glucose monitoring (CGM) systems.
-
Advancements in wearable, minimally invasive, and real-time monitoring devices are enhancing patient convenience.
-
Integration with mobile apps and cloud platforms is enabling remote monitoring and data analytics.
-
Growing adoption of AI and predictive algorithms is improving personalized diabetes management.
-
Increasing awareness of proactive glucose control and preventive care is boosting market growth.
-
Expansion of healthcare infrastructure and reimbursement policies is facilitating wider CGM accessibility.
-
Collaborations between medical device companies and digital health platforms are accelerating innovation and adoption.
Continuous Glucose Monitoring Market Growth Drivers
-
Rising Demand for Continuous Glucose Monitoring Driven by the Need for Real-Time Tracking of Blood Glucose Levels to Improve Diabetes Management
The growing need for real-time glucose monitoring is driving the Continuous Glucose Monitoring (CGM) Market. Patients increasingly prefer minimally invasive devices that provide continuous insights into blood sugar fluctuations, enabling timely interventions and better disease management. CGM systems help prevent hypoglycemia and complications by transmitting data to management platforms, allowing personalized care. Rising diabetes prevalence, coupled with obesity and unhealthy lifestyles, is further fueling adoption, as both patients and healthcare providers seek accurate, convenient, and proactive monitoring solutions.
Continuous Glucose Monitoring Market Restraints
-
High Cost of Continuous Glucose Monitoring Systems Restricts Accessibility for Patients Lacking Comprehensive Health Insurance Coverage, Hindering Market Adoption
The high price of Continuous Glucose Monitoring (CGM) systems remains a significant barrier to widespread adoption. Many patients, especially in low- and middle-income regions, cannot afford these devices without comprehensive health insurance or reimbursement programs. Limited affordability restricts access to advanced diabetes management tools, slowing market growth. Despite their clinical benefits, including real-time glucose tracking and hypoglycemia prevention, the financial burden prevents large-scale adoption, highlighting the need for cost-effective solutions and supportive healthcare policies to expand CGM accessibility globally.
Continuous Glucose Monitoring Market Opportunities
-
Ongoing Innovations in Continuous Glucose Monitoring Technology, Including Fully Implantable Systems, Enhanced Sensor Accuracy, and AI Integration, Are Improving User Experience and Device Reliability
Continuous Glucose Monitoring (CGM) technology is rapidly advancing through innovations such as fully implantable devices, higher sensor accuracy, and integration with artificial intelligence. These developments enhance the user experience by providing more precise, real-time glucose readings and predictive insights for better diabetes management. AI-powered analytics help patients and healthcare providers make informed decisions, while implantable systems reduce maintenance and improve convenience. Such technological progress is expected to boost market adoption and strengthen the reliability and effectiveness of CGM devices globally.
Continuous Glucose Monitoring Market Segment Analysis
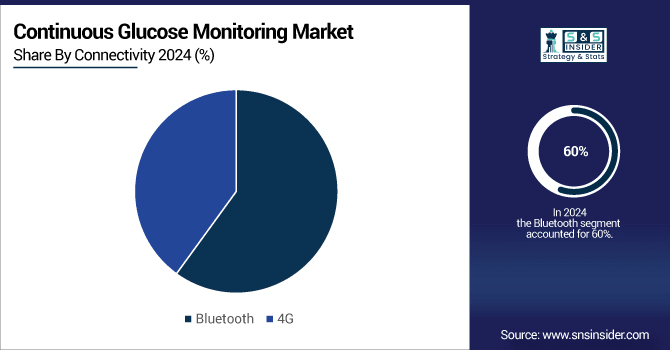
By Connectivity Bluetooth led while 4G Network is projected to grow fastest
Based on the connectivity, in 2024, the Bluetooth segment led the market with the largest revenue share of 60%. CGM sensors consist of Bluetooth chips in themselves. As the patient hovers over the recording device over the sensor, all the detailed information takes place transferring the blood glucose levels through the Bluetooth in the device. Further, the information is displayed in the reading device. The data may or may not transfer through a 4G network to be saved in the monitor center database. These chips are mainly outsourced by the other CGM manufacturers to provide precise and accurate data capture from the sensor. These chips are being out-sourced by, Nordic Semiconductors, Renesas Electronic, Onsemi, and many others, that develop chips for CGM devices. The lifespan of the chip is 14 days, as the sensors need to be changed. The 4G network segment is expected to witness a CAGR of 7.78% during the forecast period.
The 4G network includes data transfer from the receiving unit to the CGM central monitor database to the service provider database and numerous data points storage through specific CGM mobile applications as well. Such data transfer is considered utmost crucial for the determination of treatment fairways, monitoring alerts, and insulin delivery. There are numerous apps available today to perform such functions and save patient data, that help them to comprehend glucose fluctuation. Apps like Glucose Buddy, Diabetes Connect, My Sugar, Fooducate, My Fitness Pal, and many more are purchased at a rate of approximately $2 – 20 per month or $ 30 – 80 per year. Several other apps or top on the playstore also as Sugarsense or BlueStar Diabeties are available for free download.
By Component Sensors dominated while Transmitters are expected to grow fastest
The sensors segment dominated the market in terms of revenue holding 41% of share in 2024. Additionally, the high growth of the segment can be attributed to the technological advancements to improve sensor accuracy during the forecast period. Sensors are an integral part of continuous glucose monitoring devices. Subcutaneous sensors measure glucose levels in the surrounding region using a small filament that is inserted below the skin. The filament, which is thinner than a strand of hair, is held in place by adhesive tape placed at the edge of the sensor. CGM monitors use a chemical called glucose oxidase to monitor blood glucose levels. Glucose oxidase produces hydrogen peroxide from glucose.
The transmitters segment is expected to register the highest growth during the forecast period, with a projected CAGR of 7.85%. Transmitters are attached to the skin and communicate wirelessly with a sensor that is inserted into the skin. The sensor measures the amount of glucose in the interstitial fluid. Then, the transmitter signals a receiver or a smartphone app to send data to the device, where the user can monitor glucose levels and receive a warning of low or elevated blood sugar levels. Radio waves are used in the transmitter, which is also used in CGM devices that are easy to fold. In addition, the data will be sent from the sensor to the receiver or smartphone app. Also, Near-field Communication sensors and Bluetooth sensors are used.
Continuous Glucose Monitoring Market Regional Analysis
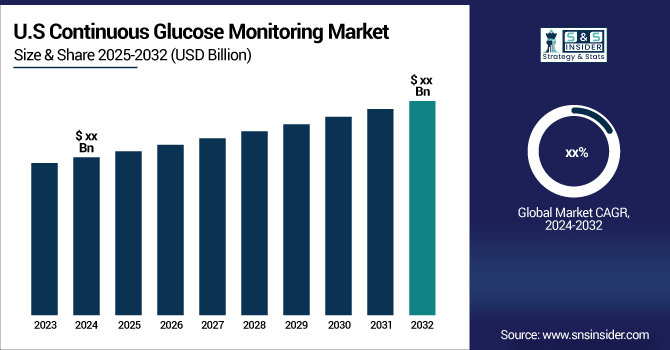
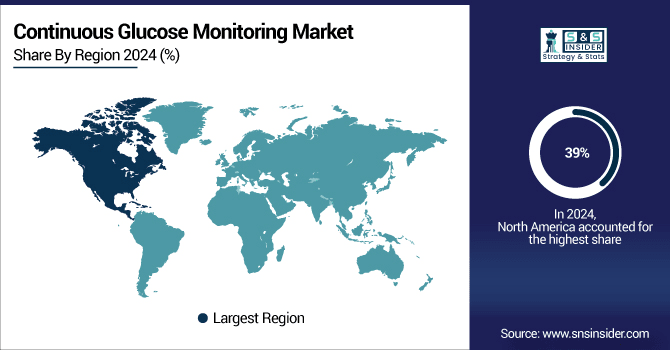
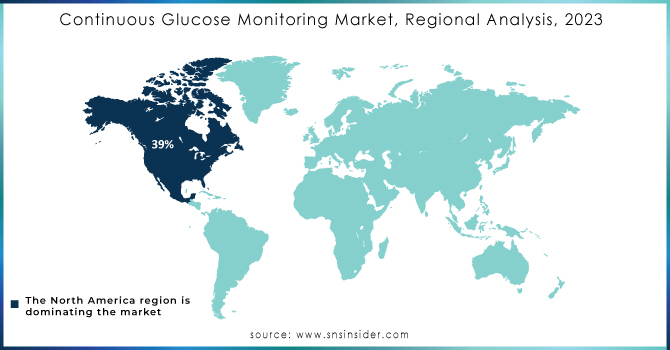
North America Continuous Glucose Monitoring Market Insights
The North American region captured the largest market share of 39% in 2024. The increasing prevalence of diabetes, rising adoption of CGM devices, technological advancement, and the presence of key companies are some of the factors propelling the market growth. In addition, the efforts taken by the federal government to manage the disease at a bigger scale are driving the market growth.
Get Customized Report as Per Your Business Requirement - Enquiry Now
Asia Pacific Continuous Glucose Monitoring Market Insights
The Asia Pacific region is expected to witness the highest CAGR of 8.72 % during the forecast period. According to the Asian Diabetes Prevention Initiative 2018, almost 60% of the world’s diabetic population is in the Asia Pacific region. The high incidence of disease in developing countries like India and China is driving the market growth in the region. In addition, the increasing healthcare expenditure in developing countries increasing investment by companies, and favorable regulatory policies are also positively affecting the market growth in this region.
Europe Continuous Glucose Monitoring Market Insights
Europe holds a significant share in the Continuous Glucose Monitoring (CGM) market due to well-established healthcare systems, high awareness of diabetes management, and widespread adoption of advanced medical technologies. Supportive reimbursement policies, ongoing technological innovations, and increasing prevalence of diabetes further drive market growth across key countries in the region.
Middle East & Africa and Latin America Continuous Glucose Monitoring Market Insights
The Middle East & Africa (MEA) and Latin America (LATAM) regions are witnessing growing adoption of Continuous Glucose Monitoring (CGM) systems due to increasing diabetes prevalence and awareness of advanced disease management. Expanding healthcare infrastructure, improving insurance coverage, and government initiatives to promote chronic disease care are fueling market growth. While affordability and accessibility remain challenges, technological adoption and patient education are gradually enhancing CGM penetration, making MEA and LATAM key emerging markets in the global CGM landscape.
Continuous Glucose Monitoring Market Competitive Landscape
Abbott Laboratories
Abbott Laboratories is a key player in the Continuous Glucose Monitoring (CGM) market, offering products like Freestyle Libre 1, Freestyle Libre 3, and Freestyle Libre 3 Pro. Its CGM systems are minimally invasive, providing real-time glucose monitoring and improved diabetes management. With widespread adoption, technological innovations, and strong global presence, Abbott continues to lead the market by delivering accurate, convenient, and user-friendly solutions for patients and healthcare providers.
-
2025: Abbott’s FreeStyle Libre CGM demonstrates reduced heart-related hospitalizations, providing users real-time glucose insights that enable proactive diabetes management and improved overall health outcomes.
-
2025: Abbott introduced integration of FreeStyle Libre systems with Epic electronic health records, allowing clinicians seamless access to CGM data for personalized, informed patient management and treatment decisions.
-
2024: The U.S. FDA approved FreeStyle Libre 2 and 3 sensors for use during X-rays, CT scans, and MRIs, ensuring continuous glucose monitoring without device removal.
Dexcom
Dexcom is a leading player in the Continuous Glucose Monitoring (CGM) market, offering devices such as Dexcom G6 and G7. Its systems provide real-time, accurate glucose readings, helping patients prevent hypoglycemia and manage diabetes effectively. With user-friendly interfaces, mobile connectivity, and integration with digital health platforms, Dexcom continues to drive CGM adoption globally, supporting both patients and healthcare providers in achieving better disease management and improved health outcomes.
-
2025: Dexcom received FDA approval for the G7 15 Day CGM, offering the longest-lasting, highly accurate 15.5-day sensor, set for U.S. release later in 2025.
-
2025: Dexcom introduced AI-powered Smart Food Logging in the Stelo and G7 apps, enabling users to snap meals, automatically identifying ingredients and generating meal entries for simplified glucose management.
Insulet Corporation
Insulet Corporation is a prominent player in the Continuous Glucose Monitoring (CGM) market, primarily through its Omnipod system. The tubeless, wearable insulin delivery device integrates with CGM platforms to provide real-time glucose monitoring and automated insulin management. By offering convenience, ease of use, and improved diabetes control, Insulet supports better patient adherence and outcomes. Its innovative solutions continue to drive adoption and growth in the global CGM market.
-
2025: Dexcom G7 CGM, enabling seamless glucose-aware insulin delivery control directly from users’ phones.
-
2024: The tubeless Omnipod 5 Automated Insulin Delivery (AID) System was fully launched in the UK and Netherlands, providing integrated CGM-based diabetes management for patients.
Continuous Glucose Monitoring Market Key Players
-
Medtronic
-
Tandem Diabetes Care
-
Senseonics Holdings
-
Nipro Corporation
-
Roche Diagnostics
-
F. Hoffmann-La Roche Ltd
-
Ypsomed
-
Insulet Corporation
-
Medtrum Technologies
-
FreeStyle Libre
-
LifeScan
-
Ascensia Diabetes Care
-
B. Braun
-
Terumo Corporation
-
Sanofi
-
ARKRAY
-
Prodigy Diabetes Care
-
ACON Laboratories
| Report Attributes | Details |
| Market Size in 2024 | US$ 4.98 Billion |
| Market Size by 2032 | US$ 8.82 Billion |
| CAGR | CAGR of 7.80% From 2024 to 2032 |
| Base Year | 2024 |
| Forecast Period | 2025-2032 |
| Historical Data | 2021-2022 |
| Report Scope & Coverage | Market Size, Segments Analysis, Competitive Landscape, Regional Analysis, DROC & SWOT Analysis, Forecast Outlook |
| Key Segments | •By Component (Sensors, Transmitters, Receivers) •By End Use Outlook (Hospitals, Home Care, Others) •By Connectivity Outlook (Bluetooth, 4G) |
| Regional Analysis/Coverage | North America (US, Canada, Mexico), Europe (Eastern Europe [Poland, Romania, Hungary, Turkey, Rest of Eastern Europe] Western Europe] Germany, France, UK, Italy, Spain, Netherlands, Switzerland, Austria, Rest of Western Europe]), Asia Pacific (China, India, Japan, South Korea, Vietnam, Singapore, Australia, Rest of Asia Pacific), Middle East & Africa (Middle East [UAE, Egypt, Saudi Arabia, Qatar, Rest of Middle East], Africa [Nigeria, South Africa, Rest of Africa], Latin America (Brazil, Argentina, Colombia, Rest of Latin America) |
| Company Profiles | Abbott Laboratories, Dexcom, Medtronic, Tandem Diabetes Care, Senseonics Holdings, Nipro Corporation, Roche Diagnostics, F. Hoffmann-La Roche Ltd, Ypsomed, Insulet Corporation, Medtrum Technologies, FreeStyle Libre, LifeScan, Ascensia Diabetes Care, B. Braun, Terumo Corporation, Sanofi, ARKRAY, Prodigy Diabetes Care, ACON Laboratories |
Frequently Asked Questions
North America dominated the CGM Market with 39% share in 2024, supported by high diabetes prevalence, advanced healthcare infrastructure, and early adoption of innovative glucose monitoring systems.
By component, Sensors dominated the CGM Market, while Transmitters are projected to grow fastest.
The market is driven by rising diabetes prevalence, global obesity surpassing 1 billion people, and increasing demand for real-time, minimally invasive glucose monitoring solutions.
The CGM Market was valued at USD 4.98 billion in 2024, and it is expected to reach USD 8.82 billion by 2032, reflecting strong growth.
The Continuous Glucose Monitoring Market is projected to grow at a CAGR of 7.80% from 2025 to 2032, driven by rising diabetes prevalence and advanced monitoring technologies.
Get in Touch
