Digital Water Market Size & Growth:
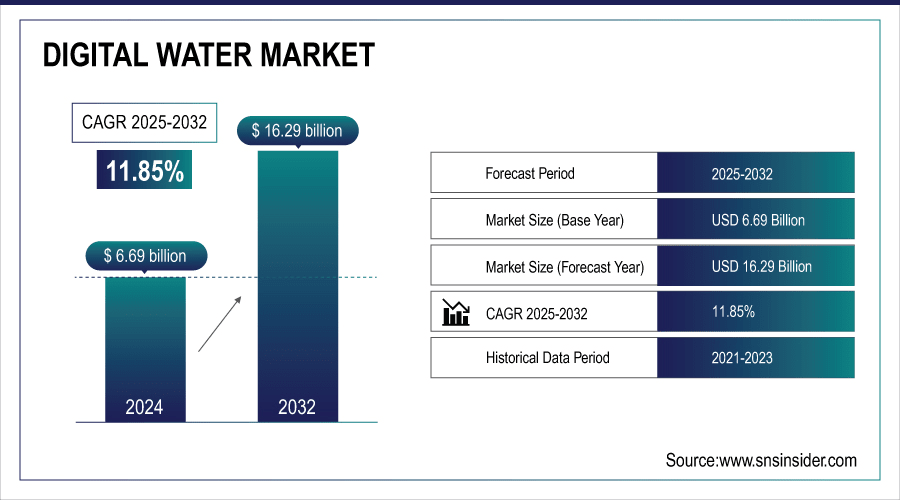
The Digital Water Market Size was valued at USD 6.69 billion in 2024 and is expected to reach USD 16.29 billion by 2032 and grow at a CAGR of 11.85% over the forecast period 2025-2032.
To Get More Information On Digital Water Market - Request Free Sample Report
The world market for digital water is experiencing increased adoption by water utilities and industrial sectors looking to deploy advanced technologies to optimize water management and lower operating costs. The likes of IoT, artificial intelligence, digital twins and smart water meters are making existing water infrastructure disappear. These technologies are allowing real-time monitoring, predictive maintenance and data-driven decision-making to address major water challenges such as scarcity, aging infrastructure and regulation/policy and drive more intelligent, more sustainable and more resilient urban and industrial water systems.
October 2024,According to research, Businesses have used AI technologies to boost efficiency and cut costs. Companies have saved millions with automation, predictive analytics, and better use of resources such as decreasing energy bills by 12% and 10-20% better planning. While initial investments in AI may be steep, long-term ROI is high, with savings in inventory costs and improved workforce optimization proving worth.
The U.S. Digital Water Market size was USD 1.57 billion in 2024 and is expected to reach USD 3.35 billion by 2032, growing at a CAGR of 9.99% over the forecast period of 2025–2032.
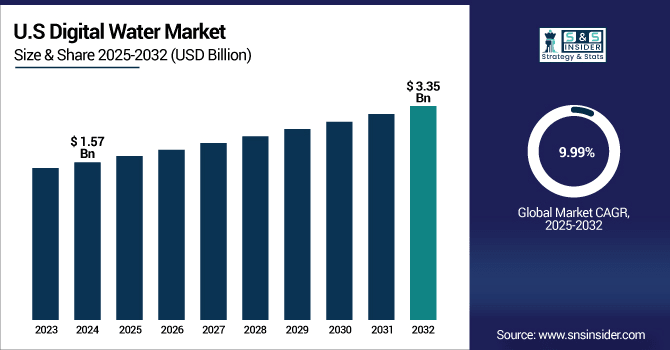
The U.S. market is growing briskly, driven by an accelerating focus on advanced water solutions to address aging infrastructure, leakage management, metering and customer engagement, and intelligent water health and quality. Growing government initiatives, growing environmental awarenss, ageing infrastructure is also driving the digital adoption. Advanced data driven capabilities are facilitating more improved operations, promoting sustainable resource management, and enhancing water system reliability and performance nationwide.
Digital Water Market Dynamics
Key Drivers:
-
Growing Focus on Water Conservation and Infrastructure Modernization Accelerates the Growth.
Utilities and governments are now increasingly investing in smart technology for their water networks to monitor, manage, and optimize them better. Early leak detection, reduction of non-revenue water, and better planning on digital resources are facilitated by digital technologies. The policies are in harmony with global sustainability goals and help utilities get in compliance with regulations, enhance levels of service, and reduce operating costs, which results in broad market expansion in various geographies.
Support Vector Machines (SVMs) classify leak vs. no-leak conditions with 97% accuracy using pressure and flow data. Deep Learning models, like ANNs, detect leaks through flow/pressure data, while CNNs analyze acoustic waves with over 90% accuracy.
Restrain:
-
Lack of Skilled Workforce and Training Hinders the Widespread Adoption of Digital Water Solutions.
Specialist skills will be necessary in data analytics, cybersecurity and system integration to roll out IoT, AI and other digital M2M solutions. It is difficult for many utilities, particularly in rural or underdeveloped areas, to attract and train employees with the requisite talent. This skills shortage slows the pace of digital adoption and heightens the operational risks of incorrectly implemented or maintained digital systems.
Opportunities:
-
Expansion of Smart Cities and Government Initiatives Creates New Opportunities for the Market Growth.
Governments are working to leverage digital technologies to create more efficient and resilient urban water systems. Digital water management as part of smart city initiatives, for instance, provides real-time observation, predictive analytics and resource usage optimisation. Government benefits, incentives, and funding initiatives additionally, drive the utilities towards smart infrastructure, creating immense opportunities for technology vendors and solution providers in the next five years.
Challenges:
-
Data Security Risks and Cyber Threats Pose Significant Challenges to the Market Expansion.
Hacking into critical services, or simply stealing sensitive information, within online water systems is becoming increasingly attractive to assailants. Due to the complexity and ongoing challenge of managing effective cybersecurity, maintaining compliance with regulations, and protecting crucial infrastructure, consistent investment and expertise are required. The growing threat is compounded with more advanced digital environments and risks serious enough for utilities and governments dedicated to maintaining the health of the public and the security of the nation.
Digital Water Market Segment Analysis:
By Solution Type
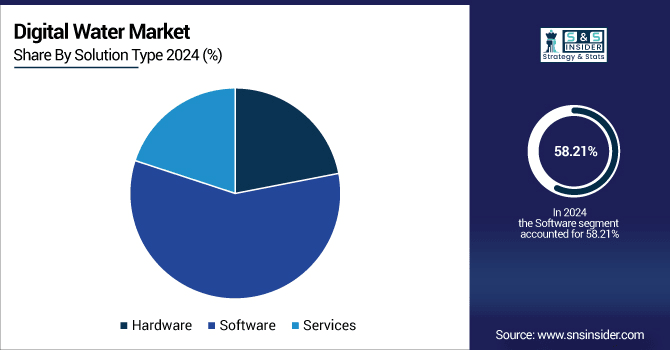
The Software segment has the largest revenue proportion of 58.21% in the market in 2024 due to increasing demands for real-time digital water market analysis, predictive modeling, and system integration. Digital Water Industry leaders such as IBM, Oracle, and Siemens have introduced advanced water management platforms centered Companieson AI-powered software and cloud solutions. Such innovations help utilities optimize operations, minimize water loss, and improve service delivery, driving software's dominance in the expanding market.
The services segment is expected to have the fastest CAGR of 11.90% between 2025 and 2032, driven by growing demand for consulting, system integration, and managed services in digital water solutions. Vendors such as SUEZ and Veolia are augmenting their service portfolio with AI-driven analytics and predictive maintenance offerings. These services are critical for maximizing infrastructure and minimizing operational expenses, and thus represent a primary growth driver in the changing digital water landscape.
By End User
The municipal water segment has the highest revenue in digital water market share of 63.90% in the 2024. Fueled by the demand for effective water distribution, smart metering, and leak detection, players such as Schneider Electric and Xylem have launched sophisticated software and IoT-based solutions. These technologies enable municipalities to enhance water conservation, streamline operations, and maintain regulatory compliance, cementing the municipal water segment's leadership in the market.
The industrial sector is expected to expand at the fastest CAGR of 13.56% during the period 2025-2032, as a result of growing use of digital solutions for water treatment, waste management, and resource optimization. Players such as ABB and Siemens are introducing integrated systems to enhance water usage efficiency. With industries seeking more sustainable operations, this sector's fast pace of digital adoption makes it a prominent growth driver in the market.
By Technology
The internet of things (IoT) sector dominated the market with its 34.93 market share, as it has the potential to enhance real-time tracking and data collection across water networks. Large suppliers like IBM, Cisco, and Honeywell have already offered their own IoT-based solutions (sensors, smart meters) for water quality monitoring, leak detection, and better distribution. These developments lead to practical advice for municipalities and industries, to enable cost-efficient and sustainable practices. The IoT sector continues to dominate as the top technology for water management in industries.
The digital twin market is expected to advance at the fastest CAGR of 13.50% during the forecast period of 2025 to 2032, as it facilitates the development of virtual models of water systems for real-time simulation and optimisation. Bentley Systems and Siemens are some of the companies that have launched digital twin offerings for water infrastructure, facilitating predictive maintenance, optimisation of performance, and enhanced decision-making. This technology is quickly being embraced by industries and municipalities to lower the costs, increase efficiency, and promote sustainability, making digital twins one of the key growth drivers in the digital water industry.
Digital Water Market Regional Outlook:
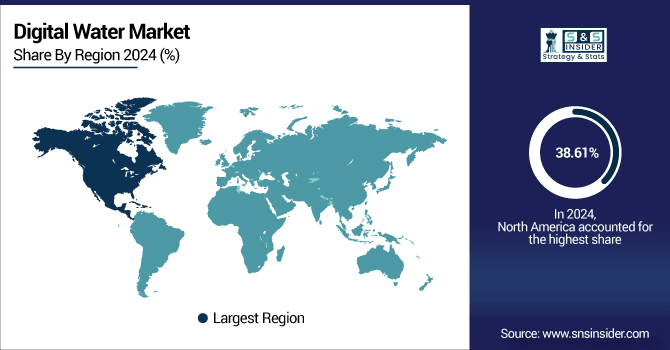
The North America region dominated the market with a 38.61% revenue share in 2024 due to speedy adoption of smart water management technologies. Itron and Xylem are some of the Digital Waters companies that have introduced sophisticated IoT-based water monitoring platforms and AI-powered platforms to facilitate efficient consumption of water, leak detection, and infrastructure optimization. North America's robust regulatory policies and focus on sustainability positions it as the leading region in the market.
The U.S. dominated the North American market with its sophisticated infrastructure, high investment in smart technologies, and robust regulatory systems. The nation's focus on sustainability, water saving, and technology advancement fuels extensive use of digital water solutions.
The Asia Pacific region will expand at the fastest CAGR of 13.14% during the period 2025-2032, driven by urbanization, industrial development, and water conservation needs. Siemens and Honeywell are leading companies that are increasing their footprint with digital water solutions that cater to the regional requirements, such as smart meters and IoT platforms. With the pace of infrastructure modernization gaining momentum, Asia Pacific is emerging as a key driver in the digital water market.
China is a dominated country in the Asia Pacific digital water market attributed to rapid urbanization, heavy industrialization, and strong government initiatives for sustainability and infrastructure refurbishment. Significant investment in smart water technologies, IoT, and AI solutions have been prime drivers making China lead in this market.
The digital water market in Europe is growing at an accelerated rate, and its expansion is underpinned by a need for sustainability, water conservation and smart infrastructure. Key countries such as Germany, France, and UK are exploiting IoT, AI, and smart meters to optimize water networks, optimize resource planning, and adhere to environmental norms and this fact is driving the digital water market growth.
Germany is leading the European rectifier market based on its robust industrial sector, progress in renewable energy, and immense demand for rectifiers across power generation, energy storage, and manufacturing industries, propelling market leadership.
In the Middle East & Africa, UAE is at the forefront of the digital water market due to heavy investments in smart water infrastructure and sustainability. In Latin America, Brazil is at the forefront, with growing use of digital solutions for water management and infrastructure modernization backed by government efforts and the growing need for water efficiency.
Get Customized Report as Per Your Business Requirement - Enquiry Now
Digital Water Companies are:
Major Key Players in Digital Water Market are Schneider Electric, Xylem, Veolia, Siemens, Copperleaf Technologies Inc., Atonix Digital, ABB, Innovyze, Analytical Technology Inc., Bentley systems.
Recent Development:
-
February 2025, Xylem launched the Xylem Vue platform, emphasizing digital transformation of water management. The platform utilizes AI and advanced analytics to improve water utility operations in a bid to transform water management processes.
-
July 2024, ABB unveiled the ACQ80, a pioneering solar drive that is suited for efficient water pumping in eco-friendly applications. The solution promises to enhance efficiency and dependability for solar-powered water systems.
-
April 2025, Bentley Systems collaborated with Google to transform the way infrastructure inspections are done using AI-based analytics to enhance the efficiency and reliability of water infrastructure management.
| Report Attributes | Details |
|---|---|
| Market Size in 2024 | USD 6.69 Billion |
| Market Size by 2032 | USD 16.29 Billion |
| CAGR | CAGR of 11.85% From 2025 to 2032 |
| Base Year | 2024 |
| Forecast Period | 2025-2032 |
| Historical Data | 2021-2023 |
| Report Scope & Coverage | Market Size, Segments Analysis, Competitive Landscape, Regional Analysis, DROC & SWOT Analysis, Forecast Outlook |
| Key Segments | •By Solution Type (Hardware, Software, Services) •By End User (Municipal Water Industries, Industrial, Others) •By Technology (Smart Water Meters, Internet of Things, Artificial Intelligence & Machine Learning, Digital Twin, Geographic Information Systems, Others) |
| Regional Analysis/Coverage | North America (US, Canada, Mexico), Europe (Germany, France, UK, Italy, Spain, Poland, Turkey, Rest of Europe), Asia Pacific (China, India, Japan, South Korea, Singapore, Australia, Rest of Asia Pacific), Middle East & Africa (UAE, Saudi Arabia, Qatar, South Africa, Rest of Middle East & Africa), Latin America (Brazil, Argentina, Rest of Latin America) |
| Company Profiles | Schneider Electric, Xylem, Veolia, Siemens, Copperleaf Technologies Inc., Atonix Digital, ABB, Innovyze, Analytical Technology Inc., Bentley systems |
Frequently Asked Questions
North America dominated the Digital Water Market in 2024.
Software segment dominated the Digital Water Market.
The major growth factor of the Digital Water Market is increasing demand for efficient water management through digitalization technologies.
The Digital Water Market size was USD 6.69 billion in 2024 and is expected to reach USD 16.29 billion by 2032.
The Digital Water Market is expected to grow at a CAGR of 11.85% from 2025-2032.
Get in Touch
