Open Source Services Market Size & Overview:
Get More Information on Open Source Services Market - Request Sample Report
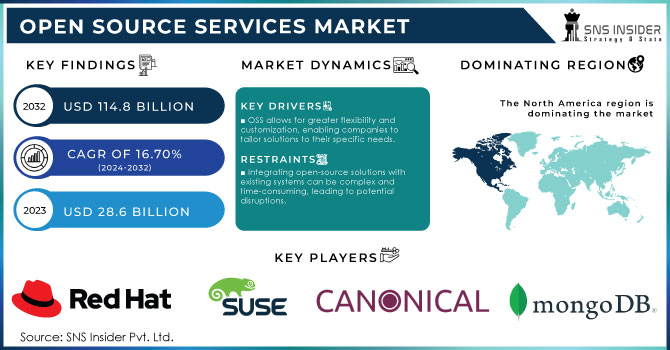
Open Source Services Market was valued at USD 28.6 billion in 2023 and is expected to reach USD 114.8 Billion by 2032, growing at a CAGR of 16.70% from 2024-2032.
The Open Source Services market is expanding rapidly due to the wider adoption of open-source software by a broad array of industries that appreciate the affordability and stupendous flexibility provided by it. An ever-increasing number of businesses are relying on consulting, integration, support, and customization services to help them implement and manage open-source platforms with commendable efficiency. One of the central factors driving the market’s growth is the accelerating process of digital transformation; by using OSS, companies can slash their development costs while enjoying a much higher degree of customization. For instance, cloud-native technologies have seen a pronounced increase in use, which in turn had driven up the demand for consulting and support. Most cloud-native technologies rely on Kubernetes and other forms of containerization, all of which are open source. Another significant factor is the expanding usage of open-source DevOps and automation tools such as Jenkins, Terraform, and Ansible. However, most importantly, the use addendum of artificial intelligence and machine learning has become vital, as many AI/ML frameworks such as TensorFlow and PyTorch are open-source. Most companies in relevant fields opt for professional services in their attempts to implement and maintain these technologies on a large scale.
A relevant example is provided by Red Hat, a well-known provider of open-source software and services that has reportedly experienced a 17% increase in revenue due to the heightened demand for cloud and AI services and products. In another example, in 2024, Deutsche Bank announced its plans to expand its usage of open-source platforms to improve innovation and reduce software costs. The organization expressed its position that even in highly-regulated industries, the use of open source is increasingly necessary for companies to adapt to new economically challenging conditions. Meanwhile, as the importance of software security continues to rise, businesses are increasingly opting for professional open-source services to help them manage vulnerabilities and guarantee compliance, further driving the growth of the market.
Open Source Services Market dynamics
Drivers
-
OSS allows for greater flexibility and customization, enabling companies to tailor solutions to their specific needs.
-
Regulated industries, such as banking, are embracing OSS to drive innovation and reduce software costs.
-
Open-source software (OSS) reduces licensing and development costs, making it an attractive option for businesses.
Open-source software significantly decreases licensing and development costs, and it is the primary factor contributing to its growing adoption in the business environment. Unlike proprietary solutions, which usually heavily affect upfront expenses and further licensing, OSS is generally available at no initial cost or very low price. It allows companies of different scale and industries to implement solutions without a burden of a prohibitively expensive license. Therefore, one of the main appeals of OSS is its low cost of ownership, and it is particularly attractive for startups, small companies, medium-sized enterprises, as well as large organizations willing to optimize their IT budgets.
The advantages of this approach are not limited to simple licensing and ownership cost. Open source facilitates cost savings in development, as they can directly use the open source code or modify the source code based on its preference or need. In this way, the company does not rely on any third party for development and does not need to cover the significant costs of the development of custom software. Correspondingly, open source increases a company’s degree of independence and accelerates innovation. It can employ as many developers needed, who can modify the code and build a product at their own pace.
Finally, one must not forget the work of the active open source communities and contribution development teams. Many of the features of OSS are developed by open source communities, and, therefore, it is not only reasonable but outright more convenient to implement the benefits of OSS without an additional financial cost. The financial advantage of OSS is additionally multiplied by professional services delivered at a fee – such as consulting, integration, custom development, and support. For example, a company can opt for implementing OSS at no cost and secure the expense of consulting services for the successful integration of the technology with business systems. The industries which experience digital transformation are likely to derive the most benefit, as software costs are relatively low and the importance of flexibility is high. The further increase of demand for open-source in the business environment is fueled by the growth of cloud technology, AI, and DevOps
Comparison of Proprietary vs. Open-Source Software Costs
|
Cost Aspect |
Proprietary Software |
Open-Source Software (OSS) |
|---|---|---|
|
Open-Source Software (OSS) |
High, with recurring charges |
Often free or low-cost |
|
Customization Costs |
Requires vendor services or third-party developers |
Can be customized in-house |
|
Support Costs |
Included but often costly |
Optional, through external services |
|
Scalability |
Limited by vendor offerings |
High, with full control over the code |
|
Long-term Maintenance |
Expensive due to vendor lock-in |
Community-driven with ongoing updates |
Restraints
-
Integrating open-source solutions with existing systems can be complex and time-consuming, leading to potential disruptions.
-
A shortage of skilled professionals who understand OSS can hinder implementation and maintenance efforts for organizations.
-
OSS may not always meet the performance or scalability requirements of larger enterprises, limiting its adoption in certain sectors.
Open-source software (OSS) has become increasingly popular because of the benefits it offers in terms of flexibility and cost-effectiveness. However, the software may not always be able to meet the performance and scalability requirements of more massive enterprises consistently, which restrains its acceptance in some industries. Among other things, larger organizations expect the software they use to be able to handle their higher transaction volume, which is why the open-source nature of a program frequently creates complications. In particular, many software development projects with the use of OSS are performed by a community of volunteers as opposed to groups of people working full-time for some company. Accordingly, quality, stability, and performance tend to vary. Although well-known OSS projects, such as Kubernetes or Apache Hadoop, have demonstrated their abilities to be functionally and scalably used by enterprises, many of the less-known programs are incapable of delivering satisfactory results under massive loads or being optimized for further scaling in certain scenarios. As such, companies, especially larger ones, are reluctant to assume the related risks of downtime and performance lowered during scaling when opting to use OSS.
In conclusion, the above-described benefits of employing proprietary software do not mean that no larger enterprises use OSS. However, its risks and limitations present significant obstacles to its widespread acceptance in said environments. A considerable number of companies firstly utilize various programs and then opt for the best-performing solutions, which allows minimizing the risks at the expense of postponing the use of a program. Some of the listed and other considerations force larger companies to adopt a more wary approach to OSS than smaller ones and decide to use it only after weighing their risks and benefits.
Open Source Services Market Segment Analysis
By Services
In 2023, the integration and deployment segment dominated the market and represented over 39.8% of the revenue share. Organizations' increasing adoption of open-source software solutions has led to a surge in demand for professionals proficient in integrating and deploying these technologies. Open-source solutions are typically modular, enabling customization to meet specific business requirements, which requires specialized expertise in integration and deployment to incorporate these solutions into existing IT infrastructures effectively. Furthermore, the complexities of integrating and deploying open-source solutions drive organizations to seek expert guidance to ensure successful implementation.
On the other hand, the managed services segment is projected to witness significant growth during the forecast period. As more organizations adopt open-source technologies, there is a growing need for specialized skills and expertise to manage and maintain these solutions. Managed services providers (MSPs) deliver a range of services, including monitoring, maintenance, and troubleshooting, helping organizations reduce IT costs while improving operational efficiency.
By Deployment
In 2023, the cloud segment dominated the market and accounted for 55.7% of revenue share. Organizations are increasingly turning to cloud deployment due to its inherent scalability, flexibility, and cost-efficiency. The cloud enables rapid provisioning of resources, making it ideal for dynamic business environments. Open-source solutions, known for their modularity and interoperability, are particularly well-suited for cloud platforms, allowing seamless integration, faster deployment, and reduced dependence on proprietary systems. This compatibility with cloud infrastructure supports innovation and accelerates digital transformation across industries.
The hybrid segment is expected to register the fastest CAGR during the forecast period, favored by organizations that require a balance between cloud capabilities and on-premises control. Businesses operating in complex regulatory environments or managing sensitive data often prefer a hybrid deployment, which provides the security and control of on-premises systems alongside the flexibility of the cloud. Open-source technologies further enhance hybrid models by enabling customizable solutions that can be adapted to specific organizational needs. This approach allows companies to scale efficiently, optimize legacy systems, and maintain critical operations without full reliance on a single deployment method
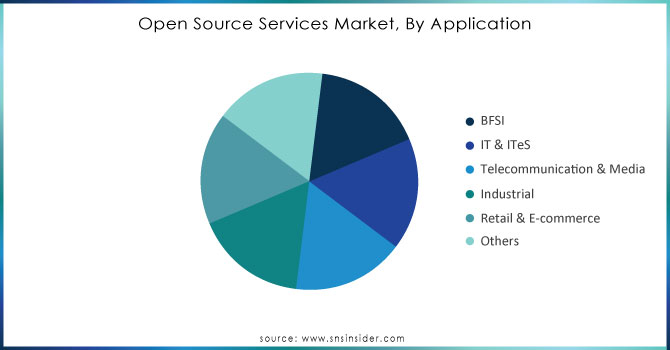
By Application
In 2023, IT & ITeS segment dominated the market and accounting for more than 34.2% revenue share. The segment is at the forefront of driving innovation and leading the digital transformation initiative. Open-source technologies provide the flexibility and customisation IT & ITeS applications demand. Furthermore, majority of the open-source solutions have received contributed enhancements from the community, and, thereby, offer a transparent and collaborative solution. Open-source solutions provide bigger developer and user base to help company develop innovative solution and efficiently address complexity of the businesses.
BFSI is anticipated to grow at a highest CAGR during the forecast period. The BFSI sector deals with large volumes of sensitive data and is regulated by stringent standards. Therefore, BFSI sector has a need for secure, scalable, and robust technology solutions. Moreover, open-source solutions provide a transparent and collaborative approach for developing security standards. The BFSI sector can easily develop and deploy open-source solutions within their existing IT infrastructure, providing the ability to modernise existing technology stack without disrupting business operations.
Do You Need any Customization Research on Open Source Services Market - Enquire Now
By End-user
In 2023, the large enterprise segment dominated the market with a revenue share of over 66.5%. These enterprises are successful in the end-user segment due to their competitive investment capacity in research and development. Accordingly, they use advanced open-source technologies and solutions to drive innovation. In addition, large enterprises can also establish and maintain an in house team of experts dedicated to open source. As a result, they can make the most of using open source while serving and contributing to the open-source community. Moreover, as large enterprises are geographically dispersed, they need a solution that is easy to scale and customize to the needs of all regions and markets. Because open source is most suitable in this situation, large enterprises prefer and use these solutions to a greater extent.
In contrast, the Small and Medium Enterprises segment is expected to witness the fastest growth in the upcoming years. Since the open-source solutions sometimes provide an advantage in terms of cost, they can be very effective in reducing the vendor lock-in. Open-source solutions generally have lower upfront costs than other solutions, which can help SMEs optimize their IT expenditures. In addition, SMEs, which are prone to budget constraints, can develop and implement innovative applications using the open-source solutions without the limitations of proprietary software.
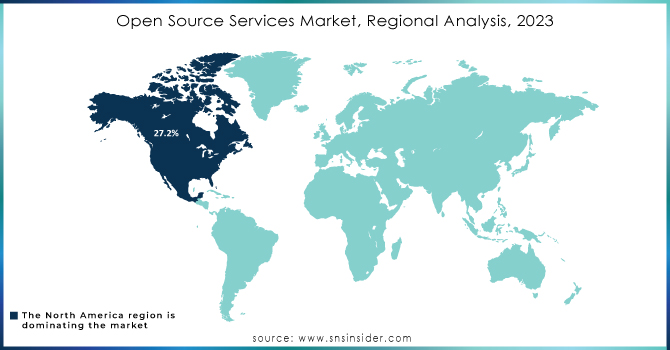
Regional Analysis
North America dominated the market in 2023, accounting for over 27.0% of the revenue share. The region's robust culture of collaboration and innovation has significantly contributed to the development of open-source communities and networks of expertise.
In contrast, the Asia Pacific market is projected to be the fastest-growing region throughout the forecast period. This region features a large and rapidly evolving technology sector, with many companies and organizations seeking affordable and customizable solutions to fulfill their IT requirements. Open-source solutions offer an attractive choice for these businesses, providing flexibility, scalability, and cost savings compared to proprietary software. Moreover, the area is witnessing a surge in startups and entrepreneurs who are increasingly adopting open-source solutions to stimulate innovation and growth.
Key Players
The major key players are
Elastic, IBM, Docker Inc., GitLab, Grafana Labs, Perforce Puppet, Canonical, SUSE CP, Cloudera Inc., MongoDB, JFrog
Recent Developments
In May 24, Open Source Summit North America, This annual conference will unite developers, users, and vendors to explore the latest trends and innovations in open-source software.
In May 24, KubernetesCon North America, This event will spotlight the Kubernetes ecosystem, highlighting new features, best practices, and real-world use cases.
| Report Attributes | Details |
| Market Size in 2023 | USD 28.6 billion |
| Market Size by 2032 | USD 114.8 Billion |
| CAGR | CAGR of 16.70 % From 2024 to 2032 |
| Base Year | 2022 |
| Forecast Period | 2024-2032 |
| Historical Data | 2020-2022 |
| Report Scope & Coverage | Market Size, Segments Analysis, Competitive Landscape, Regional Analysis, DROC & SWOT Analysis, Forecast Outlook |
| Key Segments | • By Services (Integration & Deployment, Training & Consulting, Managed Services, Support & Maintenance) • By End-User (Large Enterprises, Small & Medium Enterprises) • By Deployment (Cloud, Hybrid, On-premise) • By Applications (BFSI, IT & ITes, Telecommunication & Media, Industrial, Retail & E-commerce, Others) |
| Regional Analysis/Coverage | North America (US, Canada, Mexico), Europe (Eastern Europe [Poland, Romania, Hungary, Turkey, Rest of Eastern Europe] Western Europe] Germany, France, UK, Italy, Spain, Netherlands, Switzerland, Austria, Rest of Western Europe]). Asia Pacific (China, India, Japan, South Korea, Vietnam, Singapore, Australia, Rest of Asia Pacific), Middle East & Africa (Middle East [UAE, Egypt, Saudi Arabia, Qatar, Rest of Middle East], Africa [Nigeria, South Africa, Rest of Africa], Latin America (Brazil, Argentina, Colombia Rest of Latin America) |
| Company Profiles |
Red Hat, Inc., SUSE, Canonical Ltd., MongoDB, Inc., Elasticsearch, Inc., GitLab, Inc., Docker, Inc., Cloudera, Inc., HashiCorp, Inc., Confluent, Inc., Puppet, Inc., Ansible (part of Red Hat), Grafana Labs, JFrog Ltd., Chef Software, Inc., OpenStack Foundation, Apache Software Foundation |
| Key Drivers | •OSS allows for greater flexibility and customization, enabling companies to tailor solutions to their specific needs. •Regulated industries, such as banking, are embracing OSS to drive innovation and reduce software costs. •Open-source software (OSS) reduces licensing and development costs, making it an attractive option for businesses. |
| Market Restraints | •Integrating open-source solutions with existing systems can be complex and time-consuming, leading to potential disruptions •A shortage of skilled professionals who understand OSS can hinder implementation and maintenance efforts for organizations •OSS may not always meet the performance or scalability requirements of larger enterprises, limiting its adoption in certain sectors. |
Frequently Asked Questions
Open Source Services Market was valued at USD 28.6 billion in 2023 and is expected to reach USD 114.8 Billion by 2032, growing at a CAGR of 16.70% from 2024-2032.
the CAGR of Open Source Services Market during the forecast period is of 16.70% from 2024-2032.
In 2023, North America led the Open Source Services Market, capturing a significant revenue share of 27.20%.
one main growth factor for the Open Source Services Market is
- OSS allows for greater flexibility and customization, enabling companies to tailor solutions to their specific needs.
challenges in Open Source Services Market are
- Integrating open-source solutions with existing systems can be complex and time-consuming, leading to potential disruptions.
- A shortage of skilled professionals who understand OSS can hinder implementation and maintenance efforts for organizations.
Get in Touch
