Dual And Multi-Energy Computed Tomography Market Report Scope & Overview:
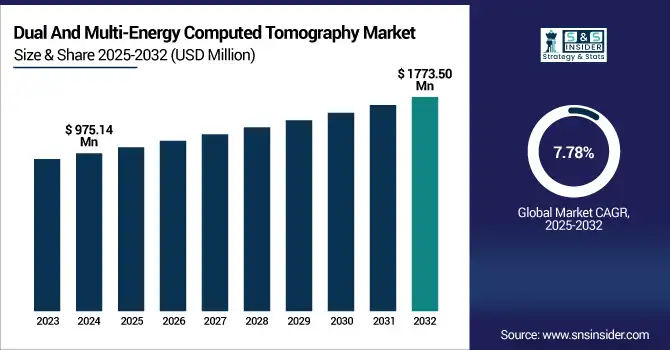
The dual and multi-energy computed tomography market size was valued at USD 975.14 million in 2024 and is expected to reach USD 1773.50 million by 2032, growing at a CAGR of 7.78% over 2025-2032.
To Get more information on Dual And Multi-Energy Computed Tomography Market - Request Free Sample Report
The global dual and multi-energy computed tomography market is significantly driven by the growing requirement for advanced imaging methods in oncology, cardiology, and emergency diagnostics. Such systems allow for accurate tissue characterization, reduction in radiation dosage, and enhanced diagnostic confidence, ultimately increasing clinical utilities by a factor of 5-10 relative to traditional CT.
Great strides have been made in technology from the leading vendors in dual and multi-energy CT, such as Siemens Healthineers (with the patented NAEOTOM Alpha photon-counting CT) and GE HealthCare (with the Revolutionary CT platform). Increase in incidence of chronic diseases and geriatric population, and preference for non-invasive diagnostics, witnessed a surge in the dual and multi-energy computed tomography market in both developed and emerging regions.
In March 2024, GE HealthCare closed two major investments of USD 350 million in strengthening its CT and imaging R&D in the U.S., including dual-layer detector technology and AI image processing, strengthening its presence in the U.S. dual and multi energy computed tomography market space.
Furthermore, rising R&D spending (for instance, Siemens invests more than USD 1.5 billion each year on imaging innovation) and rising approvals by the U.S. FDA to next-gen DECT systems are also driving the worldwide double & multi-energy computed tomography market. The dual and multi-energy computed tomography market in the U.S. is benefiting from increasing hospital uptake and expansion of reimbursement coverage. Growing inclination of dual and multi-energy computed tomography market players towards the AI-integrated platforms and spectral detectors supported with better efficiency of workflow. In addition, academic and clinical partnerships have been driving the supply of innovation, and healthtech investment is supercharging the development of new products. The increasing investments in precision medicine and personalized radiology are also favoring the growth of the dual and multi-energy computed tomography market trends, and are defined as a strong dual and multi-energy computed tomography market analysis.
In May 2024, Siemens Healthineers showcased a high-throughput photon-counting CT upgrade in Europe, which enabled improved spatial resolution and large coverage, while reducing scanning time by as much as 60%, thereby aiding in the increase of the global dual and multi-energy computed tomography market size.
Market Dynamics:
Drivers:
-
Technological Advancements and Clinical Demand Accelerating Adoption and Propelling Market Expansion
The strong technological development, growing diagnostic needs, along with the surging clinical realization, are the driving factors of the dual and multi energy computed tomography market. The market is rapidly changing with the incorporation of AI algorithms, photon-counting detectors, and spectral imaging that permit superior tissue differentiation, faster imaging, and reduced radiation dose.
For instance, Philips introduced the Spectral CT 7500, with efficient scanning designed for speed and reproducibility with even high-BMI patients to improve clinical outcomes. These developments are driving adoption, especially in oncological and cardiovascular imaging, where early detection is decisive.
A growing investment in R&D is contributing as well, with Canon Medical recently launching imaging innovation projects worth well over USD 400 million in 2023. Regulatory agencies such as the U.S. FDA are facilitating this by expediting approval of more advanced systems to expedite commercialization. Consistent with increasing dual and multi energy computed tomography market trends, hospitals are advancing their infrastructure, resulting in the deployment of DECT systems, which continues to amplify the supply-side growth. Further, there is an increase in demand at outpatient imaging centers and emergency care sites, as the trend toward high-resolution, fast-scan diagnostics continues to escalate. These factors are projected to drive the global dual and multi energy computed tomography market growth and will continue to enable a positive climate for scalability and innovation.
Restraints:
-
High Equipment Costs and Technical Complexity Limiting Penetration Hamper the Market Growth
High cost for procurement and operation, shielding facilities, and limited availability in resource-limited clinics are identified limitations included in the dual and multi energy computed tomography market analysis report.
Dual-energy and spectral CT scanners have a higher price tag that can reach more than USD 2 million per scanner and, therefore, are not feasible investments for small boards and independent clinics. Furthermore, the technology is very complex in terms of image reconstruction, analysis of the spectral data, and calibration, and the machines require specially trained radiologists and technicians, presenting operational barriers. These systems also require infrastructure improvements such as sophisticated cooling and larger imaging suites, adding to installation costs.
In the RSNA 2024 survey, almost 45% of radiologists reported that they have challenges interpreting DECT datasets because of the unavailability of standard protocols and training.
Moreover, a lack of uniformity of reimbursement models between health systems is impeding widespread use. Although regulatory agencies such as the FDA have approved various systems, such as spectral CTs, there is still a delay in the worldwide standardization of application guidelines. Another issue is related to data protection and cybersecurity compliance in DECT-based AI-assisted platforms. These are the factors impacting the rural and mid-tier-based facilities, and limiting the dual and multi-energy computed tomography market share of dual and multi energy computed tomography. Therefore, cost, accessibility, and development of skilled manpower are still important elements to harness the full potential of the global dual and multi energy CT market.
Segmentation Analysis:
By Product
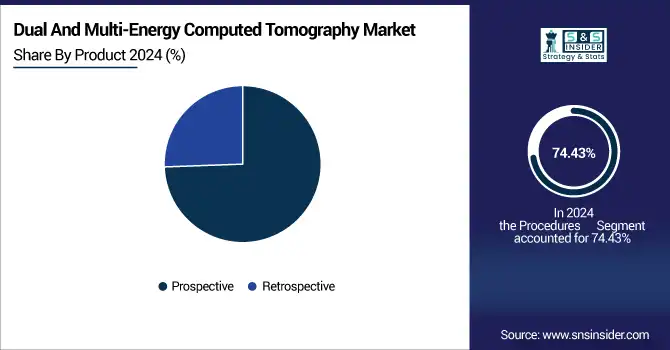
Procedures dominated the dual and multi-energy CT market in 2024, with 74.43% share of the total market. This predominance stems significantly from their strengths in producing higher quality images at lower radiation dose and with superior organ-specific contrast. With its better synchronism with ECG gating, prospective scanning is now more frequently used in cardiac imaging to reduce motion artifacts. On the other hand, retrospective techniques are expected to witness high adoption in the forthcoming years with increased flexibility in imaging irregular heartbeats and continuous helical scanning for trauma and emergency scenarios.
By Application
Oncology was the largest application in 2024, accounting for 27.2% of the revenue and dual and multi-energy computed tomography market share. Dual and multi-energy CT in oncology. The popularity of dual and multi-energy CT in oncology is because it can differentiate tissue types, improve the detection of tumours, and decrease false positives in lesion detection. On the other hand, vascular applications are expected to develop the fastest because of CTEMD technological advances in visualization of vascular structures, plaque characterization, and reduction in the amount of contrast agent administration, with relevant implications for patient cohorts with renal impairment.
By End Use
Hospitals accounted for the largest share of 43.2% in the market in 2024, driven by well-developed infrastructure, availability of skilled healthcare professionals, and high patient volumes, along with access to advanced diagnostic systems. The implementation of dual- and multi-energy CT in tertiary and university hospitals has been instrumental in challenging diagnostics. On the other hand, diagnostic imaging centers are anticipated to be the fastest-growing end-use segment. This growth is due to a rise in patient footfall for outpatient procedures, cheaper imaging rates, shorter waiting times, and increasing private investments in providing centers with advanced DECT scanners.
Regional Analysis:
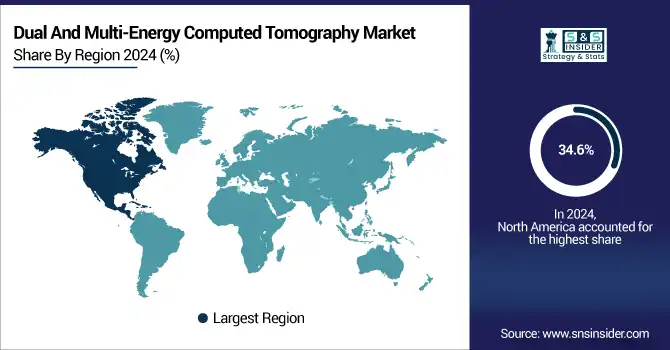
North America was led by the global market in 2024 with a 34.6% revenue share. The dominance of the region can be attributed to the early adoption of sophisticated diagnostic imaging systems, robust infrastructure for healthcare, and favorable reimbursement policies.
The U.S. dual and multi-energy computed tomography market size was valued at USD 254.94 million in 2024 and is expected to reach USD 422.31 million by 2032, growing at a CAGR of 6.56% over 2025-2032. The U.S. holds the largest regional revenue dual and multi-energy computed tomography market share, due to high uptake in the tertiary care hospitals, strong R&D expenditure, and FDA approvals for photon counting and spectral CT systems. Furthermore, leading companies, such as GE HealthCare and Siemens Healthineers, have strategic R&D centers in the U.S., which have been stimulating innovation. Canada is on a dual and multi-energy computed tomography market growth trajectory due to investment in AI-capable radiology and national digital health projects. At the same time, Mexico is being developed as a value-based imaging centre in Latin America, with a growing private healthcare sector.
Europe is the second leading region in the global double and multi energy computed tomography market, driven by government healthcare expenditure, increased chronic disease burden, and leading academic research institutes. Germany is the leading country in the region on account of a high install base of advanced CT systems, presence of OEMs and surge in insurance coverage. In France and the UK, increasing penetration in oncology and cardiac imaging, and the presence of favourable regulation, including CE-marked approvals, have driven the market. The poster child for such arrangements, and physician-owned facilities in general, is Poland, where public-private arrangements increasingly are putting state-of-the-art imaging services in the hands of what the government describes as small private operators. Throughout Europe, enhanced cross-border clinical cooperation and EU financial support are stimulating the dissemination of spectral CT.
Meanwhile, the Asia Pacific dual and multi energy computed tomography market is anticipated to record the highest growth globally, due to growing healthcare infrastructure, government investments for diagnostic imaging, and surging inclination towards early detection of diseases. The region is led by China, where large-scale hospital digitalization projects and domestic innovation are fuelling the market. China dominated the CT system installations in Asia Pacific, with a major share in 2024. India is another large market growing fast (with increasing chronic disease burden, medical tourism, and the government’s Ayushman Bharat scheme improving diagnostic access). Tobacco companies addicted Japan’s large aging population with heavy use of imaging for preventive health screening. Increasing adoption of dual-energy CT systems in countries such as Vietnam and Indonesia for high-volume diagnostics is turning into an important supply-side trend.
Get Customized Report as per Your Business Requirement - Enquiry Now
Key Players:
Leading dual and multi energy computed tomography companies operating in the market include Siemens Healthineers, GE HealthCare, Koninklijke Philips N.V., Canon Medical Systems Corporation, FUJIFILM Corporation, Shimadzu Corporation, Hitachi High-Tech Corporation, Stryker, Koning Health, and Neusoft Medical Systems Co., Ltd.
Recent Developments:
-
In May 2025, GE HealthCare received FDA 510(k) clearance for its Aurora dual-head SPECT/CT system integrated with Clarify DL, an AI-powered deep learning image reconstruction tool. This platform enhances diagnostic precision across cardiology, oncology, and neurology by offering twice the CT detector coverage and smoother workflows, streamlining high-quality imaging in a single session.
-
In January 2025, Philips unveiled the AI-driven CT 5300 spectral scanner at the Asian Oceanian Congress of Radiology in India. Designed to enhance diagnostic capabilities with streamlined workflow efficiency, this launch aligns with growing interest in spectral CT across emerging markets.
| Report Attributes | Details |
|---|---|
| Market Size in 2024 | USD 975.14 million |
| Market Size by 2032 | USD 1773.50 million |
| CAGR | CAGR of 7.78% From 2025 to 2032 |
| Base Year | 2024 |
| Forecast Period | 2025-2032 |
| Historical Data | 2021-2023 |
| Report Scope & Coverage | Market Size, Segments Analysis, Competitive Landscape, Regional Analysis, DROC & SWOT Analysis, Forecast Outlook |
| Key Segments | • By Product (Prospective, Retrospective) • By Application (Oncology, Neurology, Cardiology, Vascular, Musculoskeletal, and Others) • By End Use (Hospitals, Diagnostic Imaging Centers, and Others) |
| Regional Analysis/Coverage | North America (US, Canada, Mexico), Europe (Germany, France, UK, Italy, Spain, Poland, Turkey, Rest of Europe), Asia Pacific (China, India, Japan, South Korea, Singapore, Australia, Rest of Asia Pacific), Middle East & Africa (UAE, Saudi Arabia, Qatar, South Africa, Rest of Middle East & Africa), Latin America (Brazil, Argentina, Rest of Latin America) |
| Company Profiles | Siemens Healthineers, GE HealthCare, Koninklijke Philips N.V., Canon Medical Systems Corporation, FUJIFILM Corporation, Shimadzu Corporation, Hitachi High-Tech Corporation, Stryker, Koning Health, and Neusoft Medical Systems Co., Ltd. |
Frequently Asked Questions
Future trends include rising demand for AI-integrated DECT systems, expansion in outpatient and diagnostic imaging centers, and growing use of spectral CT in personalized and precision medicine.
North America leads the supply chain due to advanced healthcare infrastructure and high R&D investment, while Asia Pacific, particularly China and Japan, is rapidly expanding with local manufacturing and increasing healthcare digitization.
Key players include Siemens Healthineers, GE HealthCare, Philips, Canon Medical Systems, FUJIFILM, Shimadzu Corporation, Koning Health, and Neusoft Medical Systems, contributing to innovation, manufacturing, and global distribution.
The market is driven by increasing demand for advanced diagnostic imaging in oncology and cardiology, growing adoption of AI-powered CT systems, and technological innovations like photon-counting detectors that offer enhanced image quality with reduced radiation dose.
The dual and multi-energy computed tomography market size was valued at USD 975.14 million in 2024 and is expected to reach USD 1773.50 million by 2032, growing at a CAGR of 7.78% over 2025-2032.
Get in Touch
