Get More Information on Electric Mobility Market - Request Sample Report
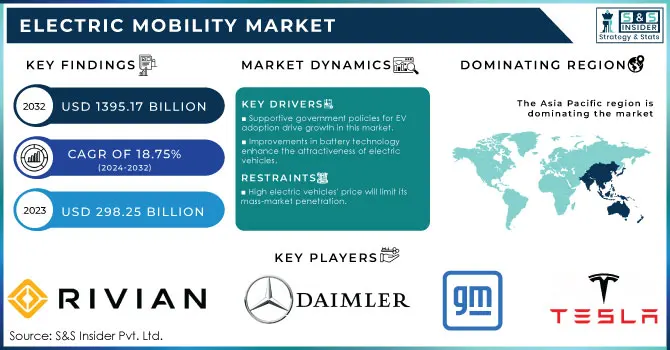
The Electric Mobility Market Size was valued at USD 298.25 Billion in 2023 and is expected to reach USD 1395.17 Billion by 2032 and grow at a CAGR of 18.75% over the forecast period 2024-2032.
The electric mobility market has been growing rapidly due to increasing demand for ecologically friendly transport, new government policies, and technological advancements. In the U.S., China, the UK, France, and Japan, governments are imposing drastic measures aimed at reducing carbon emissions. The United States has provided incentives, such as tax credits, to the buyers of EVs, but China is investing in a massive amount of electric vehicle infrastructure to become the world's biggest electric vehicle market.
The target of ending all gasoline and diesel vehicles by 2030 for the UK and France has been set by Europe. The shift towards sustainability has encouraged investment in electric mobility across the globe, while companies have focused on raising innovation. In terms of unit sales, Electric Vehicles had the sales of 3.5 million units higher compared to 2022, a year-on-year increase of 35% according to GEVO-2023. In 2023, over 250 000 new cars were registered every week, which exceeds the annual totals for 2013, ten years ago. Electric cars now make up around 18% of all the cars sold, up from 14% in 2022 and only 2% five years ago, in 2018
Above all, the rapid growth of electric mobility has been driven in recent times by developments in battery technology. Batteries have mainly been supplied by lithium-ion (Li-ion) technologies because they offer a very high energy density, substantial lifespan, and efficiency. Even newer technologies, such as solid-state batteries, promise yet greater range and performance for electric vehicles, thus opening up more opportunities for market growth. According to the International Energy Association, costs of electric vehicles declined, since the cost of lithium-ion batteries-the component making up approximately 40-60% of EV expense-fell by 90% from USD 1,400 per kilowatt hour in 2010 to USD 140 per kilowatt hour in 2023.
Key Drivers:
Supportive government policies for EV adoption drive growth in this market.
Government Incentives, Subsidies, and Regulations Take Center Stage in Promotion of Electric Mobility. For example, in the U.S., the federal government has introduced tax credits of up to USD 7,500 for electric vehicle purchasers. The federal government is also looking forward to the fact that by doing so, it will enable consumers to pay less in the upfront cost of EVs. The Inflation Reduction Act pays more attention to the enhancement of the infrastructure of EV charging. That will in turn encourage more adoption of EVs. Similarly, in China, it offers subsidies to consumers and manufacturers and compels the manufacturers to produce under certain quotas. These policies also spur the development of a full recharging infrastructure needed to realize mass adoption of electric mobility. In past years, the supportive measures for electrical vehicles have gained momentum as the government began to tighten up emission standards globally to bring upward pressure on the demand for electric vehicles in the electric mobility market.
Improvements in battery technology enhance the attractiveness of electric vehicles.
Battery technology forms the heart of an electric mobility market. Innovations in the past few decades have pushed the ranges and performance of vehicles a little further every quarter-century. The current industry standard, of course, is the Lithium-ion (Li-ion) battery, with its higher energy density, longer life span, and faster recharging times that make these batteries answer most of the questions hitherto subjecting their consumers to high anxiety issues, such as "range anxiety" and charging time.
With these objectives in mind, companies are also developing next-generation solid-state batteries to offer even more energy density and charging times while further improving safety. For example, in September 2024, Panasonic said it is ready to begin mass production of its much-anticipated 4680 lithium-ion battery cells, designed specifically to boost the range, power, charging, and efficiency within electric cars but reduce their cost. Standard EV packs are generally built around 2170 cells – 21mm diameter by 70mm length (0.83 x 2.8 inches). The 4680 cells, as their name would suggest, are much bigger and a little longer at 46 x 80 mm (1.8 x 3.1 inches).
Alongside making electric vehicles better, the developments in technology will also reduce the cost of such vehicles overall, making them more affordable to large populations. Electric cars will be pushed faster into markets worldwide with advancements in battery technology.
Restraints
High electric vehicles' price will limit its mass-market penetration.
Though costs have plummeted, many hold the high initial cost of electric vehicles to be the single biggest impediment to their inclusion in the mainstream, especially for emerging markets. Electric vehicle manufacturing costs are significantly higher compared to a traditional ICE vehicle due to expensive components, mainly batteries. The lions' share of contribution comes from the lithium-ion batteries that actually power most electric vehicles. On the whole, the batteries make the EVs costlier than the gasoline or diesel counterparts.
Government incentives and subsidies are used to reduce the associated costs, though it often remains pretty inadequate for mass consumer adoption in that market, especially in developing regions. Furthermore, while the operating costs for electric vehicles are commonly lower than for conventional vehicles in maintenance and fuel use, the consumers of the time perceive the base price as a huge hurdle to adoption. Indeed, without significant advancement in the depreciation of battery cost or more effective financial incentives, the sticker shock of electric vehicles might slow up the pace into the mass market, more so in locations where consumers are relatively more price-sensitive.
By Battery
The electric mobility market has three major battery types, namely, Sealed Lead Acid, Nickel-Metal Hydride (NiMH), and Lithium-ion (Li-ion).
In the year 2023, Li-ion batteries had dominated the entire market with a whopping 74.91%. The Li-ion battery is strong in terms of high energy density, lightweight, and life cycle, thus making it appropriate for use in electric vehicles. Li-ion technology has also made tremendous mileage in the last few years with faster charge times and longer ranges, both of which are essential for consumers when it comes to adoption.
While the nickel-metal hydride (NiMH) battery segment is supposed to experience the most rapid growth, a CAGR of 20.58% during the period between 2024 and 2032 is envisioned. The demand for NiMH batteries is high for the features of safety and longer life cycles as against lead-acid batteries and hence are suitable for limited commercial applications. With manufacturers scouring for cost-effective battery alternatives, the growth of the NiMH segment is also likely to be extremely fast in electric vehicle markets growing in various regions.
By End User
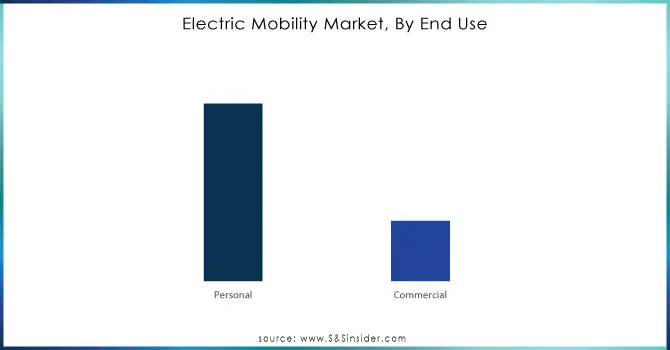
The electric mobility market can also be segmented based on end use, personal use and commercial use. Among them in 2023 the Personal Use held the largest share at 74.69%. That is mainly because of the spurt in electric cars, e-bikes, and electric scooters that are being adopted in sustainable transport. With a galloping pace of urbanization and climate change awareness among citizens, the demand for this segment is also on the rise as consumers are getting keen to reduce their carbon footprint.
Commercial Use is projected to be the most significant growing market, with a CAGR of 19.38% during 2024 to 2032. The use of the electric buses, delivery vans, and other fleet electric vehicles will come under this category. Saving operational costs for logistics companies and future sceneries of public transportation abiding by the environmental regulations will boost up the usage of commercial electric vehicles. The growth in the electric mobility market is likely to be driving the commercial use of electric vehicles as companies focus on sustainability and the governments provide incentives to electrify the fleet.
Need Any Customization Research On Electric Mobility Market - Inquiry Now
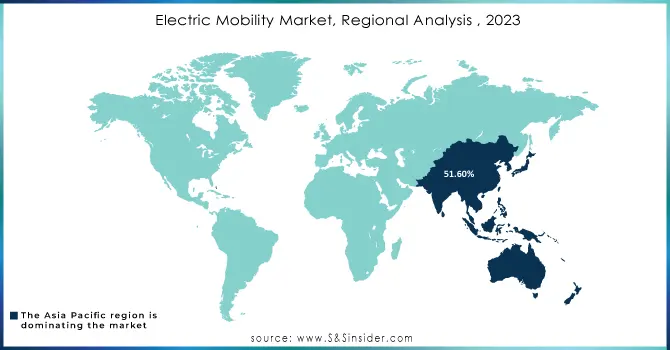
Asia Pacific contributing 51.60% of the market share in the year 2023 in Electric Mobility Market. This dominance is primarily led by China, the world's largest electric vehicle market, supported through various government subsidies, extensive charging infrastructure, and a growing consumer base. For instance, In China, new electric vehicle registrations for the year 2023 were at 8.1 million while it registered an increase of 35% from the year 2022. In terms of sales units, it is projected that the sold China Electric Vehicle market will reach a certain milestone by the year 2032.
The countries like Japan and South Korea also add a significant contribution toward the region's strength through advanced technological innovations in the electric vehicle and battery technologies. Further, the unprecedented rate of urbanization in Asia Pacific has gone hand in hand to complement and support the cause for sustainable transport, hence propelling the electric mobility market growth in this region.
Europe, on the other hand, is going to show the most aggressive growth from 2024 to 2032 with a CAGR of 20.74%. The UK, France, and Germany are becoming pretty aggressive in reducing carbon emissions. In fact, new policies by governments in these countries are planning to phase out internal combustion engine vehicles by 2030 itself, and the region has been investing comprehensively in EV charging infra and renewable energy sources that are set to help this rapid growth. For instance, ENGIE Vianeo strives for excellence in the national charging station network in order to have seamless travel with electric vehicles throughout France. In new electric mobility, they require a reliable partner for the charging infrastructure. Public charging stations are situated all over the highways in France. As such, ENGIE Vianeo is now able to provide sustainable mobility on a national level.
Some of the major players in the Electric Mobility Market are
Tesla Inc. (Electric Cars, Battery Storage)
BYD Company (Electric Buses, Electric Cars)
NIO Inc. (Electric SUVs, Battery Swapping Services)
General Motors (Electric Vehicles, Charging Infrastructure)
Volkswagen Group (Electric Cars, Charging Solutions)
BMW Group (Electric Cars, Charging Stations)
Daimler AG (Electric Trucks, Electric Buses)
Rivian Automotive (Electric Trucks, Adventure Vehicles)
Ford Motor Company (Electric SUVs, Electric Pickup Trucks)
Lucid Motors (Luxury Electric Cars, Battery Technology)
Hyundai Motor Group (Electric Cars, Hydrogen Fuel Cell Vehicles)
XPeng Motors (Electric Sedans, Autonomous Driving Technology)
Volvo Cars (Electric SUVs, Electric Commercial Vehicles)
Renault Group (Electric Cars, EV Charging Solutions)
Geely Auto Group (Electric Cars, Battery Technology)
Polestar (Electric Performance Cars, EV Charging Infrastructure)
Proterra (Electric Buses, Battery Systems)
Kia Corporation (Electric Cars, EV Charging Solutions)
Fisker Inc. (Electric SUVs, EV Battery Technology)
Workhorse Group (Electric Delivery Vans, Drones for Package Delivery)
August 2024: Mahindra & Mahindra (M&M) and Skoda Auto Volkswagen India (SAVWIPL), a unit of the Volkswagen Group, are in the final stages of establishing a 50:50 joint venture that will help split costs, technology, and vehicle platforms on which new products are developed going ahead.
May 2024: The Volkswagen Group's Board of Management has resolved to make entry-level mobility more widespread through all-electric models. Brand Group Core will introduce affordable electric vehicles from Europe, for Europe. The world premiere is scheduled for 2027. Volkswagen has already been working on compact cars-particularly very affordable ones-in the under 20,000 euros range for a long time.
Report Attributes | Details |
---|---|
Market Size in 2023 | US$ 298.25 Billion |
Market Size by 2032 | US$ 1395.17 Billion |
CAGR | CAGR of 18.75% From 2024 to 2032 |
Base Year | 2023 |
Forecast Period | 2024-2032 |
Historical Data | 2020-2022 |
Report Scope & Coverage | Market Size, Segments Analysis, Competitive Landscape, Regional Analysis, DROC & SWOT Analysis, Forecast Outlook |
Key Segments | • By Product (Electric Car, Electric Motorcycle, Electric Scooter, Electric Bicycle, Electric Skateboard, Electric Wheelchair) • By Voltage (Less than 24V, 24V, 36V, 48V, and Greater than 48V) • By Battery (Sealed Lead Acid, NiMH, and Li-ion) • By End Use (Personal Use, Commercial Use) • By Drive (Belt Drive, Belt Drive, Hub Drive) |
Regional Analysis/Coverage | North America (US, Canada, Mexico), Europe (Eastern Europe [Poland, Romania, Hungary, Turkey, Rest of Eastern Europe] Western Europe [Germany, France, UK, Italy, Spain, Netherlands, Switzerland, Austria, Rest of Western Europe]), Asia Pacific (China, India, Japan, South Korea, Vietnam, Singapore, Australia, Rest of Asia Pacific), Middle East & Africa (Middle East [UAE, Egypt, Saudi Arabia, Qatar, Rest of Middle East], Africa [Nigeria, South Africa, Rest of Africa], Latin America (Brazil, Argentina, Colombia, Rest of Latin America) |
Company Profiles | Tesla Inc., BYD Company, NIO Inc., General Motors, Volkswagen Group, BMW Group, Daimler AG, Rivian Automotive, Ford Motor Company, Lucid Motors, Hyundai Motor Group, XPeng Motors, Volvo Cars, Renault Group, Geely Auto Group, Polestar, Proterra, Kia Corporation, Fisker Inc., Workhorse Group. |
Key Drivers | • Supportive government policies for EV adoption drive growth in this market. • Improvements in battery technology enhance the attractiveness of electric vehicles. |
Restraints | • High electric vehicles' price will limit its mass-market penetration. |
Ans: The Electric Mobility Market is expected to grow at a CAGR of 18.75% during 2024-2032.
Ans: Electric Mobility Market size was USD 298.25 Billion in 2023 and is expected to Reach USD 1395.17 Billion by 2032.
Ans: The major growth factors of the Electric Mobility Market are Improvements in battery technology and Government Policies.
Ans: The Li-ion batteries segment dominated the Electric Mobility Market.
Ans: Asia Pacific dominated the Electric Mobility Market in 2023.
TABLE OF CONTENTS:
1. Introduction
1.1 Market Definition
1.2 Scope (Inclusion and Exclusions)
1.3 Research Assumptions
2. Executive Summary
2.1 Market Overview
2.2 Regional Synopsis
2.3 Competitive Summary
3. Research Methodology
3.1 Top-Down Approach
3.2 Bottom-up Approach
3.3. Data Validation
3.4 Primary Interviews
4. Market Dynamics Impact Analysis
4.1 Market Driving Factors Analysis
4.1.1 Drivers
4.1.2 Restraints
4.1.3 Opportunities
4.1.4 Challenges
4.2 PESTLE Analysis
4.3 Porter’s Five Forces Model
5. Statistical Insights and Trends Reporting
5.1 Vehicle Production and Sales Volumes, 2020-2032, by Region
5.2 Emission Standards Compliance, by Region
5.3 Vehicle Technology Adoption, by Region
5.4 Consumer Preferences, by Region
5.5 Aftermarket Trends (Data on vehicle maintenance, parts, and services)
6. Competitive Landscape
6.1 List of Major Companies, By Region
6.2 Market Share Analysis, By Region
6.3 Product Benchmarking
6.3.1 Product specifications and features
6.3.2 Pricing
6.4 Strategic Initiatives
6.4.1 Marketing and promotional activities
6.4.2 Distribution and supply chain strategies
6.4.3 Expansion plans and new product launches
6.4.4 Strategic partnerships and collaborations
6.5 Technological Advancements
6.6 Market Positioning and Branding
7. Electric Mobility Market Segmentation, By Product
7.1 Chapter Overview
7.2 Electric Car
7.2.1 Electric Car Market Trends Analysis (2020-2032)
7.2.2 Electric Car Market Size Estimates and Forecasts to 2032 (USD Billion)
7.3 Electric Motorcycle
7.3.1 Electric Motorcycle Market Trends Analysis (2020-2032)
7.3.2 Electric Motorcycle Market Size Estimates and Forecasts to 2032 (USD Billion)
7.4 Electric Scooter
7.4.1 Electric Scooter Market Trends Analysis (2020-2032)
7.4.2 Electric Scooter Market Size Estimates and Forecasts to 2032 (USD Billion)
7.5 Electric Bicycle
7.5.1 Electric Bicycle Market Trends Analysis (2020-2032)
7.5.2 Electric Bicycle Market Size Estimates and Forecasts to 2032 (USD Billion)
7.6 Electric Skateboard
7.6.1 Electric Skateboard Market Trends Analysis (2020-2032)
7.6.2 Electric Skateboard Market Size Estimates and Forecasts to 2032 (USD Billion)
7.7 Electric Wheelchair
7.7.1 Electric Wheelchair Market Trends Analysis (2020-2032)
7.7.2 Electric Wheelchair Market Size Estimates and Forecasts to 2032 (USD Billion)
8. Electric Mobility Market Segmentation, By Voltage
8.1 Chapter Overview
8.2 Less than 24V
8.2.1 Less than 24V Market Trends Analysis (2020-2032)
8.2.2 Less than 24V Market Size Estimates And Forecasts To 2032 (USD Billion)
8.3 24V
8.3.1 24V Market Trends Analysis (2020-2032)
8.3.2 24V Market Size Estimates And Forecasts To 2032 (USD Billion)
8.4 36V
8.4.1 36V Market Trends Analysis (2020-2032)
8.4.2 36V Market Size Estimates And Forecasts To 2032 (USD Billion)
8.4 48V
8.4.1 48V Market Trends Analysis (2020-2032)
8.4.2 48V Market Size Estimates And Forecasts To 2032 (USD Billion)
8.4 Greater than 48V
8.4.1 Greater than 48V Market Trends Analysis (2020-2032)
8.4.2 Greater than 48V Market Size Estimates And Forecasts To 2032 (USD Billion)
9. Electric Mobility Market Segmentation, By Battery
9.1 Chapter Overview
9.2 Sealed Lead Acid
9.2.1 Sealed Lead Acid Market Trends Analysis (2020-2032)
9.2.2 Sealed Lead Acid Market Size Estimates And Forecasts To 2032 (USD Billion)
9.3 NiMH
9.3.1 NiMH Market Trends Analysis (2020-2032)
9.3.2 NiMH Market Size Estimates And Forecasts To 2032 (USD Billion)
9.4 Li-ion
9.4.1 Li-ion Market Trends Analysis (2020-2032)
9.4.2 Li-ion Market Size Estimates And Forecasts To 2032 (USD Billion)
10. Electric Mobility Market Segmentation, By End Use
10.1 Chapter Overview
10.2 Personal Use
10.2.1 Personal Use Market Trends Analysis (2020-2032)
10.2.2 Personal Use Market Size Estimates And Forecasts To 2032 (USD Billion)
10.3 Commercial Use
10.3.1 Commercial Use Market Trends Analysis (2020-2032)
10.3.2 Commercial Use Market Size Estimates And Forecasts To 2032 (USD Billion)
11. Electric Mobility Market Segmentation, By Drive
11.1 Chapter Overview
11.2 Belt Drive
11.2.1 Belt Drive Market Trends Analysis (2020-2032)
11.2.2 Belt Drive Market Size Estimates And Forecasts To 2032 (USD Billion)
11.3 Belt Drive
11.3.1 Belt Drive Market Trends Analysis (2020-2032)
11.3.2 Belt Drive Market Size Estimates And Forecasts To 2032 (USD Billion)
11.4 Hub Drive
11.4.1 Hub Drive Market Trends Analysis (2020-2032)
11.4.2 Hub Drive Market Size Estimates And Forecasts To 2032 (USD Billion)
12. Regional Analysis
12.1 Chapter Overview
12.2 North America
12.2.1 Trends Analysis
12.2.2 North America Electric Mobility Market Estimates And Forecasts, By Country (2020-2032) (USD Billion)
12.2.3 North America Electric Mobility Market Estimates And Forecasts, By Product (2020-2032) (USD Billion)
12.2.4 North America Electric Mobility Market Estimates And Forecasts, By Voltage (2020-2032) (USD Billion)
12.2.5 North America Electric Mobility Market Estimates And Forecasts, By Battery (2020-2032) (USD Billion)
12.2.6 North America Electric Mobility Market Estimates And Forecasts, By End Use (2020-2032) (USD Billion)
12.2.7 North America Electric Mobility Market Estimates And Forecasts, By Drive (2020-2032) (USD Billion)
12.2.8 USA
12.2.8.1 USA Electric Mobility Market Estimates And Forecasts, By Product (2020-2032) (USD Billion)
12.2.8.2 USA Electric Mobility Market Estimates And Forecasts, By Voltage (2020-2032) (USD Billion)
12.2.8.3 USA Electric Mobility Market Estimates And Forecasts, By Battery (2020-2032) (USD Billion)
12.2.8.4 USA Electric Mobility Market Estimates And Forecasts, By End Use (2020-2032) (USD Billion)
12.2.8.5 USA Electric Mobility Market Estimates And Forecasts, By Drive (2020-2032) (USD Billion)
12.2.9 Canada
12.2.9.1 Canada Electric Mobility Market Estimates And Forecasts, By Product (2020-2032) (USD Billion)
12.2.9.2 Canada Electric Mobility Market Estimates And Forecasts, By Voltage (2020-2032) (USD Billion)
12.2.9.3 Canada Electric Mobility Market Estimates And Forecasts, By Battery (2020-2032) (USD Billion)
12.2.9.4 Canada Electric Mobility Market Estimates And Forecasts, By End Use (2020-2032) (USD Billion)
12.2.9.5 Canada Electric Mobility Market Estimates And Forecasts, By Drive (2020-2032) (USD Billion)
12.2.10 Mexico
12.2.10.1 Mexico Electric Mobility Market Estimates And Forecasts, By Product (2020-2032) (USD Billion)
12.2.10.2 Mexico Electric Mobility Market Estimates And Forecasts, By Voltage (2020-2032) (USD Billion)
12.2.10.3 Mexico Electric Mobility Market Estimates And Forecasts, By Battery (2020-2032) (USD Billion)
12.2.10.4 Mexico Electric Mobility Market Estimates And Forecasts, By End Use (2020-2032) (USD Billion)
12.2.10.5 Mexico Electric Mobility Market Estimates And Forecasts, By Drive (2020-2032) (USD Billion)
12.3 Europe
12.3.1 Eastern Europe
12.3.1.1 Trends Analysis
12.3.1.2 Eastern Europe Electric Mobility Market Estimates And Forecasts, By Country (2020-2032) (USD Billion)
12.3.1.3 Eastern Europe Electric Mobility Market Estimates And Forecasts, By Product (2020-2032) (USD Billion)
12.3.1.4 Eastern Europe Electric Mobility Market Estimates And Forecasts, By Voltage (2020-2032) (USD Billion)
12.3.1.5 Eastern Europe Electric Mobility Market Estimates And Forecasts, By Battery (2020-2032) (USD Billion)
12.3.1.6 Eastern Europe Electric Mobility Market Estimates And Forecasts, By End Use (2020-2032) (USD Billion)
12.3.1.7 Eastern Europe Electric Mobility Market Estimates And Forecasts, By Drive (2020-2032) (USD Billion)
12.3.1.8 Poland
12.3.1.8.1 Poland Electric Mobility Market Estimates And Forecasts, By Product (2020-2032) (USD Billion)
12.3.1.8.2 Poland Electric Mobility Market Estimates And Forecasts, By Voltage (2020-2032) (USD Billion)
12.3.1.8.3 Poland Electric Mobility Market Estimates And Forecasts, By Battery (2020-2032) (USD Billion)
12.3.1.8.4 Poland Electric Mobility Market Estimates And Forecasts, By End Use (2020-2032) (USD Billion)
12.3.1.8.5 Poland Electric Mobility Market Estimates And Forecasts, By Drive (2020-2032) (USD Billion)
12.3.1.9 Romania
12.3.1.9.1 Romania Electric Mobility Market Estimates And Forecasts, By Product (2020-2032) (USD Billion)
12.3.1.9.2 Romania Electric Mobility Market Estimates And Forecasts, By Voltage (2020-2032) (USD Billion)
12.3.1.9.3 Romania Electric Mobility Market Estimates And Forecasts, By Battery (2020-2032) (USD Billion)
12.3.1.9.4 Romania Electric Mobility Market Estimates And Forecasts, By End Use (2020-2032) (USD Billion)
12.3.1.9.5 Romania Electric Mobility Market Estimates And Forecasts, By Drive (2020-2032) (USD Billion)
12.3.1.10 Hungary
12.3.1.10.1 Hungary Electric Mobility Market Estimates And Forecasts, By Product (2020-2032) (USD Billion)
12.3.1.10.2 Hungary Electric Mobility Market Estimates And Forecasts, By Voltage (2020-2032) (USD Billion)
12.3.1.10.3 Hungary Electric Mobility Market Estimates And Forecasts, By Battery (2020-2032) (USD Billion)
12.3.1.10.4 Hungary Electric Mobility Market Estimates And Forecasts, By End Use (2020-2032) (USD Billion)
12.3.1.10.5 Hungary Electric Mobility Market Estimates And Forecasts, By Drive (2020-2032) (USD Billion)
12.3.1.11 Turkey
12.3.1.11.1 Turkey Electric Mobility Market Estimates And Forecasts, By Product (2020-2032) (USD Billion)
12.3.1.11.2 Turkey Electric Mobility Market Estimates And Forecasts, By Voltage (2020-2032) (USD Billion)
12.3.1.11.3 Turkey Electric Mobility Market Estimates And Forecasts, By Battery (2020-2032) (USD Billion)
12.3.1.11.4 Turkey Electric Mobility Market Estimates And Forecasts, By End Use (2020-2032) (USD Billion)
12.3.1.11.5 Turkey Electric Mobility Market Estimates And Forecasts, By Drive (2020-2032) (USD Billion)
12.3.1.12 Rest Of Eastern Europe
12.3.1.12.1 Rest Of Eastern Europe Electric Mobility Market Estimates And Forecasts, By Product (2020-2032) (USD Billion)
12.3.1.12.2 Rest Of Eastern Europe Electric Mobility Market Estimates And Forecasts, By Voltage (2020-2032) (USD Billion)
12.3.1.12.3 Rest Of Eastern Europe Electric Mobility Market Estimates And Forecasts, By Battery (2020-2032) (USD Billion)
12.3.1.12.4 Rest Of Eastern Europe Electric Mobility Market Estimates And Forecasts, By End Use (2020-2032) (USD Billion)
12.3.1.12.5 Rest Of Eastern Europe Electric Mobility Market Estimates And Forecasts, By Drive (2020-2032) (USD Billion)
12.3.2 Western Europe
12.3.2.1 Trends Analysis
12.3.2.2 Western Europe Electric Mobility Market Estimates And Forecasts, By Country (2020-2032) (USD Billion)
12.3.2.3 Western Europe Electric Mobility Market Estimates And Forecasts, By Product (2020-2032) (USD Billion)
12.3.2.4 Western Europe Electric Mobility Market Estimates And Forecasts, By Voltage (2020-2032) (USD Billion)
12.3.2.5 Western Europe Electric Mobility Market Estimates And Forecasts, By Battery (2020-2032) (USD Billion)
12.3.2.6 Western Europe Electric Mobility Market Estimates And Forecasts, By End Use (2020-2032) (USD Billion)
12.3.2.7 Western Europe Electric Mobility Market Estimates And Forecasts, By Drive (2020-2032) (USD Billion)
12.3.2.8 Germany
12.3.2.8.1 Germany Electric Mobility Market Estimates And Forecasts, By Product (2020-2032) (USD Billion)
12.3.2.8.2 Germany Electric Mobility Market Estimates And Forecasts, By Voltage (2020-2032) (USD Billion)
12.3.2.8.3 Germany Electric Mobility Market Estimates And Forecasts, By Battery (2020-2032) (USD Billion)
12.3.2.8.4 Germany Electric Mobility Market Estimates And Forecasts, By End Use (2020-2032) (USD Billion)
12.3.2.8.5 Germany Electric Mobility Market Estimates And Forecasts, By Drive (2020-2032) (USD Billion)
12.3.2.9 France
12.3.2.9.1 France Electric Mobility Market Estimates And Forecasts, By Product (2020-2032) (USD Billion)
12.3.2.9.2 France Electric Mobility Market Estimates And Forecasts, By Voltage (2020-2032) (USD Billion)
12.3.2.9.3 France Electric Mobility Market Estimates And Forecasts, By Battery (2020-2032) (USD Billion)
12.3.2.9.4 France Electric Mobility Market Estimates And Forecasts, By End Use (2020-2032) (USD Billion)
12.3.2.9.5 France Electric Mobility Market Estimates And Forecasts, By Drive (2020-2032) (USD Billion)
12.3.2.10 UK
12.3.2.10.1 UK Electric Mobility Market Estimates And Forecasts, By Product (2020-2032) (USD Billion)
12.3.2.10.2 UK Electric Mobility Market Estimates And Forecasts, By Voltage (2020-2032) (USD Billion)
12.3.2.10.3 UK Electric Mobility Market Estimates And Forecasts, By Battery (2020-2032) (USD Billion)
12.3.2.10.4 UK Electric Mobility Market Estimates And Forecasts, By End Use (2020-2032) (USD Billion)
12.3.2.10.5 UK Electric Mobility Market Estimates And Forecasts, By Drive (2020-2032) (USD Billion)
12.3.2.11 Italy
12.3.2.11.1 Italy Electric Mobility Market Estimates And Forecasts, By Product (2020-2032) (USD Billion)
12.3.2.11.2 Italy Electric Mobility Market Estimates And Forecasts, By Voltage (2020-2032) (USD Billion)
12.3.2.11.3 Italy Electric Mobility Market Estimates And Forecasts, By Battery (2020-2032) (USD Billion)
12.3.2.11.4 Italy Electric Mobility Market Estimates And Forecasts, By End Use (2020-2032) (USD Billion)
12.3.2.11.5 Italy Electric Mobility Market Estimates And Forecasts, By Drive (2020-2032) (USD Billion)
12.3.2.12 Spain
12.3.2.12.1 Spain Electric Mobility Market Estimates And Forecasts, By Product (2020-2032) (USD Billion)
12.3.2.12.2 Spain Electric Mobility Market Estimates And Forecasts, By Voltage (2020-2032) (USD Billion)
12.3.2.12.3 Spain Electric Mobility Market Estimates And Forecasts, By Battery (2020-2032) (USD Billion)
12.3.2.12.4 Spain Electric Mobility Market Estimates And Forecasts, By End Use (2020-2032) (USD Billion)
12.3.2.12.5 Spain Electric Mobility Market Estimates And Forecasts, By Drive (2020-2032) (USD Billion)
12.3.2.13 Netherlands
12.3.2.13.1 Netherlands Electric Mobility Market Estimates And Forecasts, By Product (2020-2032) (USD Billion)
12.3.2.13.2 Netherlands Electric Mobility Market Estimates And Forecasts, By Voltage (2020-2032) (USD Billion)
12.3.2.13.3 Netherlands Electric Mobility Market Estimates And Forecasts, By Battery (2020-2032) (USD Billion)
12.3.2.13.4 Netherlands Electric Mobility Market Estimates And Forecasts, By End Use (2020-2032) (USD Billion)
12.3.2.13.5 Netherlands Electric Mobility Market Estimates And Forecasts, By Drive (2020-2032) (USD Billion)
12.3.2.14 Switzerland
12.3.2.14.1 Switzerland Electric Mobility Market Estimates And Forecasts, By Product (2020-2032) (USD Billion)
12.3.2.14.2 Switzerland Electric Mobility Market Estimates And Forecasts, By Voltage (2020-2032) (USD Billion)
12.3.2.14.3 Switzerland Electric Mobility Market Estimates And Forecasts, By Battery (2020-2032) (USD Billion)
12.3.2.14.4 Switzerland Electric Mobility Market Estimates And Forecasts, By End Use (2020-2032) (USD Billion)
12.3.2.12.5 Switzerland Electric Mobility Market Estimates And Forecasts, By Drive (2020-2032) (USD Billion)
12.3.2.15 Austria
12.3.2.15.1 Austria Electric Mobility Market Estimates And Forecasts, By Product (2020-2032) (USD Billion)
12.3.2.15.2 Austria Electric Mobility Market Estimates And Forecasts, By Voltage (2020-2032) (USD Billion)
12.3.2.15.3 Austria Electric Mobility Market Estimates And Forecasts, By Battery (2020-2032) (USD Billion)
12.3.2.15.4 Austria Electric Mobility Market Estimates And Forecasts, By End Use (2020-2032) (USD Billion)
12.3.2.15.5 Austria Electric Mobility Market Estimates And Forecasts, By Drive (2020-2032) (USD Billion)
12.3.2.16 Rest Of Western Europe
12.3.2.16.1 Rest Of Western Europe Electric Mobility Market Estimates And Forecasts, By Product (2020-2032) (USD Billion)
12.3.2.16.2 Rest Of Western Europe Electric Mobility Market Estimates And Forecasts, By Voltage (2020-2032) (USD Billion)
12.3.2.16.3 Rest Of Western Europe Electric Mobility Market Estimates And Forecasts, By Battery (2020-2032) (USD Billion)
12.3.2.16.4 Rest Of Western Europe Electric Mobility Market Estimates And Forecasts, By End Use (2020-2032) (USD Billion)
12.3.2.16.5 Rest Of Western Europe Electric Mobility Market Estimates And Forecasts, By Drive (2020-2032) (USD Billion)
12.4 Asia Pacific
12.4.1 Trends Analysis
12.4.2 Asia Pacific Electric Mobility Market Estimates And Forecasts, By Country (2020-2032) (USD Billion)
12.4.3 Asia Pacific Electric Mobility Market Estimates And Forecasts, By Product (2020-2032) (USD Billion)
12.4.4 Asia Pacific Electric Mobility Market Estimates And Forecasts, By Voltage (2020-2032) (USD Billion)
12.4.5 Asia Pacific Electric Mobility Market Estimates And Forecasts, By Battery (2020-2032) (USD Billion)
12.4.6 Asia Pacific Electric Mobility Market Estimates And Forecasts, By End Use (2020-2032) (USD Billion)
12.4.7 Asia Pacific Electric Mobility Market Estimates And Forecasts, By Drive (2020-2032) (USD Billion)
12.4.8 China
12.4.8.1 China Electric Mobility Market Estimates And Forecasts, By Product (2020-2032) (USD Billion)
12.4.8.2 China Electric Mobility Market Estimates And Forecasts, By Voltage (2020-2032) (USD Billion)
12.4.8.3 China Electric Mobility Market Estimates And Forecasts, By Battery (2020-2032) (USD Billion)
12.4.8.4 China Electric Mobility Market Estimates And Forecasts, By End Use (2020-2032) (USD Billion)
12.4.8.5 China Electric Mobility Market Estimates And Forecasts, By Drive (2020-2032) (USD Billion)
12.4.9 India
12.4.9.1 India Electric Mobility Market Estimates And Forecasts, By Product (2020-2032) (USD Billion)
12.4.9.2 India Electric Mobility Market Estimates And Forecasts, By Voltage (2020-2032) (USD Billion)
12.4.9.3 India Electric Mobility Market Estimates And Forecasts, By Battery (2020-2032) (USD Billion)
12.4.9.4 India Electric Mobility Market Estimates And Forecasts, By End Use (2020-2032) (USD Billion)
12.4.9.5 India Electric Mobility Market Estimates And Forecasts, By Drive (2020-2032) (USD Billion)
12.4.10 Japan
12.4.10.1 Japan Electric Mobility Market Estimates And Forecasts, By Product (2020-2032) (USD Billion)
12.4.10.2 Japan Electric Mobility Market Estimates And Forecasts, By Voltage (2020-2032) (USD Billion)
12.4.10.3 Japan Electric Mobility Market Estimates And Forecasts, By Battery (2020-2032) (USD Billion)
12.4.10.4 Japan Electric Mobility Market Estimates And Forecasts, By End Use (2020-2032) (USD Billion)
12.4.10.5 Japan Electric Mobility Market Estimates And Forecasts, By Drive (2020-2032) (USD Billion)
12.4.11 South Korea
12.4.11.1 South Korea Electric Mobility Market Estimates And Forecasts, By Product (2020-2032) (USD Billion)
12.4.11.2 South Korea Electric Mobility Market Estimates And Forecasts, By Voltage (2020-2032) (USD Billion)
12.4.11.3 South Korea Electric Mobility Market Estimates And Forecasts, By Battery (2020-2032) (USD Billion)
12.4.11.4 South Korea Electric Mobility Market Estimates And Forecasts, By End Use (2020-2032) (USD Billion)
12.4.11.5 South Korea Electric Mobility Market Estimates And Forecasts, By Drive (2020-2032) (USD Billion)
12.4.12 Vietnam
12.4.12.1 Vietnam Electric Mobility Market Estimates And Forecasts, By Product (2020-2032) (USD Billion)
12.4.12.2 Vietnam Electric Mobility Market Estimates And Forecasts, By Voltage (2020-2032) (USD Billion)
12.4.12.3 Vietnam Electric Mobility Market Estimates And Forecasts, By Battery (2020-2032) (USD Billion)
12.4.12.4 Vietnam Electric Mobility Market Estimates And Forecasts, By End Use (2020-2032) (USD Billion)
12.4.12.5 Vietnam Electric Mobility Market Estimates And Forecasts, By Drive (2020-2032) (USD Billion)
12.4.13 Singapore
12.4.13.1 Singapore Electric Mobility Market Estimates And Forecasts, By Product (2020-2032) (USD Billion)
12.4.13.2 Singapore Electric Mobility Market Estimates And Forecasts, By Voltage (2020-2032) (USD Billion)
12.4.13.3 Singapore Electric Mobility Market Estimates And Forecasts, By Battery (2020-2032) (USD Billion)
12.4.13.4 Singapore Electric Mobility Market Estimates And Forecasts, By End Use (2020-2032) (USD Billion)
12.4.13.5 Singapore Electric Mobility Market Estimates And Forecasts, By Drive (2020-2032) (USD Billion)
12.4.14 Australia
12.4.14.1 Australia Electric Mobility Market Estimates And Forecasts, By Product (2020-2032) (USD Billion)
12.4.14.2 Australia Electric Mobility Market Estimates And Forecasts, By Voltage (2020-2032) (USD Billion)
12.4.14.3 Australia Electric Mobility Market Estimates And Forecasts, By Battery (2020-2032) (USD Billion)
12.4.14.4 Australia Electric Mobility Market Estimates And Forecasts, By End Use (2020-2032) (USD Billion)
12.4.14.5 Australia Electric Mobility Market Estimates And Forecasts, By Drive (2020-2032) (USD Billion)
12.4.15 Rest Of Asia Pacific
12.4.15.1 Rest Of Asia Pacific Electric Mobility Market Estimates And Forecasts, By Product (2020-2032) (USD Billion)
12.4.15.2 Rest Of Asia Pacific Electric Mobility Market Estimates And Forecasts, By Voltage (2020-2032) (USD Billion)
12.4.15.3 Rest Of Asia Pacific Electric Mobility Market Estimates And Forecasts, By Battery (2020-2032) (USD Billion)
12.4.15.4 Rest Of Asia Pacific Electric Mobility Market Estimates And Forecasts, By End Use (2020-2032) (USD Billion)
12.4.15.5 Rest Of Asia Pacific Electric Mobility Market Estimates And Forecasts, By Drive (2020-2032) (USD Billion)
12.5 Middle East And Africa
12.5.1 Middle East
12.5.1.1 Trends Analysis
12.5.1.2 Middle East Electric Mobility Market Estimates And Forecasts, By Country (2020-2032) (USD Billion)
12.5.1.3 Middle East Electric Mobility Market Estimates And Forecasts, By Product (2020-2032) (USD Billion)
12.5.1.4 Middle East Electric Mobility Market Estimates And Forecasts, By Voltage (2020-2032) (USD Billion)
12.5.1.5 Middle East Electric Mobility Market Estimates And Forecasts, By Battery (2020-2032) (USD Billion)
12.5.1.6 Middle East Electric Mobility Market Estimates And Forecasts, By End Use (2020-2032) (USD Billion)
12.5.1.7 Middle East Electric Mobility Market Estimates And Forecasts, By Drive (2020-2032) (USD Billion)
12.5.1.8 UAE
12.5.1.8.1 UAE Electric Mobility Market Estimates And Forecasts, By Product (2020-2032) (USD Billion)
12.5.1.8.2 UAE Electric Mobility Market Estimates And Forecasts, By Voltage (2020-2032) (USD Billion)
12.5.1.8.3 UAE Electric Mobility Market Estimates And Forecasts, By Battery (2020-2032) (USD Billion)
12.5.1.8.4 UAE Electric Mobility Market Estimates And Forecasts, By End Use (2020-2032) (USD Billion)
12.5.1.8.5 UAE Electric Mobility Market Estimates And Forecasts, By Drive (2020-2032) (USD Billion)
12.5.1.9 Egypt
12.5.1.9.1 Egypt Electric Mobility Market Estimates And Forecasts, By Product (2020-2032) (USD Billion)
12.5.1.9.2 Egypt Electric Mobility Market Estimates And Forecasts, By Voltage (2020-2032) (USD Billion)
12.5.1.9.3 Egypt Electric Mobility Market Estimates And Forecasts, By Battery (2020-2032) (USD Billion)
12.5.1.9.4 Egypt Electric Mobility Market Estimates And Forecasts, By End Use (2020-2032) (USD Billion)
12.5.1.9.5 Egypt Electric Mobility Market Estimates And Forecasts, By Drive (2020-2032) (USD Billion)
12.5.1.10 Saudi Arabia
12.5.1.10.1 Saudi Arabia Electric Mobility Market Estimates And Forecasts, By Product (2020-2032) (USD Billion)
12.5.1.10.2 Saudi Arabia Electric Mobility Market Estimates And Forecasts, By Voltage (2020-2032) (USD Billion)
12.5.1.10.3 Saudi Arabia Electric Mobility Market Estimates And Forecasts, By Battery (2020-2032) (USD Billion)
12.5.1.10.4 Saudi Arabia Electric Mobility Market Estimates And Forecasts, By End Use (2020-2032) (USD Billion)
12.5.1.10.5 Saudi Arabia Electric Mobility Market Estimates And Forecasts, By Drive (2020-2032) (USD Billion)
12.5.1.11 Qatar
12.5.1.11.1 Qatar Electric Mobility Market Estimates And Forecasts, By Product (2020-2032) (USD Billion)
12.5.1.11.2 Qatar Electric Mobility Market Estimates And Forecasts, By Voltage (2020-2032) (USD Billion)
12.5.1.11.3 Qatar Electric Mobility Market Estimates And Forecasts, By Battery (2020-2032) (USD Billion)
12.5.1.11.4 Qatar Electric Mobility Market Estimates And Forecasts, By End Use (2020-2032) (USD Billion)
12.5.1.11.5 Qatar Electric Mobility Market Estimates And Forecasts, By Drive (2020-2032) (USD Billion)
12.5.1.12 Rest Of Middle East
12.5.1.12.1 Rest Of Middle East Electric Mobility Market Estimates And Forecasts, By Product (2020-2032) (USD Billion)
12.5.1.12.2 Rest Of Middle East Electric Mobility Market Estimates And Forecasts, By Voltage (2020-2032) (USD Billion)
12.5.1.12.3 Rest Of Middle East Electric Mobility Market Estimates And Forecasts, By Battery (2020-2032) (USD Billion)
12.5.1.12.4 Rest Of Middle East Electric Mobility Market Estimates And Forecasts, By End Use (2020-2032) (USD Billion)
12.5.1.12.5 Rest Of Middle East Electric Mobility Market Estimates And Forecasts, By Drive (2020-2032) (USD Billion)
12.5.2 Africa
12.5.2.1 Trends Analysis
12.5.2.2 Africa Electric Mobility Market Estimates And Forecasts, By Country (2020-2032) (USD Billion)
12.5.2.3 Africa Electric Mobility Market Estimates And Forecasts, By Product (2020-2032) (USD Billion)
12.5.2.4 Africa Electric Mobility Market Estimates And Forecasts, By Voltage (2020-2032) (USD Billion)
12.5.2.5 Africa Electric Mobility Market Estimates And Forecasts, By Battery (2020-2032) (USD Billion)
12.5.2.6 Africa Electric Mobility Market Estimates And Forecasts, By End Use (2020-2032) (USD Billion)
12.5.2.7 Africa Electric Mobility Market Estimates And Forecasts, By Drive (2020-2032) (USD Billion)
12.5.2.8 South Africa
12.5.2.8.1 South Africa Electric Mobility Market Estimates And Forecasts, By Product (2020-2032) (USD Billion)
12.5.2.8.2 South Africa Electric Mobility Market Estimates And Forecasts, By Voltage (2020-2032) (USD Billion)
12.5.2.8.3 South Africa Electric Mobility Market Estimates And Forecasts, By Battery (2020-2032) (USD Billion)
12.5.2.8.4 South Africa Electric Mobility Market Estimates And Forecasts, By End Use (2020-2032) (USD Billion)
12.5.2.8.5 South Africa Electric Mobility Market Estimates And Forecasts, By Drive (2020-2032) (USD Billion)
12.5.2.9 Nigeria
12.5.2.9.1 Nigeria Electric Mobility Market Estimates And Forecasts, By Product (2020-2032) (USD Billion)
12.5.2.9.2 Nigeria Electric Mobility Market Estimates And Forecasts, By Voltage (2020-2032) (USD Billion)
12.5.2.9.3 Nigeria Electric Mobility Market Estimates And Forecasts, By Battery (2020-2032) (USD Billion)
12.5.2.9.4 Nigeria Electric Mobility Market Estimates And Forecasts, By End Use (2020-2032) (USD Billion)
12.5.2.9.5 Nigeria Electric Mobility Market Estimates And Forecasts, By Drive (2020-2032) (USD Billion)
12.5.2.10 Rest Of Africa
12.5.2.10.1 Rest Of Africa Electric Mobility Market Estimates And Forecasts, By Product (2020-2032) (USD Billion)
12.5.2.10.2 Rest Of Africa Electric Mobility Market Estimates And Forecasts, By Voltage (2020-2032) (USD Billion)
12.5.2.10.3 Rest Of Africa Electric Mobility Market Estimates And Forecasts, By Battery (2020-2032) (USD Billion)
12.5.2.10.4 Rest Of Africa Electric Mobility Market Estimates And Forecasts, By End Use (2020-2032) (USD Billion)
12.5.2.10.5 Rest Of Africa Electric Mobility Market Estimates And Forecasts, By Drive (2020-2032) (USD Billion)
12.6 Latin America
12.6.1 Trends Analysis
12.6.2 Latin America Electric Mobility Market Estimates And Forecasts, By Country (2020-2032) (USD Billion)
12.6.3 Latin America Electric Mobility Market Estimates And Forecasts, By Product (2020-2032) (USD Billion)
12.6.4 Latin America Electric Mobility Market Estimates And Forecasts, By Voltage (2020-2032) (USD Billion)
12.6.5 Latin America Electric Mobility Market Estimates And Forecasts, By Battery (2020-2032) (USD Billion)
12.6.6 Latin America Electric Mobility Market Estimates And Forecasts, By End Use (2020-2032) (USD Billion)
12.6.7 Latin America Electric Mobility Market Estimates And Forecasts, By Drive (2020-2032) (USD Billion)
12.6.8 Brazil
12.6.8.1 Brazil Electric Mobility Market Estimates And Forecasts, By Product (2020-2032) (USD Billion)
12.6.8.2 Brazil Electric Mobility Market Estimates And Forecasts, By Voltage (2020-2032) (USD Billion)
12.6.8.3 Brazil Electric Mobility Market Estimates And Forecasts, By Battery (2020-2032) (USD Billion)
12.6.8.4 Brazil Electric Mobility Market Estimates And Forecasts, By End Use (2020-2032) (USD Billion)
12.6.8.5 Brazil Electric Mobility Market Estimates And Forecasts, By Drive (2020-2032) (USD Billion)
12.6.9 Argentina
12.6.9.1 Argentina Electric Mobility Market Estimates And Forecasts, By Product (2020-2032) (USD Billion)
12.6.9.2 Argentina Electric Mobility Market Estimates And Forecasts, By Voltage (2020-2032) (USD Billion)
12.6.9.3 Argentina Electric Mobility Market Estimates And Forecasts, By Battery (2020-2032) (USD Billion)
12.6.9.4 Argentina Electric Mobility Market Estimates And Forecasts, By End Use (2020-2032) (USD Billion)
12.6.9.5 Argentina Electric Mobility Market Estimates And Forecasts, By Drive (2020-2032) (USD Billion)
12.6.10 Colombia
12.6.10.1 Colombia Electric Mobility Market Estimates And Forecasts, By Product (2020-2032) (USD Billion)
12.6.10.2 Colombia Electric Mobility Market Estimates And Forecasts, By Voltage (2020-2032) (USD Billion)
12.6.10.3 Colombia Electric Mobility Market Estimates And Forecasts, By Battery (2020-2032) (USD Billion)
12.6.10.4 Colombia Electric Mobility Market Estimates And Forecasts, By End Use (2020-2032) (USD Billion)
12.6.10.5 Colombia Electric Mobility Market Estimates And Forecasts, By Drive (2020-2032) (USD Billion)
12.6.11 Rest Of Latin America
12.6.11.1 Rest Of Latin America Electric Mobility Market Estimates And Forecasts, By Product (2020-2032) (USD Billion)
12.6.11.2 Rest Of Latin America Electric Mobility Market Estimates And Forecasts, By Voltage (2020-2032) (USD Billion)
12.6.11.3 Rest Of Latin America Electric Mobility Market Estimates And Forecasts, By Battery (2020-2032) (USD Billion)
12.6.11.4 Rest Of Latin America Electric Mobility Market Estimates And Forecasts, By End Use (2020-2032) (USD Billion)
12.6.11.5 Rest Of Latin America Electric Mobility Market Estimates And Forecasts, By Drive (2020-2032) (USD Billion)
13. Company Profiles
13.1 Tesla Inc.
13.1.1 Company Overview
13.1.2 Financial
13.1.3 Products/ Services Offered
13.1.4 SWOT Analysis
13.2 BYD Company.
13.2.1 Company Overview
13.2.2 Financial
13.2.3 Products/ Services Offered
13.2.4 SWOT Analysis
13.3 NIO Inc
13.3.1 Company Overview
13.3.2 Financial
13.3.3 Products/ Services Offered
13.3.4 SWOT Analysis
13.4 Volkswagen Group
13.4.1 Company Overview
13.4.2 Financial
13.4.3 Products/ Services Offered
13.4.4 SWOT Analysis
13.5 General Motors
13.5.1 Company Overview
13.5.2 Financial
13.5.3 Products/ Services Offered
13.5.4 SWOT Analysis
13.6 BMW Group
13.6.1 Company Overview
13.6.2 Financial
13.6.3 Products/ Services Offered
13.6.4 SWOT Analysis
13.7 Daimler AG
13.7.1 Company Overview
13.7.2 Financial
13.7.3 Products/ Services Offered
13.7.4 SWOT Analysis
13.8 Rivian Automotive
13.8.1 Company Overview
13.8.2 Financial
13.8.3 Products/ Services Offered
13.8.4 SWOT Analysis
13.9 Ford Motor Company
13.9.1 Company Overview
13.9.2 Financial
13.9.3 Products/ Services Offered
13.9.4 SWOT Analysis
13.10 Lucid Motors
13.12.1 Company Overview
13.12.2 Financial
13.12.3 Products/ Services Offered
13.12.4 SWOT Analysis
14. Use Cases and Best Practices
15. Conclusion
An accurate research report requires proper strategizing as well as implementation. There are multiple factors involved in the completion of good and accurate research report and selecting the best methodology to compete the research is the toughest part. Since the research reports we provide play a crucial role in any company’s decision-making process, therefore we at SNS Insider always believe that we should choose the best method which gives us results closer to reality. This allows us to reach at a stage wherein we can provide our clients best and accurate investment to output ratio.
Each report that we prepare takes a timeframe of 350-400 business hours for production. Starting from the selection of titles through a couple of in-depth brain storming session to the final QC process before uploading our titles on our website we dedicate around 350 working hours. The titles are selected based on their current market cap and the foreseen CAGR and growth.
The 5 steps process:
Step 1: Secondary Research:
Secondary Research or Desk Research is as the name suggests is a research process wherein, we collect data through the readily available information. In this process we use various paid and unpaid databases which our team has access to and gather data through the same. This includes examining of listed companies’ annual reports, Journals, SEC filling etc. Apart from this our team has access to various associations across the globe across different industries. Lastly, we have exchange relationships with various university as well as individual libraries.
Step 2: Primary Research
When we talk about primary research, it is a type of study in which the researchers collect relevant data samples directly, rather than relying on previously collected data. This type of research is focused on gaining content specific facts that can be sued to solve specific problems. Since the collected data is fresh and first hand therefore it makes the study more accurate and genuine.
We at SNS Insider have divided Primary Research into 2 parts.
Part 1 wherein we interview the KOLs of major players as well as the upcoming ones across various geographic regions. This allows us to have their view over the market scenario and acts as an important tool to come closer to the accurate market numbers. As many as 45 paid and unpaid primary interviews are taken from both the demand and supply side of the industry to make sure we land at an accurate judgement and analysis of the market.
This step involves the triangulation of data wherein our team analyses the interview transcripts, online survey responses and observation of on filed participants. The below mentioned chart should give a better understanding of the part 1 of the primary interview.
Part 2: In this part of primary research the data collected via secondary research and the part 1 of the primary research is validated with the interviews from individual consultants and subject matter experts.
Consultants are those set of people who have at least 12 years of experience and expertise within the industry whereas Subject Matter Experts are those with at least 15 years of experience behind their back within the same space. The data with the help of two main processes i.e., FGDs (Focused Group Discussions) and IDs (Individual Discussions). This gives us a 3rd party nonbiased primary view of the market scenario making it a more dependable one while collation of the data pointers.
Step 3: Data Bank Validation
Once all the information is collected via primary and secondary sources, we run that information for data validation. At our intelligence centre our research heads track a lot of information related to the market which includes the quarterly reports, the daily stock prices, and other relevant information. Our data bank server gets updated every fortnight and that is how the information which we collected using our primary and secondary information is revalidated in real time.
Step 4: QA/QC Process
After all the data collection and validation our team does a final level of quality check and quality assurance to get rid of any unwanted or undesired mistakes. This might include but not limited to getting rid of the any typos, duplication of numbers or missing of any important information. The people involved in this process include technical content writers, research heads and graphics people. Once this process is completed the title gets uploader on our platform for our clients to read it.
Step 5: Final QC/QA Process:
This is the last process and comes when the client has ordered the study. In this process a final QA/QC is done before the study is emailed to the client. Since we believe in giving our clients a good experience of our research studies, therefore, to make sure that we do not lack at our end in any way humanly possible we do a final round of quality check and then dispatch the study to the client.
Market Segmentation
By Product
• Electric Car
• Electric Motorcycle
• Electric Scooter
• Electric Bicycle
• Electric Skateboard
• Electric Wheelchair
By Voltage
• Less than 24V
• 24V
• 36V
• 48V
• Greater than 48V
By Battery
• Sealed Lead Acid
• NiMH
• Li-ion
By End Use
• Personal Use
• Commercial Use
By Drive
• Belt Drive
• Chain Drive
• Hub Drive
Request for Segment Customization as per your Business Requirement: Segment Customization Request
REGIONAL COVERAGE:
North America
US
Canada
Mexico
Europe
Eastern Europe
Poland
Romania
Hungary
Turkey
Rest of Eastern Europe
Western Europe
Germany
France
UK
Italy
Spain
Netherlands
Switzerland
Austria
Rest of Western Europe
Asia Pacific
China
India
Japan
South Korea
Vietnam
Singapore
Australia
Rest of Asia Pacific
Middle East & Africa
Middle East
UAE
Egypt
Saudi Arabia
Qatar
Rest of the Middle East
Africa
Nigeria
South Africa
Rest of Africa
Latin America
Brazil
Argentina
Colombia
Request for Country Level Research Report: Country Level Customization Request
Available Customization
With the given market data, SNS Insider offers customization as per the company’s specific needs. The following customization options are available for the report:
Product Analysis
Criss-Cross segment analysis (e.g. Product X Application)
Product Matrix which gives a detailed comparison of product portfolio of each company
Geographic Analysis
Additional countries in any of the regions
Company Information
Detailed analysis and profiling of additional market players (Up to five)
The Automotive Smart Tire Market Size was valued at USD 90.90 billion in 2023 and is expected to reach USD 206.39 billion by 2032 and grow at a CAGR of 8.60% over the forecast period 2024-2032.
The Automotive Simulation Market Size was valued at USD 1.85 billion in 2023 and is expected to reach USD 4.05 billion by 2031 and grow at a CAGR of 10.3% over the forecast period 2024-2031.
The Automotive Flywheel Market size was valued at USD 14.05 Bn in 2023 and is expected to reach by USD 17.39 Bn by 2031 and grow at a CAGR of 2.74% over the forecast period 2024-2031.
The Automotive Software Market Size was valued at USD 19.52 billion in 2023 and is expected to reach USD 38.05 billion by 2032 and grow at a CAGR of 7.7% over the forecast period 2024-2032.
The Dashboard Camera Market size was value at USD 4.10 Bn in 2023 and is expected to reach USD 8.47 Bn by 2031 and grow at a CAGR of 9.5% over the forecast period of 2024-2031.
The Automotive Data Logger Market size was valued at USD 3.94 billion in 2023 and is expected to reach USD 7.80 billion by 2032 and grow at a CAGR of 7.89% over the forecast period 2024-2032.
Hi! Click one of our member below to chat on Phone