Electronic Waste Recycling Market Size Analysis:
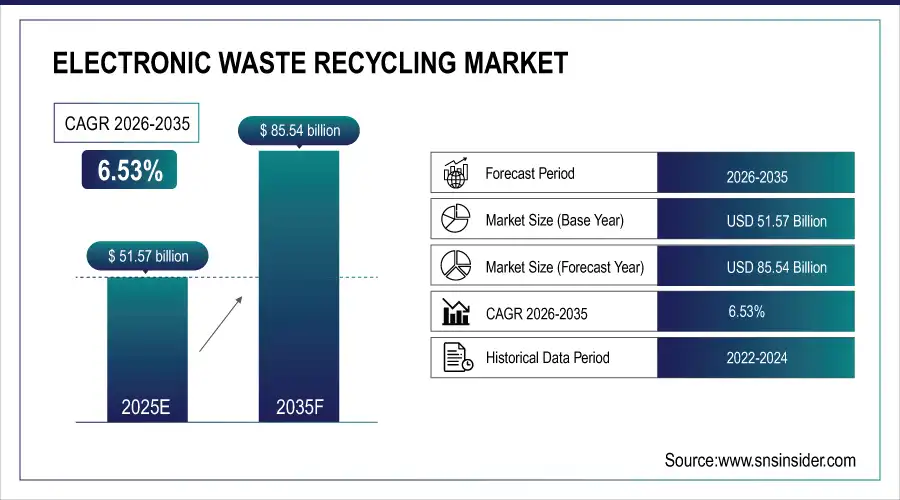
The Electronic Waste Recycling Market size was valued at USD 51.57 Billion in 2025 and is projected to reach USD 85.54 Billion by 2035, growing at a CAGR of 6.53% during 2026-2035.
The Electronic Waste Recycling market is experiencing strong growth driven by increasing volumes of discarded electronics, growing environmental conservation standards and regulations. The increasing awareness of recycling, including sustainable IT asset disposition (ITAD), secure data destruction and re Material recovery is causing domestic companies, enterprises and public institutions to take certified-recycling measures. Operational efficiency and transparency within the sector are being overhauled by the adoption of advanced technology solutions like artificial intelligence for diagnostics, supply chain logics optimization, tracing an asset in real-time and through entire supply chains.
Electronic Waste Recycling Market Size and Forecast:
-
Market Size in 2025: USD 51.57 Billion
-
Market Size by 2035: USD 85.54 Billion
-
CAGR: 6.53% from 2026 to 2035
-
Base Year: 2025
-
Forecast Period: 2026–2035
-
Historical Data: 2022–2024
To Get more information on Electronic Waste Recycling Market - Request Free Sample Report
Key Trends in the Electronic Waste Recycling Market:
-
Rising volumes of discarded consumer electronics driven by rapid product obsolescence and shorter device lifecycles.
-
Stricter government regulations and extended producer responsibility (EPR) policies promoting formal e-waste collection and recycling.
-
Increasing recovery of valuable metals such as gold, copper, lithium, and rare earth elements from electronic waste.
-
Growing adoption of advanced recycling technologies, including automated sorting, AI-based material identification, and hydrometallurgical processes.
-
Expansion of organized and certified recycling facilities to address environmental and data security concerns.
-
Rising corporate sustainability initiatives and circular economy practices encouraging responsible e-waste management.
-
Increasing investments and partnerships between recycling companies, electronics manufacturers, and waste management firms.
Techbros to Open Artificial Intelligence Powered, R2v3 Certified Electronics Recycling Facility in Arizona; Enabling Enhanced Diagnostic Efficiency and Logistics with Data Security It is promoting sustainable ITAD with zero-landfill policy and transparency in compliance which is an added initiative of the Company.
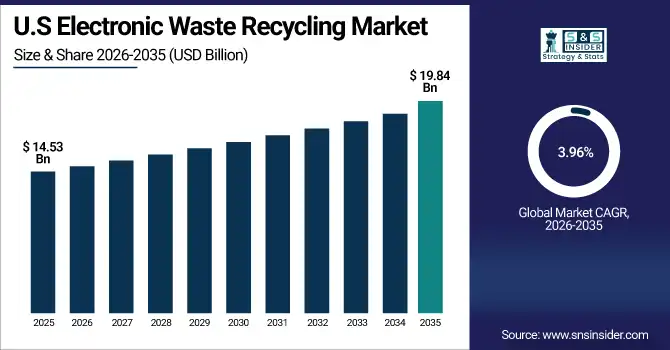
The U.S Electronic Waste Recycling Market size was valued at USD 14.53 Billion in 2025 and is projected to reach USD 19.84 Billion by 2035, growing at a CAGR of 3.96% during 2026-2035. The growth of his e-waste lifecycle management business is fueled by the rising tide of e-waste generation, environmental regulations getting stricter, and demand for proper handling of old IT assets from sectors such as healthcare, data centers and government agencies. Technological innovations like AI-enabled diagnostic, logistics and asset tracking for operational efficiency and compliance. Consumer awareness and corporate sustainability commitments are fueling growth in the use of certified recyclers, which also means a more circular electronics economy.
The Electronic Waste Recycling market trends include the rising integration of AI and automation for efficient diagnostics, logistics, and data destruction, along with the growing adoption of certified recycling practices like R2v3 and ISO standards. The volume of corporate sustainability goals, and through regulatory compliance has caused an increase in demand for secure IT Asset Disposition (ITAD). Zero-landfill policies, real-time asset tracking and expanding recycling infrastructure beyond regions are further fueling the trend towards a more transparent, efficient and sustainable recycling ecosystem consistent with the principles of the circular economy.
Electronic Waste Recycling Market Drivers:
-
Community-Led Recycling Programs Spark Growth in E-Waste Recovery Infrastructure
The increasing dominance of local government-led recycling and education initiatives has driven the growth of the Electronic Waste Recycling market. Officials are also helping to ensure that safe e-waste disposal moves forward, through community programs they set up that provide special recycling waste services available for items like electronics, furniture and paint at the same time they create public awareness filled with valuable information. They have gone a long way to raising community consciousness, improving collection rates, and expanding volumes. Linking with schools for outreach ensures that sustainable habits are instiled from a young age, and the widespread availability of collection points and support services guarantee local recycling solutions for stigma-free recycling at the household level. These models are also gaining traction regionally, bolstering local recycling infrastructure and hastening a broader push toward environmental stewardship. Such grass roots movements, are the only means for ensuring a long term growth and impact in e-waste recycling
The Clark County Solid Waste District recycled more than 57,000 tons in the county in 2024 and educational programs to 2,000 students in recycling best practices. That included targeted e-waste recycling, as well as more than 120 classroom programs in order to further countywide sustainability education.
Electronic Waste Recycling Market Restraints:
-
Complex Device Structures and High Recovery Costs Limit E-Waste Recycling Efficiency and Market Expansion
The Electronic Waste Recycling market faces significant restraint due to high processing costs and the complexity of recovering valuable materials from mixed e-waste streams. Most electronic devices typically include dangerous materials and complex architectures, which necessitate time-consuming and costly disassembly and material isolation. Material recycling due to varying commodity prices is not always commercial without support pricing for extracted resources such as copper, gold, or rare earth metals. The absence of established norms of product design and recycling legislation disparities amongst countries can impact productivity. Due to low margins, recycling businesses cannot negotiate premium prices, which deters them from expanding and forces them to use outdated methods and less expensive techniques that drive up recycling processing cost. These challenges result to unmitigated growth of the electronic waste recycling industry as profits are reduced and there is no incentive for investing in the enterprise.
Electronic Waste Recycling Market Opportunities:
-
Rising E-Waste Volumes and Regulatory Pressures Drive Demand for Scalable Recycling Solutions
The growing amount of e-waste, increasing environmental awareness and stringent regulatory requirements are presenting strong market opportunities for advanced e-waste recycling solutions. With sustainability and circular economy practices now firmly on the agenda in countries around the world, there is a growing need for more efficient recycling infrastructure – automated kind sorting, secure data destruction and high yield material recovery systems. In this context of expanding urbanization, digitalisation and high pace technology development, more and more obsolete electronics end up in landfills due to absence of scalable and compliant recycling operations. Innovative, low-cost and environmentally friendly recycling technologies -- and the businesses that provide them -- will thus be well placed to meet both public sector and private-sector requirements, while communicating an alignment with stronger Government policy settings aimed at reducing reliance on landfills and promoting re-material recovery.
OECD urges Southeast Asia to boost plastic recycling through stronger policies and targeted investments to cut environmental leakage by 95% by 2050.Plastics use in the region hit 152 million metric tons in 2022, with recycling rates needing to quadruple for lasting impact.
Electronic Waste Recycling Market Challenges:
-
Global Waste Challenges Underscore Limitations of Traditional Recycling and Drive Demand for Scalable E-Waste Solutions
The growing visibility of plastic and electronic waste accumulation, particularly in regions like South Korea, is highlighting the limitations of current recycling systems. Since many electronic devices contain hazardous substances and complex Material structures, dismantling and material separation are expensive and laborious endeavours. Moreover, the cost of processing is compounded by the fact that the price of recovered materials like copper, gold, and rare earth metals is volatile, making recycling uneconomically viable without subsidies. Efficiency is further inhibited by the scarcity of standardization in product design and recycling rules in various regions. As a result of these difficulties, recyclers’ profit margins are slim, and there is little investment in infrastructure or market expansion. The electronic waste recycling industry’s general growth is limited as a result of these constraints, especially in developing markets where technology and finance are limited.
South Korea under fire over plastic waste build-up as it gears up to host U.N. treaty talks Even with this recycling push, experts caution it can't keep pace with increasing plastic production and call for global limits on plastic manufacturing
Electronic Waste Recycling Market Segmentation Analysis:
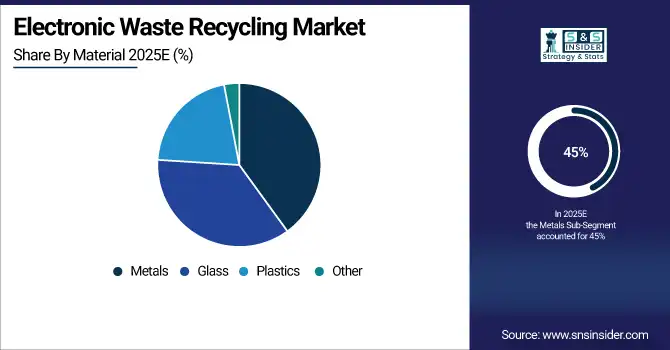
By Material, Metals Segment Dominates Electronic Waste Recycling Market with 45% Share in 2025, Plastics Segment to Record Fastest Growth with 9.29% CAGR
The Metals segment held a dominant share of approximately 45% in 2025, driven by the high recovery value of precious and base metals such as gold, copper, aluminum, and palladium present in discarded electronic products. Rising metal prices, increasing focus on resource recovery, and strong sustainability initiatives have reinforced the importance of metals recycling within the electronic waste ecosystem.
The Plastics segment is expected to witness the fastest growth in the Electronic Waste Recycling market over 2026–2035, registering a CAGR of 9.29%. This growth is supported by the increasing use of plastic components in electronic devices and growing environmental concerns regarding plastic waste. Technological advancements in plastic separation and recycling processes are further accelerating demand for efficient and sustainable plastic recovery solutions.
By Source, Household Appliances Segment Dominates Electronic Waste Recycling Market with 44% Share in 2025, IT & Telecommunication Segment to Grow at Fastest CAGR of 9.79%
The Household Appliances segment accounted for approximately 45% of the market share in 2025, owing to the large volume of discarded products such as refrigerators, washing machines, air conditioners, and microwaves. Rising replacement cycles of home appliances, improved consumer awareness regarding proper disposal, and supportive regulatory frameworks have significantly contributed to the dominance of this segment.
The IT & Telecommunication segment is projected to experience the fastest growth in the Electronic Waste Recycling market during 2026–2035, with a CAGR of 9.79%. Rapid device turnover of smartphones, laptops, servers, and networking equipment, along with increasing digitalization and data security concerns, are key growth drivers. Stricter compliance regulations related to e-waste handling are further boosting recycling activities in this segment.
By Technology, Pyrometallurgical Process Segment Leads with 45% Share in 2025, Lithium Battery Recycling Segment to Register Fastest Growth with 11.17% CAGR
The Pyrometallurgical Process segment dominated the market with approximately 45% share in 2025, due to its effectiveness in recovering precious metals such as gold, copper, and palladium from complex electronic waste streams. Its ability to process mixed materials at high recovery rates and operate efficiently at an industrial scale makes it a widely adopted technology in large-scale recycling operations.
The Lithium Battery Recycling segment is expected to grow at the fastest pace over 2026–2035, with a CAGR of 11.17%. This rapid growth is driven by the increasing adoption of lithium-ion batteries across consumer electronics, electric vehicles, and energy storage systems. Growing concerns over resource depletion, environmental impact, and stringent regulations governing battery disposal are encouraging investments in advanced lithium battery recycling technologies.
By End-Use Industry, Automotive Segment Holds Leading Share of 31% in 2025, Industrial Equipment Segment to Grow at Fastest CAGR of 8.53%
The Automotive segment accounted for approximately 31% of the Electronic Waste Recycling market in 2025, driven by the growing integration of electronic components such as sensors, control units, infotainment systems, and battery packs in modern vehicles. The accelerating shift toward electric vehicles and stricter regulations related to end-of-life vehicle recycling are further strengthening demand in this segment.
The Industrial Equipment segment is anticipated to register the fastest growth over the 2026–2035 period, with a CAGR of 8.53%. Rapid industrial automation, increased digitization of machinery, and the need for responsible disposal of obsolete equipment are key drivers. Additionally, heightened regulatory pressure and corporate sustainability objectives are encouraging higher recycling rates across industrial sectors.
Electronic Waste Recycling Market Regional Insights:
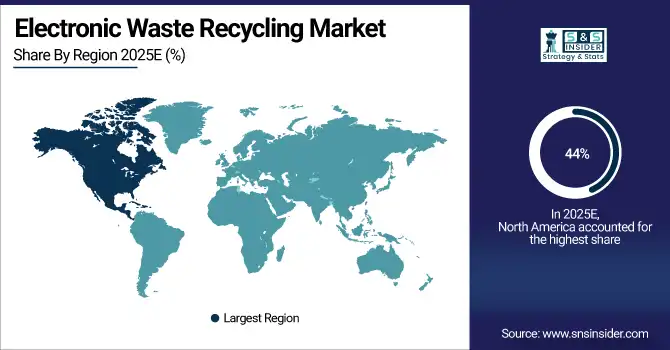
North America Dominates Electronic Waste Recycling Market in 2025
In 2025, North America accounted for approximately 44% of the Electronic Waste Recycling Market revenue, driven by its well-established recycling infrastructure, stringent environmental regulations, and high consumer awareness regarding responsible e-waste disposal. The region benefits from a strong presence of IT asset disposition (ITAD) providers and certified recycling facilities, supporting efficient collection and processing of electronic waste across residential, commercial, and industrial sectors. A growing emphasis on sustainability and corporate environmental responsibility further reinforces North America’s leadership in the global e-waste recycling landscape.
The United States leads the North American market, supported by robust regulatory frameworks, advanced recycling technologies, and widespread adoption of environmentally compliant disposal practices. Canada also contributes significantly through government-backed recycling programs and increasing public awareness initiatives.
Get Customized Report as per Your Business Requirement - Enquiry Now
Asia-Pacific is the Fastest-Growing Region in Electronic Waste Recycling Market
Asia-Pacific is expected to witness the fastest growth in the Electronic Waste Recycling Market over 2026–2035, registering a projected CAGR of 8.19%. This rapid expansion is fueled by accelerating urbanization, rising consumption of electronic devices, and increasing regulatory focus on sustainable waste management practices. Expanding recycling infrastructure, favorable government initiatives, and growing public awareness are significantly strengthening market growth across the region.
China, India, and Southeast Asian countries are key contributors to Asia-Pacific’s growth, driven by large populations, increasing electronic production and consumption, and improving formal recycling systems. Government-led e-waste regulations and investments in modern recycling facilities are further accelerating regional market expansion.
Europe Electronic Waste Recycling Market Insights, 2025
In 2025, Europe emerged as a strong and steadily growing region in the Electronic Waste Recycling Market, supported by stringent environmental regulations and well-enforced extended producer responsibility (EPR) policies. The region’s strong emphasis on circular economy practices, high consumer awareness, and advanced recycling infrastructure has positioned Europe as a key contributor to global e-waste recovery efforts.
Countries such as Germany, the United Kingdom, and France are leading the European market, driven by strict compliance requirements, high collection rates, and continuous investments in innovative recycling technologies.
Latin America and Middle East & Africa Electronic Waste Recycling Market Insights
Latin America (LATAM) and the Middle East & Africa (MEA) regions are witnessing steady growth in the Electronic Waste Recycling Market, driven by rising electronic consumption, increasing awareness of environmental impacts, and gradual improvements in recycling infrastructure. Government initiatives, international support programs, and public–private partnerships are helping strengthen formal e-waste management systems in these regions.
Brazil and Mexico lead the LATAM market, while South Africa and the UAE are key contributors in the MEA region. Growing awareness of sustainable waste management and increasing regulatory focus are expected to support continued market expansion across these emerging regions.
Electronic Waste Recycling Companies are:
-
Sims Recycling Solutions
-
Veolia Environnement S.A.
-
Waste Management, Inc.
-
Umicore N.V.
-
Stena Recycling
-
Electronic Recyclers International (ERI)
-
GEEP (Global Electric Electronic Processing)
-
MBA Polymers
-
Aurubis AG
-
Boliden Group
-
Attero Recycling
-
Clean Earth, Inc.
-
Enviro-Hub Holdings Ltd.
-
Cimelia Resource Recovery
-
Glencore
-
ATRenew
-
Gazelle (ecoATM Gazelle)
-
Sircel
-
Electrocycling GmbH
-
Dongjiang Environmental Company Ltd.
Competitive Landscape of the Electronic Waste Recycling Market:
Sims Recycling Solutions
Sims Recycling Solutions is a global leader in electronic waste recycling and IT asset disposition (ITAD), operating as a division of Sims Limited. Headquartered in the U.S., the company has a strong presence across North America, Europe, Asia-Pacific, and Latin America. It specializes in secure electronics recycling, certified data destruction, and recovery of valuable materials from end-of-life electronics, supporting circular economy objectives and regulatory compliance.
-
In March 2024, Sims Recycling Solutions expanded its electronics recycling and ITAD service capabilities to support growing enterprise demand for secure and sustainable e-waste management.
Veolia Environnement S.A.
Veolia Environnement S.A. is a France-based multinational environmental services company with extensive operations in waste management, water, and energy services. In the Electronic Waste Recycling Market, Veolia offers end-to-end e-waste collection, treatment, and material recovery solutions for municipal, commercial, and industrial customers, leveraging advanced recycling technologies and large-scale infrastructure.
-
In June 2024, Veolia strengthened its circular economy initiatives by enhancing advanced material recovery processes for electronic waste across its European operations.
Waste Management, Inc.
Waste Management, Inc. is a U.S.-based environmental services provider delivering integrated solutions for solid waste, hazardous waste, and electronic waste recycling. The company plays a significant role in the e-waste recycling market through its nationwide collection network, compliant recycling programs, and secure disposal services for consumer electronics and enterprise IT assets.
-
In September 2024, Waste Management, Inc. expanded its electronics recycling and sustainability-focused service offerings to address rising corporate and regulatory requirements for responsible e-waste disposal.
Umicore N.V.
Umicore N.V. is a Belgium-based global materials technology and recycling company renowned for its expertise in precious and critical metals recovery. In the Electronic Waste Recycling Market, Umicore utilizes advanced smelting and refining technologies to recover gold, silver, copper, palladium, and other valuable metals from complex electronic waste streams.
-
In November 2024, Umicore advanced its high-value e-waste recycling operations by increasing processing efficiency and reinforcing its closed-loop recycling systems to support sustainable materials management.
| Report Attributes | Details |
|---|---|
| Market Size in 2025 | USD 51.57 Billion |
| Market Size by 2035 | USD 85.54 Billion |
| CAGR | CAGR of 6.53% From 2025 to 2035 |
| Base Year | 2025 |
| Forecast Period | 2026-2035 |
| Historical Data | 2022-2024 |
| Report Scope & Coverage | Market Size, Segments Analysis, Competitive Landscape, Regional Analysis, DROC & SWOT Analysis, Forecast Outlook |
| Key Segments | • By Material (Glass, Metals, Plastics and Other Materials) • By Source (Household Appliances, Consumer Electronics, It & Telecommunication, Mobile Computing Devices and Other Material) • By Technology(Electrostatic Separation, Pyrometallurgical Process, Hydrometallurgical Process, Lithium Battery Recycling and Other Technologies) • By End-Use Industry(Automotive, Consumer Electronics, Industrial Equipment, Energy & Utilities and Others) |
| Regional Analysis/Coverage | North America (US, Canada), Europe (Germany, UK, France, Italy, Spain, Russia, Poland, Rest of Europe), Asia Pacific (China, India, Japan, South Korea, Australia, ASEAN Countries, Rest of Asia Pacific), Middle East & Africa (UAE, Saudi Arabia, Qatar, South Africa, Rest of Middle East & Africa), Latin America (Brazil, Argentina, Mexico, Colombia, Rest of Latin America). |
| Company Profiles | The Electronic Waste Recycling Market Dell Inc., Umicore SA, Quantum Lifecycle Partners, Enviro-Hub Holdings Ltd., Kuusakoski Oy, Stena Metall AB, Call2Recycle Inc., Aurubis AG, E-Parisara Pvt. Ltd., ERI, Boliden Group, Attero Recycling Pvt. Ltd., Veolia, SIMS Ltd., Great Lakes Electronic Corporation, TES-AMM, Electrocycling GmbH, Cimelia Resource Recovery, MBA Polymers Inc., Envirocycle Inc. and Others. |
Frequently Asked Questions
North America dominated the Electronic Waste Recycling Market in 2025.
The “Metals” segment dominated the Electronic Waste Recycling Market
The electronic waste recycling market is driven by increasing e-waste volumes, strict regulations, and demand for re Material recovery.
The Electronic Waste Recycling Market Size was valued at USD 51.57 Billion in 2025 and is projected to reach USD 85.54 Billion by 2035
The Electronic Waste Recycling Market is expected to grow at a CAGR of 6.53% during 2026-2035.
Get in Touch
