Static VAR Compensator Market Report Scope & Overview:
Get more information on Static VAR Compensator Market - Request Sample Report
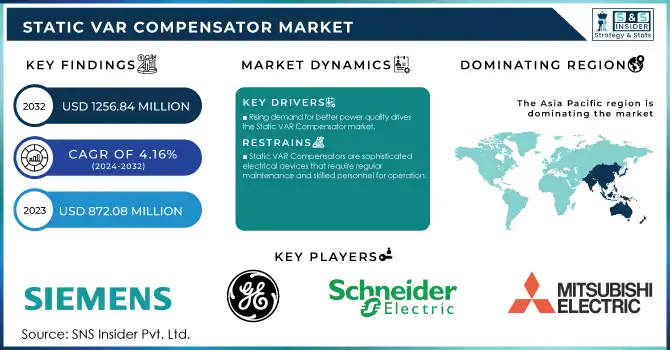
The Static VAR Compensator Market Size was valued at USD 872.08 Million in 2023 and is expected to reach USD 1256.84 Million by 2032 and grow at a CAGR of 4.16% over the forecast period 2024-2032.
The static var compensator (SVC) market has experienced significant growth in recent years, driven by the increasing demand for efficient power systems and the critical need to maintain voltage stability in power grids. In 2024, a global survey of 75 energy professionals revealed the urgency for greater investment in power grid modernization, with 87% agreeing that infrastructure expansion is vital for future energy security. This need for grid improvements aligns with the global push to meet Paris climate goals, as 91% of the respondents emphasized that modernizing the power grid is essential to achieving these objectives. At the core of SVC technology is its ability to stabilize the power grid by controlling reactive power, which plays a pivotal role in voltage regulation and improving transmission line efficiency. By using power electronic systems, such as thyristors, SVCs can switch between capacitive and inductive states, absorbing or supplying reactive power as needed to balance fluctuating power demands and ensure voltage stability. This function is particularly crucial in regions with highly variable loads and where grid stability is vital, with driving market growth.
In industries like oil and gas, Static VAR Compensators are indispensable for managing voltage fluctuations that occur during dynamic load changes, such as the startup or shutdown of large equipment like pumps, compressors, and drilling rigs. Companies like ABB provide advanced power quality solutions, including SVCs, to support voltage stability in high-demand sectors such as offshore platforms, oil refineries, and other critical facilities. The rapid and precise voltage support offered by SVCs helps maintain operational stability, safeguard sensitive electronic equipment, and ensure the reliability of automated control systems, all of which are essential for the safe and efficient operations of oil and gas infrastructure. The ongoing growth in the SVC market reflects the increasing demand for reliable, efficient, and adaptable power systems across various industries, driven by the need for enhanced voltage regulation and the push for cleaner, more sustainable energy practices.
Static VAR Compensator Market Dynamics:
Drivers
-
The growing demand for improved power quality across industrial, commercial, and residential sectors is one of the primary drivers of the Static VAR Compensator (SVC) market.
Power quality is impacted by problems such as voltage instability, harmonics, flicker, and imbalances in reactive power. These problems may result in equipment failures, reduced energy efficiency, and expensive periods of inactivity. SVCs are utilized for voltage level stabilization and offering reactive power compensation to alleviate these issues. The demand for dependable and steady electrical systems has increased due to the growth of industries, particularly in developing countries. Sectors like manufacturing, steelmaking, mining, and telecommunications need reliable and top-notch power supplies to keep operations running smoothly. An interruption in the electricity supply can result in major financial losses and inefficiencies in operations, highlighting the importance of SVCs in the power system. Static VAR compensators assist in stabilizing the grid by instantly compensating for fluctuations in reactive power, allowing for smooth integration of renewable energy sources. Therefore, the increasing need for enhancing power quality in both conventional and sustainable energy production leads to the expansion of the static VAR compensator (SVC) market.
-
The modernization and expansion of electrical grids, particularly in developing countries, is another significant driver of the static VAR compensator (SVC) market.
The worldwide shift towards updating grid systems involves incorporating new technologies to improve the reliability, efficiency, and capacity of power systems. Efforts to bring electricity to rural and remote areas necessitate strong and dependable infrastructure to guarantee a consistent power supply. Static VAR compensators are crucial in ensuring that regions with newly electrified areas have a consistent and uninterrupted power supply through voltage regulation and reactive power compensation. Grid modernization in advanced countries includes updating old equipment with smarter, more efficient devices capable of reacting to current conditions. SVCs play a role in this modernization effort by providing quick, dependable, and adaptable voltage control solutions. SVCs improve grid stability and lower the chance of voltage-related problems by offering reactive power compensation when demand is high or when incorporating distributed energy resources. Additionally, with increased grid interconnections, there is a growing requirement for effective voltage regulation, leading to an increased need for SVC systems.
Restraints
-
Static VAR Compensators are sophisticated electrical devices that require regular maintenance and skilled personnel for operation.
The complexity of their installation and integration into power systems often requires specialized knowledge, and managing their operation may necessitate ongoing training for operators. Maintenance activities can also be costly, as SVC systems are equipped with advanced components such as thyristors and power electronics, which require precise and careful handling. The technical expertise required to maintain and troubleshoot SVCs is often in short supply, particularly in regions where there is a shortage of skilled electrical engineers or technicians. The operational and maintenance costs associated with SVCs can add to the financial burden for utilities, especially in regions where labor costs are high or specialized support is hard to find. Additionally, SVCs require careful tuning to adapt to the specific characteristics of a grid, and any misalignment can lead to operational inefficiencies or failures. This complexity in maintenance and operation limits the willingness of some utilities and industries to adopt SVCs, as it may lead to additional costs and operational challenges over the lifespan of the equipment.
Static VAR Compensator Market Segments Analysis
By Type
The thyristor-based SVC segment dominated the Static VAR Compensator market in 2023, holding a significant 57% market share. This dominance is attributed to the ability of Thyristor-based SVCs to provide fast and precise control over the reactive power, which is crucial for maintaining voltage stability in power systems. Thyristor-controlled reactors (TCR) and Thyristor-switched capacitors (TSC) are the primary components of this technology, enabling rapid compensation of voltage fluctuations. For example, Siemens, for instance, integrates these devices in high-voltage transmission networks to enhance power quality and stability.
The MCR-based segment is projected to become the fastest-growing market during 2024-2032, due to its simpler and more cost-effective nature compared to Thyristor-based systems. MCR-based SVCs utilize the magnetic control principle to adjust the inductive reactive power, making them more efficient in low-voltage applications and regions with lower reactive power requirements. Companies like GE Grid Solutions leverage MCR-based SVCs for industrial power correction systems and electrical grids requiring minimal reactive power control.
By Component
The reactor segment dominated with a 28% market share in the Static VAR Compensator (SVC) market, holding a 41% market share in 2023. Reactors are used to control voltage fluctuations and stabilize power systems, especially in scenarios where large amounts of reactive power are needed. By introducing inductive reactance, reactors reduce voltage spikes and improve power quality in transmission and distribution systems. Companies like Siemens and ABB utilize reactors in their SVC solutions for power plants and substations to ensure grid stability and efficiency, offering improved voltage control in power systems across various industrial sectors.
The capacitor bank segment is expected to be the fastest-growing segment in the static VAR compensator market from 2024 to 2032. They help in correcting power factor imbalances, reducing transmission losses, and ensuring efficient voltage regulation. The growth of capacitor banks can be attributed to the rising demand for improving energy efficiency and lowering power consumption costs in various industrial and commercial sectors. Companies like General Electric and Schneider Electric offer capacitor bank-based solutions for industries such as manufacturing, petrochemicals, and renewable energy, helping optimize energy usage and reduce operational costs.
Static VAR Compensator Market Regional Overview
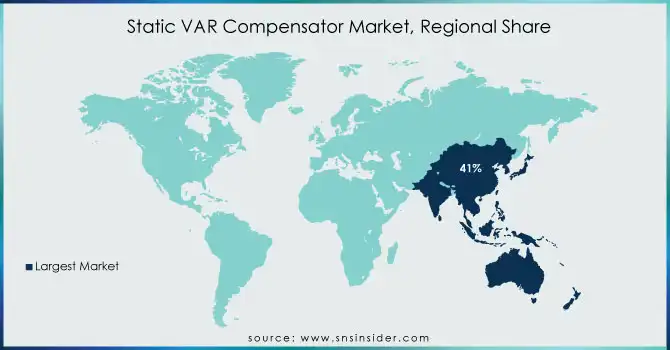
In 2023, APAC held a 41% market share and dominated the static VAR compensator (SVC) market because of its quick industrial development, the existence of sizable power plants, and the growing need for dependable grid stabilization. The area is a center for leading companies like Toshiba and Hyundai Electric, serving a variety of sectors including manufacturing, utilities, and renewable energy. China's quick growth of its power grid and alternative energy capacity has boosted the need for SVCs. Businesses in India, like Bharat Heavy Electricals Limited (BHEL), have a significant impact on enhancing voltage regulation in the expanding power industry by offering SVC solutions.
Europe is projected to experience the most rapid growth rate in the static VAR compensator (SVC) market from 2024 to 2032. Nations like Germany, France, and the UK are incorporating sophisticated SVC technologies to control varying renewable energy sources and maintain grid reliability. Siemens Energy and ABB are highly engaged in the European market, offering advanced SVC systems to power companies and renewable energy producers. Europe's dedication to sustainability and reducing carbon emissions, as shown through initiatives like the European Green Deal, has led to investments in energy storage and flexible power systems.
Need any customization research on Static VAR Compensator Market - Enquiry Now
Key Players in Static VAR Compensator Market
The major key players in the Static VAR Compensator Market are:
-
Siemens (SVC-Plus, SVC Power Quality)
-
General Electric (SVC Technology, STATCOM)
-
Schneider Electric (SVC-Plus, Reactive Power Compensation System)
-
Mitsubishi Electric (SVC System, Dynamic VAR Compensator)
-
ABB (Power Quality Systems, SVC Light)
-
Eaton (Powerware SVC, Dynamic Voltage Control)
-
Hitachi (SVC Systems, Dynamic Power Control)
-
Toshiba (SVC System, SVC with High Voltage)
-
IEM (SVC Solutions, VAR Control System)
-
Wilson Transformer Company (SVC Rectifiers, Reactive Power Compensator)
-
Jiangsu Zhongtian Technology (ZTVAR, ZTSVC)
-
Hyundai Electric (SVC System, Voltage Control System)
-
NKT (SVC Series, VAR Compensator Systems)
-
Schweitzer Engineering Laboratories (SVC Digital Controller, VAR Compensator Units)
-
S&C Electric (SVC Light, Power Flow Control)
-
Sterling and Wilson (SVC Technology, Reactive Power Compensation)
-
SE Energy (Static VAR Compensator, High Voltage VAR Compensator)
-
Trench Group (Dynamic VAR System, Power System Stability Solutions)
-
Baoding Tianwei Group (SVC Solution, VAR Control System)
-
Larsen & Toubro (Static VAR Compensation, Power Quality Solutions)
Suppliers of components for Static VAR Compensator systems:
-
General Electric (Power Electronics, Control Systems)
-
ABB (Switchgear Components, Capacitors)
-
Siemens (Power Semiconductors, Circuit Breakers)
-
Rheinmetall (Resistors, Transformers)
-
Mersen (Capacitors, Surge Protection Devices)
-
Carlyle Group (Power Electronics, IGBT Modules)
-
Vishay (Resistors, Diodes)
-
Infineon Technologies (IGBT Modules, Power Transistors)
-
Eaton (Switches, Circuit Protection Devices)
-
Nexans (Cables, Busbars)
Recent Development:
-
May 2023: Mitsubishi Electric Corporation revealed today that its affiliate Shihlin Electric & Engineering Corporation in Taipei has been awarded a contract by Taiwan Power Company for Taiwan's inaugural static synchronous compensator (STATCOM) for power grid stabilization.
-
March 2023: Mitsubishi Electric Corporation revealed it had secured an order for a static synchronous compensator (STATCOM) with a ±700MVA rating, the highest capacity available globally, from Tohoku Electric Power Network Co., Inc.
-
March 2023: Toshiba ESS announced that they have been awarded a STATCOM order from Tohoku Electric Power NW. The installation of the STATCOM is meant to enhance grid stability when transmitting large amounts of power and to guarantee a steady power supply if there is a transmission system failure, in accordance with the increasing use of renewable energy.
| Report Attributes | Details |
|---|---|
| Market Size in 2023 | USD 872.08 Million |
| Market Size by 2032 | USD 1256.84 Million |
| CAGR | CAGR of 4.16% From 2024 to 2032 |
| Base Year | 2023 |
| Forecast Period | 2024-2032 |
| Historical Data | 2020-2022 |
| Report Scope & Coverage | Market Size, Segments Analysis, Competitive Landscape, Regional Analysis, DROC & SWOT Analysis, Forecast Outlook |
| Key Segments | • By Type (Thyristor-based, MCR-based) • By Component (Power electronic device, Harmonic filter, Thyristor, Reactor, Capacitor bank, GIS switchgear, Phase shifting transformer (PST), Surge arrester, Control protection system) • By Vertical (Electric Utility, Renewable, Railway, Industrial, Oil & Gas) |
| Regional Analysis/Coverage | North America (US, Canada, Mexico), Europe (Eastern Europe [Poland, Romania, Hungary, Turkey, Rest of Eastern Europe] Western Europe [Germany, France, UK, Italy, Spain, Netherlands, Switzerland, Austria, Rest of Western Europe]), Asia Pacific (China, India, Japan, South Korea, Vietnam, Singapore, Australia, Rest of Asia Pacific), Middle East & Africa (Middle East [UAE, Egypt, Saudi Arabia, Qatar, Rest of Middle East], Africa [Nigeria, South Africa, Rest of Africa], Latin America (Brazil, Argentina, Colombia, Rest of Latin America) |
| Company Profiles | Siemens, General Electric, Schneider Electric, Mitsubishi Electric, ABB, Eaton, Hitachi, Toshiba, IEM, Wilson Transformer Company, Jiangsu Zhongtian Technology, Hyundai Electric, NKT, Schweitzer Engineering Laboratories, S&C Electric, Sterling and Wilson, SE Energy, Trench Group, Baoding Tianwei Group, Larsen & Toubro |
| Key Drivers | • The growing demand for improved power quality across industrial, commercial, and residential sectors is one of the primary drivers of the Static VAR Compensator (SVC) market. • The modernization and expansion of electrical grids, particularly in developing countries, is another significant driver of the static VAR compensator (SVC) market. |
| RESTRAINTS | • Static VAR Compensators are sophisticated electrical devices that require regular maintenance and skilled personnel for operation. |
Frequently Asked Questions
The Static VAR Compensator Market is expected to grow at a CAGR of 4.16%.
The Static VAR Compensator Market size was USD 872.08 Million in 2023 and is expected to Reach USD 1256.84 Million by 2032.
The growing demand for improved power quality across industrial, commercial, and residential sectors is one of the primary drivers of the Static VAR Compensator (SVC) market.
The Thyristor-based segment dominated the Static VAR Compensator Market in 2023.
APAC dominated the Static VAR Compensator Market in 2023.
Get in Touch
