Emollient Esters Market Analysis & Overview
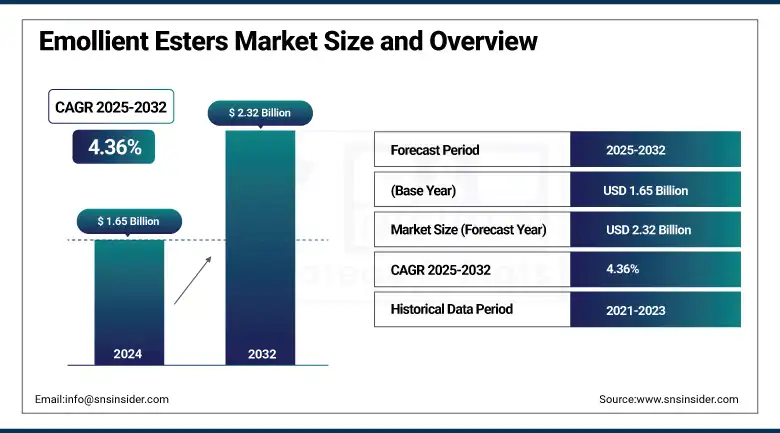
The Emollient Esters Market size was USD 1.65 billion in 2024 and is expected to reach USD 2.32 billion by 2032, growing at a CAGR of 4.36% over the forecast period of 2025-2032.
Emollient Esters Market Analysis highlights that the expanding use of esters in pharmaceutical formulations is significantly contributing to market growth. The growth is driven by their good skin tolerance and non-irritating character, emollient esters are widely used as drug delivery systems, and they have been shown to improve the penetration of many active pharmaceutical ingredients (APIs) in topical formulations. This smoothness and emollience enables the pharmaceutical act of preparation, such a creams and ointments, and gels, to be more effectively marketed as attractive excipient properties for dermatological formulations. The market is anticipated to expand as the pharmaceutical companies are continuously coming up with ideas regarding topicals and transdermals in drug delivery, together with many high-quality, multifunctional excipients, such as the emollient esters, which drive the emollient esters market growth.
To Get more information On Emollient Esters Market - Request Free Sample Report
In April 2022, SOHM, Inc. recently inaugurated its new (GMP)-grade commercial-grade topical drug facility located in Carlsbad, California, boasting a production capacity of 1,892 liters each day. This indicates an increasing adoption of sophisticated ester-derived excipients in high-throughput topical formulations.
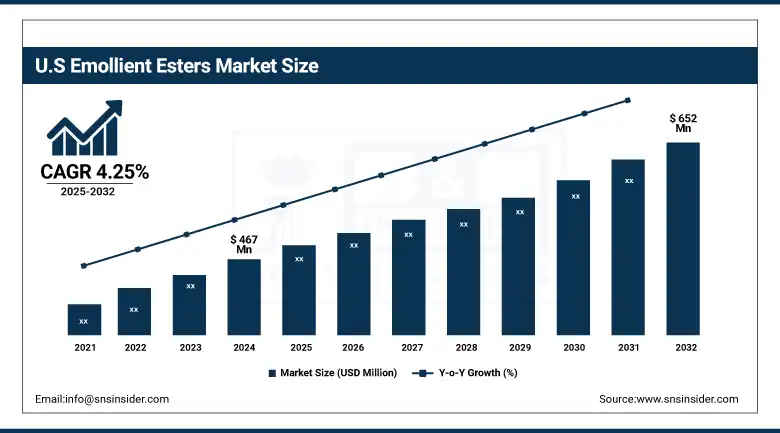
The U.S Emollient Esters market size was USD 467 million in 2024 and is expected to reach USD 652 million by 2032 and grow at a CAGR of 4.25% over the forecast period of 2025-2032 due to the flourishing global personal care and cosmetics industry witnessing significant consumer demand for high-quality skincare, haircare, and grooming products. With its constant innovations, Japan has an established ecosystem of brands and research institutions with facilities boasting new formulations using emollient esters for their moisturizing and feel ingredients.
Emollient Esters Market Dynamics:
Drivers:
-
Increasing Demand for Natural & Skin-friendly Cosmetic Ingredients Drives the Market Growth
Increasing consumer inclination towards sustainable, non-toxic, skin-friendly cosmetic products is one of the notable factors accentuating the demand for emollient esters as a soft emollient ingredient used in personal care formulations, such as lotions, creams, sunscreens, and serums. Such esters possess excellent sensory attributes (smooth, spreadable, and non-greasy) that are necessary for manufacturers to formulate high-performance, sustainable cosmetics.
In October 2023, BASF SE revealed its decision to invest €90 million to increase manufacturing capacity at its emollient ester plant in Dusseldorf, Germany. The expanded production capacity will support the growing global demand for sustainable and bio-based personal care ingredients such as esters including Cetiol C5 and Cetiol Sensoft which are commonly used in cosmetic emulsion systems.
Restraints:
-
High Cost of Bio-based Esters Compared to Synthetic Alternatives May Hamper the Market Growth
The bio-based or naturally derived emollient esters offer numerous advantages over petroleum-based or naturally derived esters, the higher production costs of some bio-based or naturally derived emollient esters can restrict the growth of the product market, particularly in developing countries where price-sensitive markets are prevalent. The pricing is high due to reasons including feedstock availability, extraction complexity, and specialized refining processes that are involved. Although the awareness is growing, small and mid-sized cosmetic brands may be reluctant to make the switch to premium ester-based formulations.
Opportunities:
-
Growth in Male Grooming and Men’s Skincare Segment Creates an Opportunity in the Market
The increasing popularity of skin care and personal care in the men's segment is growing the demand for light, non-oily, and quick-to-absorb formulations that are tailor-made for ester-based emollients. This increasing number of targeted launches in the male product segment for products, such as moisturizers and beard oil, sunscreens, and anti-aging creams is opening additional avenues to deploy specialized ester blends for this dynamic segment. Chefs are creating personalized texturizing using esters, such as isopropyl palmitate and ethylhexyl stearate, which create moisture without a greasy after-feel that drives the emollient esters market trends.
BioEstolide 250‑100 is a novel 100% biobased emollient ester developed by Biosynthetic Technologies for personal care applications. This novel ester provides moisturization, film forming, natural personal care additives, and a luxurious skin feel. Importantly, it represents a sustainable alternative to traditional silicone esters and is also a multifunctional ingredient for hair care formulations.
Emollient Esters Market Segmentation Analysis:
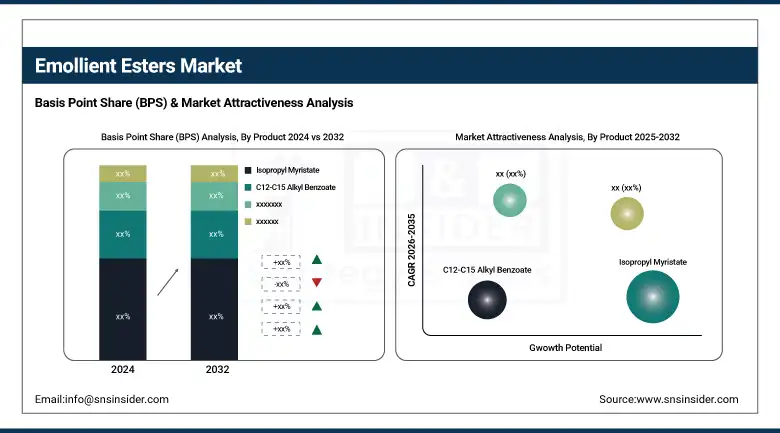
By Product
Isopropyl Myristate held the largest Emollient Esters market share, around 37.23%, in 2024. The segment’s expansion is driven by its extensive application and multi-functionality as a carrier in personal care and pharmaceutical formulations. This type of ester is recognized for its good skin penetration properties, non-oily feel, and enhancing the penetration of biologically active agents, and is a desired ingredient in lotions, creams, ointments, and topical drug delivery systems. Coupled with compatibility with a wide range of cosmetic ingredients, and its cost-effectiveness further raises its demand.
Cetyl Palmitate held a significant Emollient Esters market share due to its proven ability to display natural wax-like properties while exhibiting good skin conditioning and emollient properties. Commonly found in creams, lotions, balms, and hair conditioners, it adds a luxurious creamy texture while helping to stabilize the product. The demand for natural, eco-friendly, and clean-label beauty products among consumers is increasing and therefore, industry participants are preferring Cetyl Palmitate over other alternatives in natural and organic personal care formulations owing to the biodegradability and skin-friendly nature.
By End-User
Skin Care segment held the largest market share, around 42%, in 2024. This leadership position is the result of high usage of emollient esters including isopropyl myristate, cetyl palmitate, and C12–15 alkyl benzoate in moisturizer creams, lotions, anti-aging products, and sunscreens. Particularly valued for their light weight, non-greasy feel, slip and spreading properties, and ability to aid hydration and active ingredient delivery, these esters respond well to the demand for beneficial yet comfortable topical products. However, the rapid growth in the skincare market, influenced by the rising beauty consciousness coupled with the desire for high-quality formulations, is further augmenting the domination of the segment globally, resulting in the widespread consumption of emollient esters in the cosmetics industry.
Cosmetics hold a significant market share in the Emollient Esters market as it is widely used in cosmetics for enhancing the texture, spread ability, and sensory feel of makeup and cosmetic products. Substantiated emollient esters include isopropyl myristate, cetyl palmitate, and C12,15 alkyl benzoate, which are widely incorporated into foundations, lipsticks, eyeshadows, and compacts for a soft, silky feel and lasting wear. These also help in pigment distribution and give the feeling of a luxurious skin finish in a way that meets the consumer's expectation for performance and aesthetics.
Emollient Esters Market Regional Outlook:
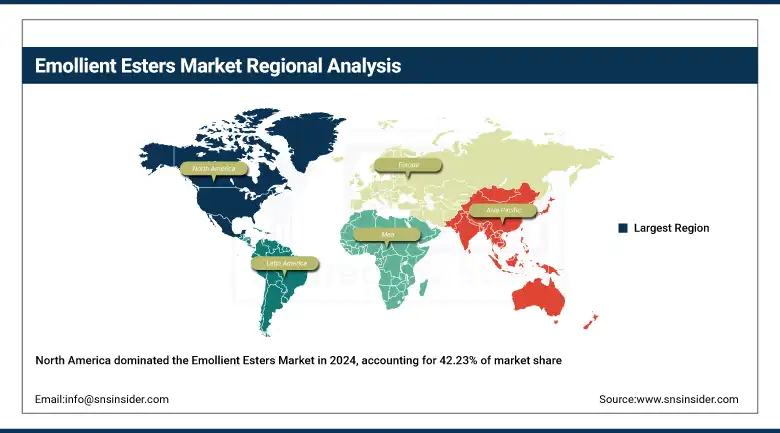
North America held the largest market share, around 42.23%, in 2024. It is due to the strong domestic demand for well-developed cosmetics and personal care industry, well-developed R&D infrastructure, and high U.S. consumer demand for premium skin care products. Several of the major cosmetic manufacturers and ingredient suppliers based in the region work continuously on product innovation and clean-label formulations here, emollient esters are derived from natural and sustainable resources. Moreover, the increasing focus on skin fitness, along with strong purchasing power and proclivity toward efficacious cosmetic products, has established North America as the largest market globally. It further encourages the inclusion of dependable and efficient ingredients such as emollient esters, backed by strong quality and safety standards.
Get Customized Report as per Your Business Requirement - Enquiry Now
In July 2023, Ashland completed its acquisition of Allied Biotech Corp., enhancing its specialty emulsifiers, ester portfolio and increasing its North American footprint.
Asia Pacific Emollient Esters market held a significant market share and is the fastest-growing segment in the forecast period owing to the high growth rate for the personal care and cosmetics sectors in countries including China, India, South Korea, and Japan. The growth of emollient esters can be attributed to the increasing disposable incomes, urbanization, and changing lifestyle patterns, enabling higher spending on skincare and beauty products, which in turn will contribute to the growth of emollient esters in moisturizing, softening, and skin-conditioning formulations. Moreover, the high presence of young population, rising acceptance of grooming products, and heating up of trends have aided the expansion of the market.
Europe held a significant market share in the forecast period owing to its high presence of luxury personal care and cosmetic brands and its mature consumer base which mostly focuses on quality, sustainable, and dermatological safety. Key manufacturers of skincare and cosmetics that prefer natural and eco-friendly ingredients are located in Germany, France, and the U.K., which in turn is positively influencing the demand for bio-based non-comedogenic emollient esters. Rigorous regulatory standards, including REACH, increase the incentive to use high-purity, dermally safe esters in formulation. In addition to this, there is a burgeoning demand for innovative and vegan, cruelty-free, and sensitive-skin products, which is further aiding the growth of the regional market.
Key Players:
The major Emollient Esters companies are Dow Inc., BASF SE, Ashland, Evonik Industries AG, The Lubrizol Corporation, Croda International Plc, Lonza Group Ltd., Stepan Company, Innospec Inc., Phoenix Chemical, Inc., and RITA Corporation.
Recent Developments:
-
In December 2024, Azelis signed an exclusive distribution agreement with AAK to market sustainably sourced, high-stability plant-based emollients already widely used in skin, hair, and cosmetic formulations throughout Asia-Pacific.
-
In June 2023, Oleon launched Radia 7199ACT and Jolee 7749ACT, new skin and hair compatible emollient esters of natural origin, produced enzymatically and claiming synergistic superior sensory attributes, and a more sustainable profile.
| Report Attributes | Details |
|---|---|
| Market Size in 2024 | USD 1.65 Billion |
| Market Size by 2032 | USD 2.32 Billion |
| CAGR | CAGR of 4.36% From 2025 to 2032 |
| Base Year | 2024 |
| Forecast Period | 2025-2032 |
| Historical Data | 2021-2023 |
| Report Scope & Coverage | Market Size, Segments Analysis, Competitive Landscape, Regional Analysis, DROC & SWOT Analysis, Forecast Outlook |
| Key Segments | •By Product (Isopropyl Myristate, C12-C15 Alkyl Benzoate, Caprylic/Capric Triglyceride, Cetyl Palmitate, Myristyl Myristate) •By End User (Skin Care, Hair Care, Cosmetics, Oral Care, Others) |
| Regional Analysis/Coverage | North America (US, Canada, Mexico), Europe (Germany, France, UK, Italy, Spain, Poland, Turkey, Rest of Europe), Asia Pacific (China, India, Japan, South Korea, Singapore, Australia, Rest of Asia Pacific), Middle East & Africa (UAE, Saudi Arabia, Qatar, South Africa, Rest of Middle East & Africa), Latin America (Brazil, Argentina, Rest of Latin America) |
| Company Profiles | Dow Inc., Wacker Chemie, Shin-Etsu Chemical, Momentive Performance Materials, Elkem Silicones, Evonik Industries, Clearco Products Co., ACC Silicones, Siltech Corporation, Iota Silicone Oil. |
Frequently Asked Questions
North America led the Emollient Esters Market in the region with the highest revenue share in 2024.
Increasing demand for natural & skin-friendly cosmetic ingredients drives the market growth.
Skin Care will grow rapidly in the Emollient Esters Market from 2025 to 2032.
The expected CAGR of the global Emollient Esters Market during the forecast period is 4.36%.
The Emollient Esters Market was valued at USD 1.65 billion in 2024.
Get in Touch
