Entertainment Robots Market Size & Trends:
The Entertainment Robots Market size was valued at USD 3.85 billion in 2025 and is expected to reach USD 27.63 billion by 2035 and grow at a CAGR of 21.79% over the forecast period of 2026-2035.
The global market report provides an in-depth entertainment robots market analysis, in which the market is classified on the basis of type, application, material type, end-user and region. That offers insights into the current trends, technological innovations, and competitive strategies contributing to growth. Covering market dynamics, emerging technologies, and business models, the report enables stakeholders react to changing trends, identify new opportunities, and make informed decisions in a rapidly developing and fast maturing market for entertainment robotics.
Entertainment Robots Market Size and Forecast:
-
Market Size in 2025: USD 3.85 Billion
-
Market Size by 2035: USD 27.63 Billion
-
CAGR: 21.79% from 2026 to 2035
-
Base Year: 2025
-
Forecast Period: 2026–2035
-
Historical Data: 2022–2024

To Get more information on Entertainment Robots Market - Request Free Sample Report
Key trends in the Entertainment Robots Market:
-
Rising consumer interest in interactive and AI-powered robotic companions.
-
Increasing adoption of robotics in entertainment venues, theme parks, and gaming centers.
-
Growing integration of advanced sensors, voice recognition, and motion technologies in robots.
-
Expansion of home entertainment robots for education, leisure, and social interaction.
-
Development of autonomous and semi-autonomous robots with enhanced mobility and interactivity.
-
Rising investments by technology companies in robotics R&D and product innovation.
-
Strategic partnerships between robotics manufacturers, content creators, and AI solution providers.
For instance, over 65% of entertainment robot developers release at least one new model or feature update annually.
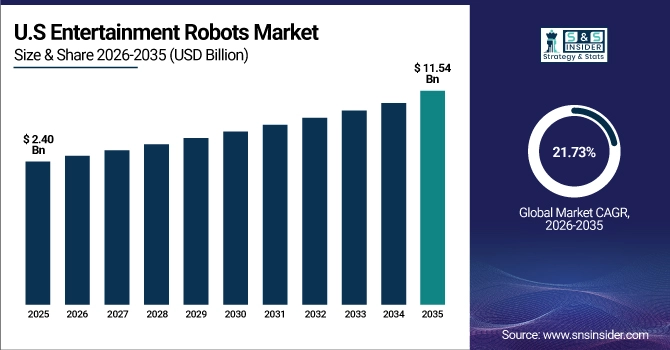
The U.S. Entertainment Robots Market size was USD 2.40 billion in 2025 and is expected to reach USD 11.54 billion by 2035, growing at a CAGR of 21.73% over the forecast period of 2026–2035.
The U.S. market is thriving as smart robotic toys move towards early adoption, increasing investment in AI-enabled learning platforms across schools and colleges, and a strong demand from educational and media sectors. Additional factors contributing to the rapid development of robotics technology sales include the evolution in robotics technology, increased consumer awareness of robots and leading robotics manufacturers. All these factors in turn put the U.S. in an important role in fuelling global progress across the entertainment robots market.
For instance, 61% of U.S. parents are familiar with interactive robotic toys that support learning and social development.
Entertainment Robots Market Drivers:
-
Rising Demand for Educational and Interactive Robots in Classrooms and Homes Globally
Market growth is driven by the increasing need for educational and interactive robots in classrooms and homes globally. These robots are engaging, interactive, and teach STEM, making these products perfect for formal or informal settings. Many schools and parents are already investing in programmable robots that aid at home or at school, in teaching kids coding, logical thinking, and problem solving. With increasing adoption of tech-based tools by educational institutions, the sales of school-based robots to provide official curriculum and gamified learning is rapidly rising, contributing to the overall global entertainment robots market growth.
For instance, 58% of AI-powered robots used in education came preloaded with modules aligned to national or state-specific curricula.
Entertainment Robots Market Restraints:
-
High Costs of Development, Customization, and Maintenance of Entertainment Robots
Entertainment robots suffer from major constraints in mass adoption due to high costs of development, customization, and longevity of robot maintenance. They incorporate advanced hardware including high-resolution cameras, AI chips, complex sensors and moving parts, which skyrockets the cost of production and retail price. Such costs are unmanageable by many educational institutions and low-to-mid income consumers. It also incurs recurring costs as for the maintenance and upgrades you will need the technical know-how. Due to these cost considerations, small businesses and schools in emerging economies are dissuaded from mass adoption of entertainment robots, limiting growth potential in price-sensitive markets.
Entertainment Robots Market Opportunities:
-
Integration of Entertainment Robots in Therapy, Elderly Care, and Emotional Wellness Applications
Growth Opportunities – Potential for the integration of entertainment robots for use in therapy, elder care, and emotional wellness applications. Growing concern about mental health and aging societies have made it possible for the use of companion robots in healthcare settings for alleviating loneliness, anxiety, and stress. This includes interactive robots that provide medication reminders and emotional support, which are mainly found in assisted living centers. Being non-traditional is the approach here but the primary feature that creates the difference lies in their ability to converse with users, engage and recognize facial expressions, and provide feedback based on your custom inputs in a personalized manner making them a potent tool to be used in non-traditional care. Manufacturers now have profitable new options beyond traditional toy and learning categories.
For instance, interactive robots used in therapy for children with ASD improved social response and engagement by 30%.
Entertainment Robots Market Challenges:
-
Ensuring Data Privacy and Child Safety in AI-Powered Entertainment Robots
Data protection and the safety of children when using entertainment robots based on artificial intelligence is another contentious issue. To customize interactions with the user, these bots sometimes capture voice, facial expressions, and/or behaviors, which creates additional attack threats in terms of information processing. The upsurge in surveillance, unauthorized access to data and malady of personal information understandably makes parents, educators and regulators uneasy. And this means abiding by child protection laws such as COPPA and GDPR. A single security breach could result in reputational and legal consequences, forcing companies to spend a great deal of money to create solid, privacy-first system architectures.
Entertainment Robots Market Segmentation Analysis:
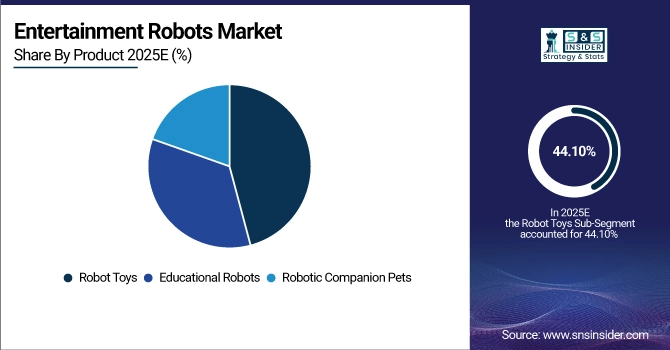
By Product, Robot Toys Segment Dominates with 44.10% Share in 2025, Educational Robots Segment to Record Fastest Growth with 22.55% CAGR
Robot Toys held a dominant share of 44.10% in the Entertainment Robots Market in 2025. The segment’s growth is driven by a broad customer base including children and young adults, with products featuring interactive capabilities such as voice recognition, facial expression detection, and learning functionalities. Early innovation was led by companies like WowWee Group Limited, with popular products such as robot pets and interactive toys. Seasonal demand, especially during holidays and festivities, continues to sustain the market for robotic toys globally.
The Educational Robots segment is expected to experience the fastest growth in the market from 2026 to 2035, with a CAGR of 22.55%. Increasing adoption of interactive digital learning tools and STEM-focused curricula is driving demand. Companies like Makeblock Co., Ltd. are promoting AI coding robots and DIY learning kits for personalized learning. Educational robots are being widely integrated into schools and households to enhance interactive learning, making this segment the fastest-growing in the market.
By Application, Water and Wastewater Treatment Segment Dominates with 27.80% Share in 2025, Food and Beverage Processing Segment to Record Fastest Growth with 23.55% CAGR
The Water and Wastewater Treatment segment held a 27.80% share of the market in 2025. Although niche, the segment includes installations at water-themed attractions and fountains, where robotic systems combine synchronized movement, lighting, and music. Companies such as Fountain People, Inc. are driving these high-engagement setups, which generate significant revenues in public entertainment venues.
The Food and Beverage Processing segment is projected to witness the fastest growth from 2026 to 2035, with a CAGR of 23.55%. Increasing adoption of humanoid robots in interactive restaurants and cafes is enhancing customer experiences. Companies like Keenon Robotics Co., Ltd. have pioneered robotic waitstaff solutions, particularly in the Asia region. As experiential dining gains popularity globally, demand for robots in this segment is expected to rise sharply.
By Material Type, Stainless Steel Segment Dominates with 31.80% Share in 2025, Composite Materials Segment to Record Fastest Growth with 24.19% CAGR
Stainless Steel accounted for the highest revenue share of 31.80% in 2025 due to its durability, corrosion resistance, and aesthetic appeal for robots interacting with the public. Leading companies like Boston Dynamics utilize stainless steel for structural and safety-critical components in humanoid and interactive robots used in exhibitions and live performances.
The Composite Materials segment is anticipated to experience the fastest growth during 2026–2035, with a CAGR of 24.19%. Lightweight and high-stiffness properties make composites ideal for robots requiring agility, mobility, and energy efficiency. Companies like UBTECH Robotics Corp. are leveraging composite materials for humanoid robots to enhance responsiveness and battery life. Rising demand for flexible and efficient robot designs continues to fuel innovation in this segment.
By End-User, Education Sector Dominates with 38.20% Share in 2025, Expected to Record Fastest Growth with 22.58% CAGR
The education sector accounted for the largest share of 38.20% in 2025, driven by widespread use of robots for interactive, hands-on, and STEM-based learning. Educational robots support cognitive development and adaptive teaching, with companies like LEGO Education providing coding and robotics kits used in schools worldwide. Government initiatives and increasing adoption of digital learning tools are expected to sustain the dominance of this end-user segment, with a CAGR of 22.58% projected through 2035.
Entertainment Robots Market Regional Insights:
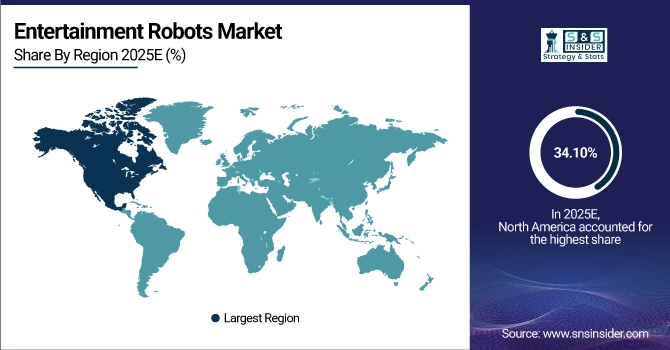
North America Dominates Entertainment Robots Market in 2025
In 2025, North America accounted for the highest market revenue with a 34.10% share, driven by early adoption of robotic technologies, presence of leading robotics manufacturers, and high consumer spending on smart devices. The U.S. is a major contributor, fueled by strong investments in AI and robotics, government support for educational technology, and widespread automation in media and entertainment. These factors position North America as the dominant region in the global entertainment robots market.
The United States leads within the region due to its advanced R&D infrastructure, high adoption of robotic toys and educational robots, and key players including Boston Dynamics and WowWee. These companies foster innovation across educational and commercial entertainment applications, reinforcing North America’s leadership in the sector.
Get Customized Report as per Your Business Requirement - Enquiry Now
Asia Pacific Expected to Grow at Fastest Rate with 22.86% CAGR (2026–2035)
Asia Pacific is projected to witness the fastest growth in the entertainment robots’ market from 2026 to 2035, at a CAGR of 22.86%. Rapid urbanization, increasing disposable incomes, and government programs promoting AI-integrated education are driving demand across the region. Countries such as Japan, South Korea, and China are not only major consumers but also leading producers of entertainment robots.
China dominates the regional market due to strong government support for robotics, extensive manufacturing capabilities, and widespread integration of AI in consumer products. Companies like UBTECH Robotics and Makeblock drive growth by offering affordable and innovative entertainment robots for educational and domestic use.
Europe Emerging as a Key Market
Europe is becoming a significant player in the entertainment robots industry, supported by growing investments in educational technology, emphasis on STEM learning, and the presence of innovative robotics startups. Countries including Germany, France, and the UK are adopting AI-powered entertainment robots across schools, museums, and retail environments.
Germany leads Europe’s market due to its advanced robotics industry, strong R&D investments, and early adoption in educational and commercial sectors. Supportive regulatory frameworks and ongoing digitalization efforts further strengthen Europe’s market potential.
Middle East & Africa and Latin America Market Insights
The UAE dominates the Middle East & Africa market, driven by advanced digital infrastructure, AI investments, and smart city initiatives. In Latin America, Brazil leads the market due to a strong consumer base, expanding technology ecosystem, and rising adoption of robots in education and media applications. Both regions are emerging markets for entertainment robots, supported by increasing government initiatives and growing awareness of robotics in education and commercial entertainment.
Entertainment Robots Market Companies are:
-
Sony Corporation
-
Hasbro Inc.
-
LEGO Group
-
Mattel Inc.
-
Sphero Inc.
-
Blue Frog Robotics
-
WowWee Group Limited
-
SoftBank Robotics Group Corp.
-
UBTECH Robotics Corp.
-
Robotis Co., Ltd.
-
Modular Robotics Inc.
-
Robobuilder Co., Ltd.
-
Hanson Robotics Ltd.
-
Spin Master Corp.
-
iRobot Corporation
-
Tomy Company Ltd.
-
Parrot SA
-
Fischertechnik GmbH
-
KUKA AG
-
VTech Holdings Limited
Competitive Landscape of Entertainment Robots Market:
Sony Corporation
Sony Corporation is a Japan-based global leader in consumer electronics and robotics, offering entertainment robots including interactive pets, humanoid robots, and AI-powered companions. The company focuses on advanced sensor integration, AI-driven interactivity, and immersive user experiences. Its role in the Entertainment Robots Market is significant, providing innovative products that combine technology with play and learning for both children and adults.
-
In 2025, Sony launched the next-generation Aibo robotic dog with enhanced AI learning, voice recognition, and emotional interaction capabilities.
Hasbro Inc.
Hasbro Inc. is a U.S.-based multinational toy and entertainment company, developing interactive robotic toys and educational robots under brands such as FurReal and Transformers. The company emphasizes engaging experiences, AI-enabled interaction, and STEM learning tools for young users. Its role in the Entertainment Robots Market is vital, driving mass adoption of robotic toys across global markets.
-
In 2025, Hasbro introduced advanced AI-enabled FurReal robotic pets with improved motion, voice interaction, and learning capabilities.
LEGO Group
LEGO Group is a Denmark-based global leader in educational toys and robotics, providing programmable and AI-enabled educational robots under LEGO Education and LEGO Mindstorms lines. The company focuses on STEM learning, hands-on coding, and interactive play for children and schools worldwide. Its role in the Entertainment Robots Market is critical, combining education with robotics to enhance cognitive and problem-solving skills.
-
In 2025, LEGO Group expanded its LEGO Education SPIKE Prime line with new AI-powered coding robots designed for collaborative learning environments.
Mattel Inc.
Mattel Inc. is a U.S.-based multinational toy manufacturer offering interactive and AI-powered robotic toys under brands like Barbie and Hot Wheels. The company emphasizes immersive play experiences, voice interaction, and learning capabilities for children. Its role in the Entertainment Robots Market is significant, contributing to the growth of interactive and intelligent toy robots globally.
-
In 2025, Mattel launched a new line of AI-enabled Barbie robotic companions with enhanced voice recognition and interactive play features.
| Report Attributes | Details |
|---|---|
| Market Size in 2025 | USD 3.85 Billion |
| Market Size by 2035 | USD 27.63 Billion |
| CAGR | CAGR of 21.79% From 2026 to 2035 |
| Base Year | 2025 |
| Forecast Period | 2026-2035 |
| Historical Data | 2022-2024 |
| Report Scope & Coverage | Market Size, Segments Analysis, Competitive Landscape, Regional Analysis, DROC & SWOT Analysis, Forecast Outlook |
| Key Segments | • By Product (Robot Toys, Educational Robots and Robotic Companion Pets) • By Application (Water & Wastewater Treatment, Pulp & Paper Industry, Oil & Gas Industry, Power Generation and Food & Beverage Processing) • By Material Type (Stainless Steel, Ductile Iron, Carbon Steel, Plastic/Polymer and Composite Materials) • By End-User (Media, Education, Retail and Others) |
| Regional Analysis/Coverage | North America (US, Canada, Mexico), Europe (Germany, France, UK, Italy, Spain, Poland, Turkey, Rest of Europe), Asia Pacific (China, India, Japan, South Korea, Singapore, Australia,Taiwan, Rest of Asia Pacific), Middle East & Africa (UAE, Saudi Arabia, Qatar, South Africa, Rest of Middle East & Africa), Latin America (Brazil, Argentina, Rest of Latin America) |
| Company Profiles | Sony Corporation, Hasbro, Inc., Ubtech Robotics Corp., SoftBank Robotics, Honda Motor Co., Ltd., WOWWEE Group Limited, Lego Group, Sphero, Inc., Blue Frog Robotics, Anki , Robotis Co., Ltd., Furhat Robotics, Miko (Emotix), Reach Robotics, Modular Robotics, Digital Dream Labs, ROOBO, Pal Robotics, AIBrain, Inc. and HANSON Robotics. |
Get in Touch
