Opacifier Market Report Scope & Overview:
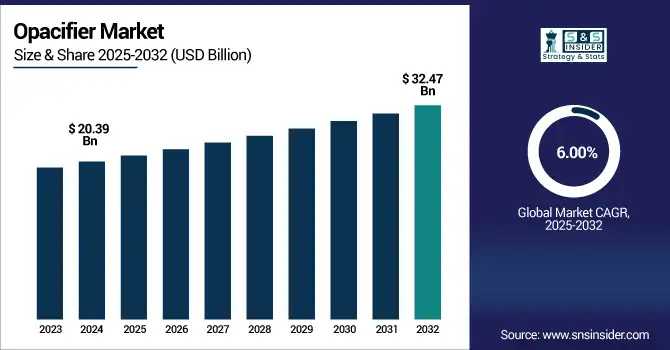
The Opacifier Market size was valued at USD 20.39 billion in 2024 and is expected to reach USD 32.47 billion by 2032, growing at a CAGR of 6.00% over the forecast period of 2025-2032.
To Get more information on Opacifier-Market - Request Free Sample Report
Strong growth is being observed in the opacifier market from architectural coatings and ceramics. The main player in the opacifier market is titanium dioxide, which continues to play a significant role in supporting the development of this market in paints, plastics, and ceramics. The ceramic opacifier market is progressing with developments in the glazing technology and eco-friendly materials. Sustainability and multi-functionality performance are important opacifier market trends, driving product development.
As a result of the restructuring that occurred in the industry, Chemours shut down its TiO₂ facilities at Altamira in May 2024 because of a lack of water and recommenced production by June 24, 2024.
According to the U.S. Geological Survey, the production of TiO₂ pigment in the U.S. totalled 920 thousand tons in 2023, and 95% of titanium mineral concentrates used to produce pigment were consumed by pigment producers. Well-established opacifier companies are undertaking strategic investments to develop a bright opacifier industry landscape. Sustained innovation and local demand trends will be important for the opacifier market size and the opacifier market growth.
Opacifier Market Drivers:
-
Rising green building regulations fuel demand for sustainable Opacifier in architectural coatings
Increased demand for low-VOC sustainable Opacifier is spurred by stricter digital building codes such as Green Mark. LEED certification in the U.S. jumped by 19% in 2023 (USGBC). A titanium dioxide(di)-based opacifier, which is known to be highly efficient and environmentally friendly at the same time, is being used primarily in architectural coatings. The U.S. EPA projected a 12% reduction in VOC emissions from 2020 through 2023. Opacifier suppliers like Chemours and Arkema are developing eco-friendly formulations. They are in line with opacifier market trends and thus are contributing to the opacifier market growth and the opacifier industry share in sustainable infrastructure.
-
Surging electric vehicle production increases the need for lightweight Opacifier in composite plastics
Electric vehicle (EV) production increased by 48% worldwide last year (IEA) and the strong demand of lightweight polymer composites. The Titanium dioxide based Opacifier add UV protection with no added weight, and visual cosistancy. U.S. Department of Energy reports that composites filled with TxOx can lighten parts by as much as 20 percent. With auto OEMs investing in more than $330B of EV production by 2025, opacifier companies are scaling up capacity. The trend affecting the Opacifier market size the most appears to be on Opacifier market growth in transportation applications.
Opacifier Market Restraints:
-
High energy consumption in opacifier production elevates operational costs and carbon footprint
Manufacturing of opacifier, with titanium dioxide production in particular, uses very large amounts of energy. The U.S. Department of Energy says production uses up to 2,500 kWh per ton. Operations are further strained by 15% higher electricity rates in Europe in 2023. Those costs are shrinking margins, and this is why renewable energy is becoming a necessity. However, upgrading infrastructure is even more costly, complex, and prohibitive for smaller and midsize opacifiers. High energy consumption further impedes the growth of the Opacifier market by affecting the intervention of the Opacifier industry.
Opacifier Market Segmentation Analysis:
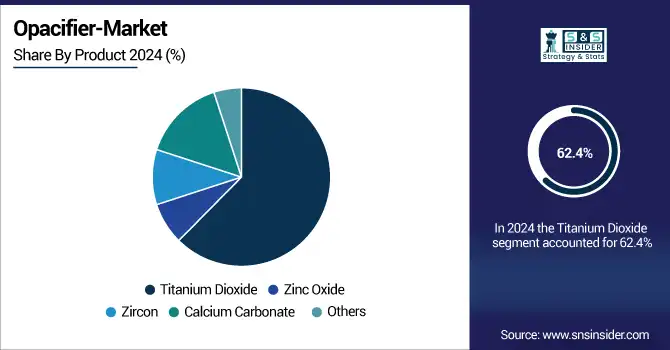
By Product
Titanium dioxide dominated the Opacifier market in 2024, holding a market share of approximately 62.4%, due to its higher opacity, cost effectiveness, and non-toxic characteristic. It was used in everything from architectural coatings to plastics, and its demand boomed with the growth in green building projects. The U.S. Environmental Protection Agency found that paints containing titanium dioxide led to a 12% decrease of VOCs from 2020–2023. Major manufacturers of opacifiers such as Chemours and Tronox are heavily focusing on increasing the production of titanium dioxide across the world.
Titanium dioxide also emerged as the fastest-growing product in 2024, achieving a CAGR of around 6.5%, driven by the development of nano-TiO₂ for energy-saving coatings as well as long-life plastics. Oak Ridge National Laboratory studies found that ceramic glazes with nano-engineered TiO₂ enhanced opacity and energy efficiency by at least 10%. As sustainability and regulators continue to be in the cross-hairs of industries throughout the world, opacifier firms are focusing on new technologies in titanium dioxide to meet ever-changing consumer and industrial expectations in paint, plastic, and ceramics.
By Application
In 2024, paints & coatings dominated the Opacifier market, capturing a market share of nearly 42.7%. This expansion was the result of higher consumption of titanium dioxide in decorative coatings, interior coatings, and exterior coatings for its white and opacity. Green Buildings LEED-certified buildings increased 19% in 2023 (U.S. Green Building Council), driving demand for sustainable Opacifier. Opacifier manufacturers such as Dow and Arkema are working to develop low-VOC coatings packages to meet evolving green building regulations around the world.
Ceramic applications represented the fastest-growing use case in 2024, with a CAGR of around 6.5%, driven by growing consumption in porcelain tiles and sanitary ware. Using nano-zircon Opacifier in tile glazes resulted in 15% more opacity, with 10% energy sonsumption saving by Oak Ridge National Laboratory. The Ceramic Tile Distributors Association out of 2023 saw a 5.8% increase in U.S. tile shipments. ceramic Opacifier are hot market trend on construction and interior decor materials which are becoming more commonly used due to their durable and energy-efficient features,.
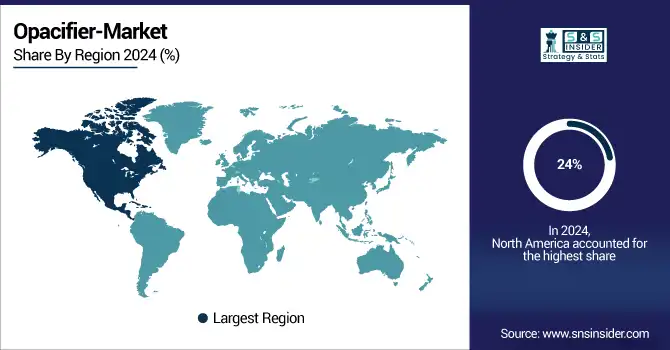
Opacifier Market Regional Outlook:
North America holds a significant share of around 24% of the Opacifier market, due to robust demand in architectural coatings, specialty plastics, and automotive markets. Government initiatives supporting green building construction and stringent EPA regulations towards VOC emissions are driving the Opacifier market trends. The new low-VOC, high-opacity titanium dioxide developments being made by opacifier manufacturers are following these trends. Continuing urban infrastructure development and industrial expansion will also support the Opacifier industry landscape, with North America emerging as the second-largest regional participant.
The U.S. dominated the North American Opacifier market, accounting for approximately 78% of the regional volume with a market size of USD 3.84 billion in 2024 and will reach a market size of USD 6.02 billion in 2032 with a CAGR of 5.79% during the forecast period of 2025 to 2032. The country made over 920,000 tons of titanium dioxide pigment in 2023, solidifying its manufacturing power, according to the U.S. Geological Survey. Increased infrastructure spending by the U.S. government and green building have driven demand for architectural coatings made with high-performance Opacifier. Major players, including Tronox and Chemours, which is establishing more production capacities to satisfy this demand, have lucrative Opacifier market shares and outlook in the country.
Asia-Pacific dominated the Opacifier market with a market share of 36.4% and shows the fastest growth with the highest CAGR of 6.29% during the forecast period of 2025 to 2032. The growth is supported by rapid urbanization, industrialization, and government infrastructure spending. Policies promoting sustainable construction and energy-efficient buildings are boosting the Opacifier market growth. Local opacifier companies are scaling production to meet surging demand in the architectural coatings, ceramics, and plastics sectors. The region’s ceramic Opacifier market is also expanding rapidly as demand for durable, aesthetically pleasing materials increases.
China is the dominant country in the Asia-Pacific Opacifier market, driven by an increase in real estate investment in 2023 by the National Bureau of Statistics of China. Government initiatives targeting energy-efficient construction and urban infrastructure expansion are significantly fueling the demand for high-opacity Opacifier, particularly titanium dioxide. Leading Chinese opacifier companies have increased capacity and adopted advanced manufacturing technologies to align with the opacifier industry outlook and market trends, ensuring China’s top regional market share.
Get Customized Report as per Your Business Requirement - Enquiry Now
Opacifier Market Companies are:
The major Opacifier market competitors include Tronox Holdings plc, The Chemours Company, Venator Materials PLC, KRONOS Worldwide, Inc., Lomon Billions, Tayca Corporation, Ishihara Sangyo Kaisha Ltd., Arkema S.A., Dow Inc., and Precheza a.s. (AGROFERT a.s.).
Recent Developments:
-
In September 2024, VTT and partners launched the CELLIGHT project to develop cellulose-based Opacifier as sustainable alternatives to titanium dioxide, aiming to reduce environmental impact in paints, coatings, and cosmetics by 2035.
| Report Attributes | Details |
|---|---|
| Market Size in 2024 | USD 20.39 billion |
| Market Size by 2032 | USD 32.47 billion |
| CAGR | CAGR of 6.00% From 2025 to 2032 |
| Base Year | 2024 |
| Forecast Period | 2025-2032 |
| Historical Data | 2021-2023 |
| Report Scope & Coverage | Market Size, Segments Analysis, Competitive Landscape, Regional Analysis, DROC & SWOT Analysis, Forecast Outlook |
| Key Segments | •By Product (Titanium Dioxide, Zinc Oxide, Zircon, Calcium Carbonate, Others) •By Application (Paints & Coatings, Plastics, Ceramic, Cosmetics, Paper, Others) |
| Regional Analysis/Coverage | North America (US, Canada, Mexico), Europe (Germany, France, UK, Italy, Spain, Poland, Turkey, Rest of Europe), Asia Pacific (China, India, Japan, South Korea, Singapore, Australia, Rest of Asia Pacific), Middle East & Africa (UAE, Saudi Arabia, Qatar, South Africa, Rest of Middle East & Africa), Latin America (Brazil, Argentina, Rest of Latin America) |
| Company Profiles | Tronox Holdings plc, The Chemours Company, Venator Materials PLC, KRONOS Worldwide, Inc., Lomon Billions, Tayca Corporation, Ishihara Sangyo Kaisha Ltd., Arkema S.A., Dow Inc., and Precheza a.s. (AGROFERT a.s.) |
Frequently Asked Questions
The Opacifier Market was valued at USD 20.39 billion in 2024, showing strong growth in coatings and ceramics.
Titanium dioxide led the Opacifier Market in 2024 due to superior opacity, cost efficiency, and eco-friendly performance.
Paints & coatings dominate the Opacifier Market in 2024, primarily driven by growth in sustainable architectural coatings.
Chemours paused Altamira TiO? operations in May 2024 due to water shortages, impacting the Opacifier Market briefly.
Asia-Pacific leads the Opacifier Market with a 36.4% share in 2024, driven by urbanization and green infrastructure.
Get in touch
