Computer Aided Manufacturing Market Report Scope & Overview:
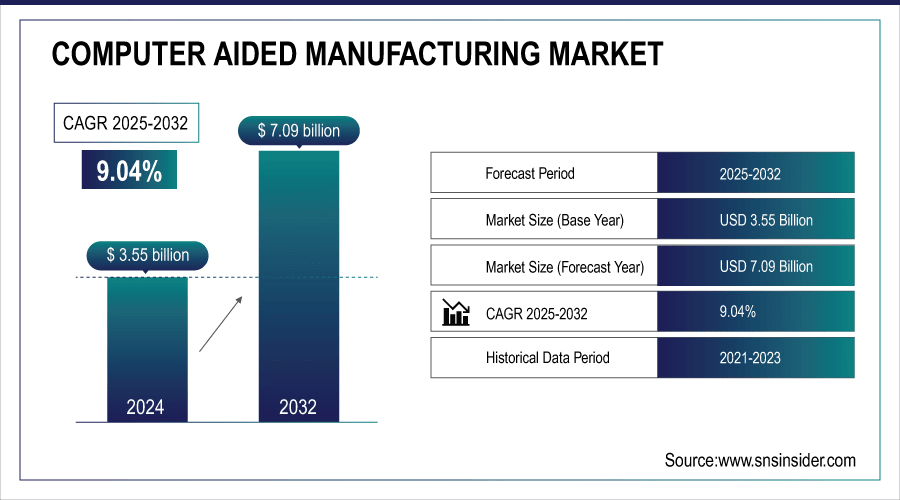
The Computer Aided Manufacturing Market size was valued at USD 3.55 Billion in 2024 and is projected to reach USD 7.09 Billion by 2032, growing at a CAGR of 9.04% during 2025-2032.
The Computer Aided Manufacturing (CAM) market is expanding rapidly with the adoption of AI-powered tools that enhance productivity and simplify workflows. Such solutions help save programming time, offer intelligent 24/7 assistance, and make better data-driven decisions in real time. While manufacturing processes such as die and mold, advanced machining, and sheet metal fabrication are being further streamlined through AI integration, connecting data is only the first layer of weapons manufacturing-automation. Cloud-based CAM software that optimize component manufacturing, eliminate repetitive tasks and shorten the path to onboarding was a drivers for digital transformation in manufacturing helping support smarter, more efficient, and cost-effective operations around the world to grow while increasing cloud adoption.
on Feb 2025, Sandvik launched its AI-powered Manufacturing Copilot integrated into Cimatron®, GibbsCAM™, and SigmaNEST® CAM software to simplify workflows and boost productivity. Developed with Microsoft Azure, it provides 24/7 intelligent assistance, real-time updates, and reduces learning curves, repetitive tasks, and programming time for users.
Key Computer Aided Manufacturing Market Trends
-
Integration of intelligent simulation and virtual testing is accelerating CAM adoption by optimizing materials, enhancing safety, and streamlining production processes
-
Rising investment in digital twin technology, automation, and predictive modeling is improving precision, reducing costs, and speeding up product development
-
Demand for advanced 3D modeling, parametric CAD generation, and seamless CAD CAM integration is driving significant market expansion
-
Technology consolidation through strategic partnerships and acquisitions such as ESI Group with FAW Volkswagen and Hexagon acquiring Geomagic software is fostering innovation and expanding CAM capabilities
-
Enhanced metrology solutions with automated quality inspection tools are increasingly integrated to improve manufacturing accuracy and compliance
-
Automotive, aerospace, and industrial sectors continue to lead the adoption of CAM solutions to achieve faster time to market, improved efficiency, and reduced errors
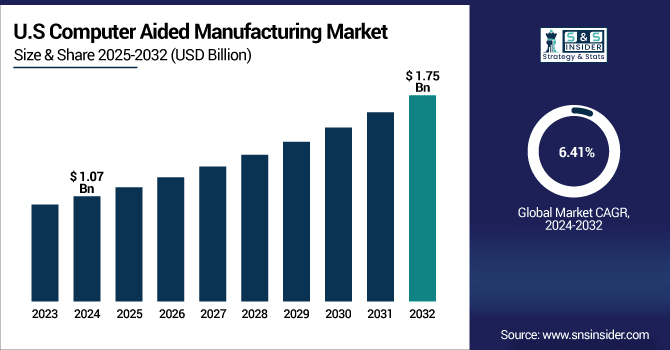
The U.S Computer Aided Manufacturing market size was valued at USD 1.07 Billion in 2024 and is projected to reach USD 1.75 Billion by 2032, growing at a CAGR of 6.41% during 2025-2032. The increasing adoption of cloud-based platforms, simulation-driven design, automation, digital transformation, upskilling the workforce, and the need for precision engineering across aerospace, automotive, energy & industrial sectors are the factors driving the computer-aided manufacturing market growth.
A key trend in the CAM market is the integration of AI-powered tools and cloud-based platforms, enabling real-time data analysis, simulation-driven design, and predictive maintenance. Manufacturers are increasingly adopting automation, additive manufacturing, and multi-axis machining to enhance precision and reduce production time. This trend toward AI-enabled, data-driven workflows powered by AI technology, is assuring greater efficiency, less material wastage, and encouraging digital transformation in aerospace, automotive, and industrial automation sectors.
Computer Aided Manufacturing Market Growth Drivers:
-
Integration of Intelligent Simulation Accelerates Adoption of Computer Aided Manufacturing
The increasing focus on intelligent simulation and virtual testing is driving the adoption of Computer Aided Manufacturing (CAM) solutions. High-level simulation technologies assist manufacturers with complying to high safety and quality standards while optimizing materials and production efficiency. Creation of material databases and digital twins in the local context and based on AI (artificial intelligence) provides seamless workflows, minimizes errors and increases the speed of product development. Growing use of automation, predictive modeling and simulation based designing is also driving the uptake of CAM as it delivers a greater level of accuracy, cost savings and innovation across automotive, aerospace, and industrial manufacturing.
On April 2nd, 2024, ESI Group and FAW-Volkswagen TE entered into a strategic partnership to promote research in intelligent simulation technology and automotive materials. The partnership, which includes a joint laboratory, will advance safety, efficiency and innovation for the industry, and builds on their long-standing partnership to provide solutions in virtual simulation and industry standard development.
Computer Aided Manufacturing Market Restraints:
-
High Implementation Costs Limit Widespread Adoption of CAM Technologies
The widespread adoption of Computer Aided Manufacturing (CAM) solutions is restrained by the high initial investment and implementation costs associated with advanced software, AI integration, and cloud-based platforms. Small and medium-sized manufacturers often face budget constraints, limiting their ability to deploy comprehensive CAM systems. Additionally, the complexity of software and the need for skilled personnel increase training requirements and operational challenges. Legacy systems and fragmented IT infrastructure further hinder seamless integration, reducing efficiency gains. These factors collectively slow the adoption of CAM technologies, delay digital transformation, and limit productivity improvements, constraining market growth despite rising demand for automation, precision engineering, and simulation-driven manufacturing across industries.
Computer Aided Manufacturing Market Opportunities:
-
Adoption of Advanced 3D Modeling and CAD Integration Drives CAM Market Expansion
The CAM and metrology market is witnessing significant growth due to increasing demand for automated 3D modeling, parametric CAD generation, free-form design, and quality inspection solutions. These technologies are being adopted by manufacturers to smooth workflows, improve accuracy and shorten the time needed to develop products. The growing attractiveness of digital twin technologies, high precision metrology and continuous CAD-CAM coupling is opening the window for the full stack end-to-end manufacturing software players. The transformative power of technology consolidation and integration allows organizations to meet changing demands in automotive, aerospace, and industrial manufacturing sectors to improve efficiencies and drive innovation.
On December 11, 2024, Hexagon acquired 3D Systems’ Geomagic software portfolio forUSD 123 million to enhance its CAM and metrology solutions, enabling automated 3D modeling, CAD integration, and quality inspection across manufacturing applications.
Computer Aided Manufacturing Market Segment Highlights:
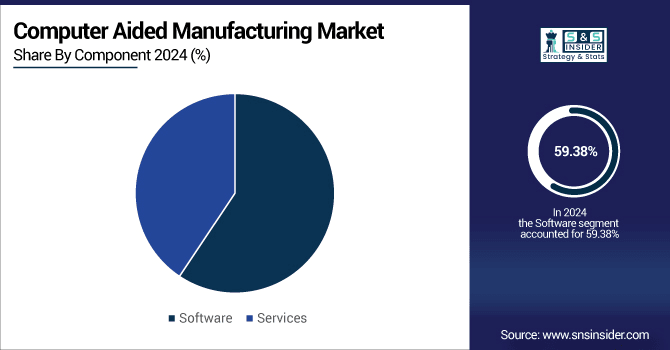
- By Component: Software dominates at 59.38% in 2024 Services grow fastest at 10.24% in 2024
- By Deployment: On-premise dominates at 68.13% in 2024 Cloud grows fastest at 13.15%in 2024.
- By Manufacturing Process: Milling dominates at 48.75% in 2024 Additive Manufacturing grows fastest at 20.56%in 2024.
- By End Use: Automotive dominates at 35.63% in 2024 Medical Devices & Components grow fastest at 10.90% in 2024.
Computer Aided Manufacturing Market Segment Analysis:
- By Component, Software Leads Market While Services Fastest Growth
Software dominates the CAM market, serving as the core for design, simulation, and workflow management, while services are growing the fastest. The rising adoption of AI, cloud-based solutions, and advanced support offerings is driving increased demand for services, helping manufacturers improve efficiency, productivity, and seamless implementation across industries, complementing the foundational role of software in modern manufacturing processes.
- By Deployment, On-premise Dominate While Cloud Shows Rapid Growth
On-premise deployment remains the preferred choice for industries requiring enhanced data security and complete control over their CAM systems. However, cloud deployment is experiencing rapid growth due to its scalability, cost-effectiveness, and ease of remote access. The shift toward cloud solutions is driven by increasing digital transformation initiatives and the demand for flexible, collaborative, and real-time manufacturing environments.
- By Manufacturing Process, Milling Lead While Additive Manufacturing Registers Fastest Growth
Milling continues to lead as the primary manufacturing process due to its precision, reliability, and widespread use in industries like automotive, aerospace, and industrial equipment. Meanwhile, additive manufacturing is registering the fastest growth, driven by its ability to enable complex geometries, reduce material waste, and accelerate prototyping, making it increasingly attractive for customized and on-demand production applications.
- By End Use, Automotive Lead While Medical Devices & Components Grow Fastest
The automotive sector leads end-use adoption, driven by demand for precision manufacturing, automation, and integration of advanced technologies to enhance production efficiency. Meanwhile, medical devices and components are experiencing the fastest growth as manufacturers increasingly adopt advanced solutions to meet stringent regulatory standards, improve product accuracy, and enable rapid development of customized medical tools and implants.
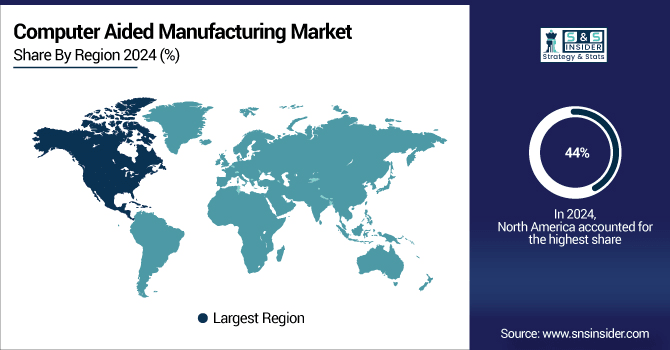
North America Computer Aided Manufacturing Market Insights
In 2024 North America dominated the Computer Aided Manufacturing Market and accounted for 44% of revenue share, owing to solid technological infrastructure, fast adoption of automation and a well-established presence of major manufacturing industries. Factors such as the growing penetration of AI-based CAM solutions, strong investment in smart manufacturing, and an existing aerospace and automotive sector in the region which increases demands for precision engineering, and sophisticated production processes will have a positive impact on the growth of the market in this region.
Asia-Pacific Computer Aided Manufacturing Market Insights
Asia-Pacific is expected to witness the fastest growth in the Computer Aided Manufacturing Market over 2025-2032, with a projected CAGR of 10.74%, driven by rapid industrialization, increasing adoption of advanced manufacturing technologies, and rising investments in smart factories. Growth in automotive, electronics and medical device production, along with the various government initiatives aimed at promoting Industry 4.0, is driving the region towards automation and precision-oriented manufacturing solutions.
Europe Computer Aided Manufacturing Market Insights
In 2024, Europe emerged as a promising region in the Computer Aided Manufacturing Market, supported by strong advancements in automotive, aerospace, and industrial automation sectors. It is characterized by high investment in digital manufacturing technologies, a sound regulatory framework, and increasing focus on precision engineering, sustainability and smart factory initiatives, driving steady adoption of advanced CAM solutions across various industries.
Latin America (LATAM) and Middle East & Africa (MEA) Computer Aided Manufacturing Market Insights
In LATAM and MEA region, Computer Aided Manufacturing Market displays a moderate growth with the increase in automation within factories, growth in smart manufacturing are contributing as well as growing investments in automotive and energy sectors. Further expanding the market potentials of the emerging economies are the supportive government initiatives and slow progressive digital transformation attempts.
Competitive Landscape for Computer Aided Manufacturing Market:
Synopsys is a leading provider of electronic design automation (EDA) software and solutions that support Computer Aided Manufacturing (CAM) by enabling seamless integration of chip design with system-level manufacturing processes. Its technologies help improve design precision, optimize production efficiency, and accelerate innovation across industries including semiconductors, automotive, aerospace, and consumer electronics.
-
In July 2025, Synopsys has completed its $35 billion acquisition of Ansys, strengthening its position as a silicon-to-systems design leader. This merger integrates Ansys’s advanced simulation capabilities with Synopsys’s EDA expertise, enabling a unified design environment for industries including semiconductors, automotive, aerospace, and industrial applications, and expanding their long-standing partnership established in 2017.
Siemens Digital Industries Software is a global leader in industrial automation and digitalization solutions, offering advanced Computer Aided Manufacturing (CAM) software to streamline product design, engineering, and production. Its portfolio integrates CAD, CAM, and PLM technologies, empowering manufacturers across automotive, aerospace, electronics, and industrial sectors to optimize workflows, reduce costs, and accelerate innovation.
-
In April 2025 – Siemens Acquires DownStream Technologies to Enhance PCB Design-to-Manufacturing WorkflowSiemens Digital Industries Software acquired DownStream Technologies, a specialist in PCB manufacturing data preparation, to strengthen its design-to-production process and expand its presence in the electronics SMB market, promising improved time-to-market, quality, and cost efficiency for customers.
Computer Aided Manufacturing Market Key Players:
Some of the Computer Aided Manufacturing Market Companies
-
ANSYS, Inc.
-
Altair Engineering Inc.
-
Autodesk, Inc.
-
Bentley Systems, Incorporated.
-
Dassault Systèmes SE
-
Rockwell Automation
-
Siemens Digital Industries Software
-
BETA CAE Systems
-
COMSOL
-
PTC Inc.
-
Hexagon AB
-
Symscape
-
Synopsys, Inc.
-
Sandisk (Western Digital)
-
OPEN MIND Technologies AG
-
Tebis AG
-
VERICUT (CGTech)
-
Missler Software (TopSolid)
-
DP Technology Corp. (ESPRIT)
-
ESI Group
Report Attributes | Details |
Market Size in 2024 | USD 3.55 Billion |
Market Size by 2032 | USD 7.09 Billion |
CAGR | CAGR of 9.04% From 2024 to 2032 |
Base Year | 2024 |
Forecast Period | 2025-2032 |
Historical Data | 2021-2023 |
Report Scope & Coverage | Market Size, Segments Analysis, Competitive Landscape, Regional Analysis, DROC & SWOT Analysis, Forecast Outlook |
Key Segments | • By Component(Software and Services) • By Deployment(On premise and Cloud) • By Manufacturing Process (Milling, Turning, Drilling, Multi-Axis / 5-Axis and Additive Manufacturing) • By End Use(Automotive, Aerospace & Defense, Industrial Equipment, Medical Devices & Component, Energy & Utilities and Others) |
Regional Analysis/Coverage | North America (US, Canada), Europe (Germany, UK, France, Italy, Spain, Russia, Poland, Rest of Europe), Asia Pacific (China, India, Japan, South Korea, Australia, ASEAN Countries, Rest of Asia Pacific), Middle East & Africa (UAE, Saudi Arabia, Qatar, South Africa, Rest of Middle East & Africa), Latin America (Brazil, Argentina, Mexico, Colombia, Rest of Latin America). |
Company Profiles | ANSYS, Inc., Altair Engineering Inc., Autodesk, Inc., Bentley Systems, Incorporated., Dassault Systèmes SE, Rockwell Automation, Siemens Digital Industries Software, BETA CAE Systems, COMSOL, PTC Inc., Hexagon AB, Symscape, Synopsys, Inc., Sandisk (Western Digital), OPEN MIND Technologies AG, Tebis AG, VERICUT (CGTech), Missler Software (TopSolid), DP Technology Corp. (ESPRIT), ESI Group |
Table Of Contents
1. Introduction
1.1 Market Definition & Scope
1.2 Research Assumptions & Abbreviations
1.3 Research Methodology
2. Executive Summary
2.1 Market Snapshot
2.2 Market Absolute $ Opportunity Assessment & Y-o-Y Analysis, 2021–2032
2.3 Market Size & Forecast, By Segmentation, 2021–2032
2.3.1 Market Size By Component
2.3.2 Market Size By Deployment
2.3.3 Market Size By Manufacturing Process
2.3.4 Market Size By End Use
2.4 Market Share & Bps Analysis by Region, 2024
2.5 Industry Growth Scenarios – Conservative, Including & Optimistic
2.6 Industry CxO’s Perspective
3. Market Overview
3.1 Market Dynamics
3.1.1 Drivers
3.1.2 Restraints
3.1.3 Opportunities
3.1.4 Key Market Trends
3.2 Industry PESTLE Analysis
3.3 Key Industry Forces (Porter’s) Impacting Market Growth
3.4 Industry Supply Chain Analysis
3.4.1 Raw Interconnecting Analog Type Suppliers
3.4.2 Manufacturers
3.4.3 Distributors/Suppliers
3.4.4 Customers/ Voltage Range
3.5 Industry Life Cycle Assessment
3.6 Parent Market Overview
3.7 Market Risk Assessment
4. Statistical Insights & Trends Reporting
4.1 Software Deployment & Adoption Metrics
4.1.1 Percentage of manufacturing units using CAM vs. traditional methods
4.1.2 Adoption rate of cloud-based CAM solutions vs. on-premise
4.1.3 Average number of CAM licenses per manufacturing facility
4.1.4 Growth rate of CAM integration with CAD and PLM systems
4.2 Productivity & Efficiency Statistics
4.2.1 Average reduction in production cycle time (%) after CAM implementation
4.2.2 Percentage increase in precision and product yield using CAM systems
4.2.3 Reduction in material wastage (%) due to CAM-based manufacturing planning
4.3 Technology & Feature Adoption
4.3.1 Share of CAM systems with AI-driven optimization or simulation features
4.3.2 Usage rate of multi-axis machining capabilities (3-axis, 5-axis, 7-axis)
4.3.3 Adoption of real-time monitoring and predictive maintenance in CAM-enabled facilities
4.4 Cost & ROI Indicators
4.4.1 Average cost savings per production batch (%) using CAM systems
4.4.2 Typical payback period (months/years) for CAM software investments
4.4.3 Annual maintenance and licensing cost as a percentage of total production cost
5. Computer Aided Manufacturing market Segmental Analysis & Forecast, By Component, 2021 – 2032
5.1 Introduction
5.2 Software
5.2.1 Key Trends
5.2.2 Market Size & Forecast, 2021 – 2032
5.3 Services
5.3.1 Key Trends
5.3.2 Market Size & Forecast, 2021 – 2032
6. Computer Aided Manufacturing market Segmental Analysis & Forecast, By Deployment, 2021 – 2032
6.1 Introduction
6.2 On premise
6.2.1 Key Trends
6.2.2 Market Size & Forecast, 2021 – 2032
6.3 Cloud
6.3.1 Key Trends
6.3.2 Market Size & Forecast, 2021 – 2032
7. Computer Aided Manufacturing market Segmental Analysis & Forecast, By Manufacturing Process , 2021 – 2032
7.1 Introduction
7.2 Milling
7.2.1 Key Trends
7.2.2 Market Size & Forecast, 2021 – 2032
7.3 Turning
7.3.1 Key Trends
7.3.2 Market Size & Forecast, 2021 – 2032
7.4 Drilling
7.4.1 Key Trends
7.4.2 Market Size & Forecast, 2021 – 2032
7.5 Multi-Axis / 5-Axis
7.5.1 Key Trends
7.5.2 Market Size & Forecast, 2021 – 2032
7.6 Additive Manufacturing
7.6.1 Key Trends
7.6.2 Market Size & Forecast, 2021 – 2032
8. Computer Aided Manufacturing market Segmental Analysis & Forecast, By End Use, 2021 – 2032
8.1 Introduction
8.2 Automotive
8.2.1 Key Trends
8.2.2 Market Size & Forecast, 2021 – 2032
8.3 Aerospace & Defense
8.3.1 Key Trends
8.3.2 Market Size & Forecast, 2021 – 2032
8.4 Industrial Equipment
8.4.1 Key Trends
8.4.2 Market Size & Forecast, 2021 – 2032
8.5 Medical Devices & Component
8.5.1 Key Trends
8.5.2 Market Size & Forecast, 2021 – 2032
8.6 Energy & Utilities
8.6.1 Key Trends
8.6.2 Market Size & Forecast, 2021 – 2032
8.7 Others
8.7.1 Key Trends
8.7.2 Market Size & Forecast, 2021 – 2032
9. Computer Aided Manufacturing market Segmental Analysis & Forecast By Region, 2021 – 2025
9.1 Introduction
9.2 North America
9.2.1 Key Trends
9.2.2 Computer Aided Manufacturing market Size & Forecast, By Component , 2021 – 2032
9.2.3 Computer Aided Manufacturing market Size & Forecast, By Deployment , 2021 – 2032
9.2.4 Computer Aided Manufacturing market Size & Forecast, By Manufacturing Process , 2021 – 2032
9.2.5 Computer Aided Manufacturing market Size & Forecast, By End Use , 2021 – 2032
9.2.6 Computer Aided Manufacturing market Size & Forecast, By Country, 2021 – 2032
9.2.6.1 USA
9.2.6.1.1 Computer Aided Manufacturing market Size & Forecast, By Component , 2021 – 2032
9.2.6.1.2 Computer Aided Manufacturing market Size & Forecast, By Deployment , 2021 – 2032
9.2.6.1.3 Computer Aided Manufacturing market Size & Forecast, By Manufacturing Process , 2021 – 2032
9.2.6.1.4 Computer Aided Manufacturing market Size & Forecast, By End Use , 2021 – 2032
9.2.6.2 Canada
9.2.6.2.1 Computer Aided Manufacturing market Size & Forecast, By End Use , 2021 – 2032
9.2.6.2.2 Computer Aided Manufacturing market Size & Forecast, By Deployment , 2021 – 2032
9.2.6.2.3 Computer Aided Manufacturing market Size & Forecast, By Detection Technology, 2021 – 2032
9.2.6.2.4 Computer Aided Manufacturing market Size & Forecast, By Component, 2021 – 2032
9.3 Europe
9.3.1 Key Trends
9.3.2 Computer Aided Manufacturing market Size & Forecast, By Component , 2021 – 2032
9.3.3 Computer Aided Manufacturing market Size & Forecast, By Deployment , 2021 – 2032
9.3.4 Computer Aided Manufacturing market Size & Forecast, By Manufacturing Process , 2021 – 2032
9.3.5 Computer Aided Manufacturing market Size & Forecast, By End Use , 2021 – 2032
9.3.6 Computer Aided Manufacturing market Size & Forecast, By Country, 2021 – 2032
9.3.6.1 Germany
9.3.6.1.1 Computer Aided Manufacturing market Size & Forecast, By Component , 2021 – 2032
9.3.6.1.2 Computer Aided Manufacturing market Size & Forecast, By Deployment , 2021 – 2032
9.3.6.1.3 Computer Aided Manufacturing market Size & Forecast, By Manufacturing Process , 2021 – 2032
9.3.6.1.4 Computer Aided Manufacturing market Size & Forecast, By End Use , 2021 – 2032
9.3.6.2 UK
9.3.6.2.1 Computer Aided Manufacturing market Size & Forecast, By Component , 2021 – 2032
9.3.6.2.2 Computer Aided Manufacturing market Size & Forecast, By Deployment , 2021 – 2032
9.3.6.2.3 Computer Aided Manufacturing market Size & Forecast, By Manufacturing Process , 2021 – 2032
9.3.6.2.4 Computer Aided Manufacturing market Size & Forecast, By End Use , 2021 – 2032
9.3.6.3 France
9.3.6.3.1 Computer Aided Manufacturing market Size & Forecast, By Component , 2021 – 2032
9.3.6.3.2 Computer Aided Manufacturing market Size & Forecast, By Deployment , 2021 – 2032
9.3.6.3.3 Computer Aided Manufacturing market Size & Forecast, By Manufacturing Process , 2021 – 2032
9.3.6.3.4 Computer Aided Manufacturing market Size & Forecast, By End Use , 2021 – 2032
9.3.6.4 Italy
9.3.6.4.1 Computer Aided Manufacturing market Size & Forecast, By Component , 2021 – 2032
9.3.6.4.2 Computer Aided Manufacturing market Size & Forecast, By Deployment , 2021 – 2032
9.3.6.4.3 Computer Aided Manufacturing market Size & Forecast, By Manufacturing Process , 2021 – 2032
9.3.6.4.4 Computer Aided Manufacturing market Size & Forecast, By End Use , 2021 – 2032
9.3.6.5 Spain
9.3.6.5.1 Computer Aided Manufacturing market Size & Forecast, By Component , 2021 – 2032
9.3.6.5.2 Computer Aided Manufacturing market Size & Forecast, By Deployment , 2021 – 2032
9.3.6.5.3 Computer Aided Manufacturing market Size & Forecast, By Manufacturing Process , 2021 – 2032
9.3.6.5.4 Computer Aided Manufacturing market Size & Forecast, By End Use , 2021 – 2032
9.3.6.6 Russia
9.3.6.6.1 Computer Aided Manufacturing market Size & Forecast, By Component , 2021 – 2032
9.3.6.6.2 Computer Aided Manufacturing market Size & Forecast, By Deployment , 2021 – 2032
9.3.6.6.3 Computer Aided Manufacturing market Size & Forecast, By Manufacturing Process , 2021 – 2032
9.3.6.6.4 Computer Aided Manufacturing market Size & Forecast, By End Use , 2021 – 2032
9.3.6.7 Poland
9.3.6.7.1 Computer Aided Manufacturing market Size & Forecast, By Component , 2021 – 2032
9.3.6.7.2 Computer Aided Manufacturing market Size & Forecast, By Deployment , 2021 – 2032
9.3.6.7.3 Computer Aided Manufacturing market Size & Forecast, By Manufacturing Process , 2021 – 2032
9.3.6.7.4 Computer Aided Manufacturing market Size & Forecast, By End Use , 2021 – 2032
9.3.6.8 Rest of Europe
9.3.6.8.1 Computer Aided Manufacturing market Size & Forecast, By Component , 2021 – 2032
9.3.6.8.2 Computer Aided Manufacturing market Size & Forecast, By Deployment , 2021 – 2032
9.3.6.8.3 Computer Aided Manufacturing market Size & Forecast, By Manufacturing Process , 2021 – 2032
9.3.6.8.4 Computer Aided Manufacturing market Size & Forecast, By End Use , 2021 – 2032
9.4 Asia-Pacific
9.4.1 Key Trends
9.4.2 Computer Aided Manufacturing market Size & Forecast, By Component , 2021 – 2032
9.4.3 Computer Aided Manufacturing market Size & Forecast, By Deployment , 2021 – 2032
9.4.4 Computer Aided Manufacturing market Size & Forecast, By Manufacturing Process , 2021 – 2032
9.4.5 Computer Aided Manufacturing market Size & Forecast, By End Use , 2021 – 2032
9.4.6 Computer Aided Manufacturing market Size & Forecast, By Country, 2021 – 2032
9.4.6.1 China
9.4.6.1.1 Computer Aided Manufacturing market Size & Forecast, By Component , 2021 – 2032
9.4.6.1.2 Computer Aided Manufacturing market Size & Forecast, By Deployment , 2021 – 2032
9.4.6.1.3 Computer Aided Manufacturing market Size & Forecast, By Manufacturing Process , 2021 – 2032
9.4.6.1.4 Computer Aided Manufacturing market Size & Forecast, By End Use , 2021 – 2032
9.4.6.2 India
9.4.6.2.1 Computer Aided Manufacturing market Size & Forecast, By Component , 2021 – 2032
9.4.6.2.2 Computer Aided Manufacturing market Size & Forecast, By Deployment , 2021 – 2032
9.4.6.2.3 Computer Aided Manufacturing market Size & Forecast, By Manufacturing Process , 2021 – 2032
9.4.6.2.4 Computer Aided Manufacturing market Size & Forecast, By End Use , 2021 – 2032
9.4.6.3 Japan
9.4.6.3.1 Computer Aided Manufacturing market Size & Forecast, By Component , 2021 – 2032
9.4.6.3.2 Computer Aided Manufacturing market Size & Forecast, By Deployment , 2021 – 2032
9.4.6.3.3 Computer Aided Manufacturing market Size & Forecast, By Manufacturing Process , 2021 – 2032
9.4.6.3.4 Computer Aided Manufacturing market Size & Forecast, By End Use , 2021 – 2032
9.4.6.4 South Korea
9.4.6.4.1 Computer Aided Manufacturing market Size & Forecast, By Component , 2021 – 2032
9.4.6.4.2 Computer Aided Manufacturing market Size & Forecast, By Deployment , 2021 – 2032
9.4.6.4.3 Computer Aided Manufacturing market Size & Forecast, By Manufacturing Process , 2021 – 2032
9.4.6.4.4 Computer Aided Manufacturing market Size & Forecast, By End Use , 2021 – 2032
9.4.6.5 Australia
9.4.6.5.1 Computer Aided Manufacturing market Size & Forecast, By Component , 2021 – 2032
9.4.6.5.2 Computer Aided Manufacturing market Size & Forecast, By Deployment , 2021 – 2032
9.4.6.5.3 Computer Aided Manufacturing market Size & Forecast, By Manufacturing Process , 2021 – 2032
9.4.6.5.4 Computer Aided Manufacturing market Size & Forecast, By End Use , 2021 – 2032
9.4.6.6 ASEAN Countries
9.4.6.6.1 Computer Aided Manufacturing market Size & Forecast, By Component , 2021 – 2032
9.4.6.6.2 Computer Aided Manufacturing market Size & Forecast, By Deployment , 2021 – 2032
9.4.6.6.3 Computer Aided Manufacturing market Size & Forecast, By Manufacturing Process , 2021 – 2032
9.4.6.6.4 Computer Aided Manufacturing market Size & Forecast, By End Use , 2021 – 2032
9.4.6.7 Rest of Asia-Pacific
9.4.6.7.1 Computer Aided Manufacturing market Size & Forecast, By Component , 2021 – 2032
9.4.6.7.2 Computer Aided Manufacturing market Size & Forecast, By Deployment , 2021 – 2032
9.4.6.7.3 Computer Aided Manufacturing market Size & Forecast, By Manufacturing Process , 2021 – 2032
9.4.6.7.4 Computer Aided Manufacturing market Size & Forecast, By End Use , 2021 – 2032
9.5 Latin America
9.5.1 Key Trends
9.5.2 Computer Aided Manufacturing market Size & Forecast, By Component , 2021 – 2032
9.5.3 Computer Aided Manufacturing market Size & Forecast, By Deployment , 2021 – 2032
9.5.4 Computer Aided Manufacturing market Size & Forecast, By Manufacturing Process , 2021 – 2032
9.5.5 Computer Aided Manufacturing market Size & Forecast, By End Use , 2021 – 2032
9.5.6 Computer Aided Manufacturing market Size & Forecast, By Country, 2021 – 2032
9.5.6.1 Brazil
9.5.6.1.1 Computer Aided Manufacturing market Size & Forecast, By Component , 2021 – 2032
9.5.6.1.2 Computer Aided Manufacturing market Size & Forecast, By Deployment , 2021 – 2032
9.5.6.1.3 Computer Aided Manufacturing market Size & Forecast, By Manufacturing Process , 2021 – 2032
9.5.6.1.4 Computer Aided Manufacturing market Size & Forecast, By End Use , 2021 – 2032
9.5.6.2 Argentina
9.5.6.2.1 Computer Aided Manufacturing market Size & Forecast, By Component , 2021 – 2032
9.5.6.2.2 Computer Aided Manufacturing market Size & Forecast, By Deployment , 2021 – 2032
9.5.6.2.3 Computer Aided Manufacturing market Size & Forecast, By Manufacturing Process , 2021 – 2032
9.5.6.2.4 Computer Aided Manufacturing market Size & Forecast, By End Use , 2021 – 2032
9.5.6.3 Mexico
9.5.6.3.1 Computer Aided Manufacturing market Size & Forecast, By Component , 2021 – 2032
9.5.6.3.2 Computer Aided Manufacturing market Size & Forecast, By Deployment , 2021 – 2032
9.5.6.3.3 Computer Aided Manufacturing market Size & Forecast, By Manufacturing Process , 2021 – 2032
9.5.6.3.4 Computer Aided Manufacturing market Size & Forecast, By End Use , 2021 – 2032
9.5.6.4 Colombia
9.5.6.4.1 Computer Aided Manufacturing market Size & Forecast, By Component , 2021 – 2032
9.5.6.4.2 Computer Aided Manufacturing market Size & Forecast, By Deployment , 2021 – 2032
9.5.6.4.3 Computer Aided Manufacturing market Size & Forecast, By Manufacturing Process , 2021 – 2032
9.5.6.4.4 Computer Aided Manufacturing market Size & Forecast, By End Use , 2021 – 2032
9.5.6.5 Rest of Latin America
9.5.6.5.1 Computer Aided Manufacturing market Size & Forecast, By Component , 2021 – 2032
9.5.6.5.2 Computer Aided Manufacturing market Size & Forecast, By Deployment , 2021 – 2032
9.5.6.5.3 Computer Aided Manufacturing market Size & Forecast, By Manufacturing Process , 2021 – 2032
9.5.6.5.4 Computer Aided Manufacturing market Size & Forecast, By End Use , 2021 – 2032
9.6 Middle East & Africa
9.6.1 Key Trends
9.6.2 Computer Aided Manufacturing market Size & Forecast, By End Use , 2021 – 2032
9.6.3 Computer Aided Manufacturing market Size & Forecast, By Deployment , 2021 – 2032
9.6.4 Computer Aided Manufacturing market Size & Forecast, By Detection Technology, 2021 – 2032
9.6.5 Computer Aided Manufacturing market Size & Forecast, By Component, 2021 – 2032
9.6.6 Computer Aided Manufacturing market Size & Forecast, By Country, 2021 – 2032
9.6.6.1 UAE
9.6.6.1.1 Computer Aided Manufacturing market Size & Forecast, By Component , 2021 – 2032
9.6.6.1.2 Computer Aided Manufacturing market Size & Forecast, By Deployment , 2021 – 2032
9.6.6.1.3 Computer Aided Manufacturing market Size & Forecast, By Manufacturing Process , 2021 – 2032
9.6.6.1.4 Computer Aided Manufacturing market Size & Forecast, By End Use , 2021 – 2032
9.6.6.2 Saudi Arabia
9.6.6.2.1 Computer Aided Manufacturing market Size & Forecast, By Component , 2021 – 2032
9.6.6.2.2 Computer Aided Manufacturing market Size & Forecast, By Deployment , 2021 – 2032
9.6.6.2.3 Computer Aided Manufacturing market Size & Forecast, By Manufacturing Process , 2021 – 2032
9.6.6.2.4 Computer Aided Manufacturing market Size & Forecast, By End Use , 2021 – 2032
9.6.6.3 Qatar
9.6.6.3.1 Computer Aided Manufacturing market Size & Forecast, By Component , 2021 – 2032
9.6.6.3.2 Computer Aided Manufacturing market Size & Forecast, By Deployment , 2021 – 2032
9.6.6.3.3 Computer Aided Manufacturing market Size & Forecast, By Manufacturing Process , 2021 – 2032
9.6.6.3.4 Computer Aided Manufacturing market Size & Forecast, By End Use , 2021 – 2032
9.6.6.4 Egypt
9.6.6.4.1 Computer Aided Manufacturing market Size & Forecast, By Component , 2021 – 2032
9.6.6.4.2 Computer Aided Manufacturing market Size & Forecast, By Deployment , 2021 – 2032
9.6.6.4.3 Computer Aided Manufacturing market Size & Forecast, By Manufacturing Process , 2021 – 2032
9.6.6.4.4 Computer Aided Manufacturing market Size & Forecast, By End Use , 2021 – 2032
9.6.6.5 South Africa
9.6.6.5.1 Computer Aided Manufacturing market Size & Forecast, By Component , 2021 – 2032
9.6.6.5.2 Computer Aided Manufacturing market Size & Forecast, By Deployment , 2021 – 2032
9.6.6.5.3 Computer Aided Manufacturing market Size & Forecast, By Manufacturing Process , 2021 – 2032
9.6.6.5.4 Computer Aided Manufacturing market Size & Forecast, By End Use , 2021 – 2032
9.6.6.6 Rest of Middle East & Africa
9.6.6.6.1 Computer Aided Manufacturing market Size & Forecast, By Component , 2021 – 2032
9.6.6.6.2 Computer Aided Manufacturing market Size & Forecast, By Deployment , 2021 – 2032
9.6.6.6.3 Computer Aided Manufacturing market Size & Forecast, By Manufacturing Process , 2021 – 2032
9.6.6.6.4 Computer Aided Manufacturing market Size & Forecast, By End Use , 2021 – 2032
10. Competitive Landscape
10.1 Key Players' Positioning
10.2 Competitive Developments
10.2.1 Key Strategies Adopted (%), By Key Players, 2024
10.2.2 Year-Wise Strategies & Development, 2021 – 2025
10.2.3 Number Of Strategies Adopted By Key Players, 2024
10.3 Market Share Analysis, 2024
10.4 Product /Service & Interconnecting Analog Type Benchmarking
10.4.1 Product /Service Specifications & Features By Key Players
10.4.2 Product /Service Heatmap By Key Players
10.4.3 Interconnecting Analog Type Heatmap By Key Players
10.5 Industry Start-Up & Innovation Landscape
10.6 Key Company Profiles
10.6.1 ANSYS, Inc.
10.6.1.1 Company Overview & Snapshot
10.6.1.2 Product /Service Portfolio
10.6.1.3 Key Company Financials
10.6.1.4 SWOT Analysis
10.6.2 Altair Engineering Inc.
10.6.2.1 Company Overview & Snapshot
10.6.2.2 Product /Service Portfolio
10.6.2.3 Key Company Financials
10.6.2.4 SWOT Analysis
10.6.3 Autodesk, Inc.
10.6.3.1 Company Overview & Snapshot
10.6.3.2 Product /Service Portfolio
10.6.3.3 Key Company Financials
10.6.3.4 SWOT Analysis
10.6.4 Bentley Systems, Incorporated.
10.6.4.1 Company Overview & Snapshot
10.6.4.2 Product /Service Portfolio
10.6.4.3 Key Company Financials
10.6.4.4 SWOT Analysis
10.6.5 Dassault Systèmes SE
10.6.5.1 Company Overview & Snapshot
10.6.5.2 Product /Service Portfolio
10.6.5.3 Key Company Financials
10.6.5.4 SWOT Analysis
10.6.6 Rockwell Automation
10.6.6.1 Company Overview & Snapshot
10.6.6.2 Product /Service Portfolio
10.6.6.3 Key Company Financials
10.6.6.4 SWOT Analysis
10.6.7 Siemens Digital Industries Software
10.6.7.1 Company Overview & Snapshot
10.6.7.2 Product /Service Portfolio
10.6.7.3 Key Company Financials
10.6.7.4 SWOT Analysis
10.6.8 BETA CAE Systems
10.6.8.1 Company Overview & Snapshot
10.6.8.2 Product /Service Portfolio
10.6.8.3 Key Company Financials
10.6.8.4 SWOT Analysis
10.6.9 COMSOL
10.6.9.1 Company Overview & Snapshot
10.6.9.2 Product /Service Portfolio
10.6.9.3 Key Company Financials
10.6.9.4 SWOT Analysis
10.6.10 PTC Inc.
10.6.10.1 Company Overview & Snapshot
10.6.10.2 Product /Service Portfolio
10.6.10.3 Key Company Financials
10.6.10.4 SWOT Analysis
10.6.11 Hexagon AB
10.6.11.1 Company Overview & Snapshot
10.6.11.2 Product /Service Portfolio
10.6.11.3 Key Company Financials
10.6.11.4 SWOT Analysis
10.6.12 Symscape
10.6.12.1 Company Overview & Snapshot
10.6.12.2 Product /Service Portfolio
10.6.12.3 Key Company Financials
10.6.12.4 SWOT Analysis
10.6.13 Synopsys, Inc.
10.6.13.1 Company Overview & Snapshot
10.6.13.2 Product /Service Portfolio
10.6.13.3 Key Company Financials
10.6.13.4 SWOT Analysis
10.6.14 Sandisk (Western Digital)
10.6.14.1 Company Overview & Snapshot
10.6.14.2 Product /Service Portfolio
10.6.14.3 Key Company Financials
10.6.14.4 SWOT Analysis
10.6.15 OPEN MIND Technologies AG
10.6.15.1 Company Overview & Snapshot
10.6.15.2 Product /Service Portfolio
10.6.15.3 Key Company Financials
10.6.15.4 SWOT Analysis
10.6.16 Tebis AG
10.6.16.1 Company Overview & Snapshot
10.6.16.2 Product /Service Portfolio
10.6.16.3 Key Company Financials
10.6.16.4 SWOT Analysis
10.6.17 VERICUT (CGTech)
10.6.17.1 Company Overview & Snapshot
10.6.17.2 Product /Service Portfolio
10.6.17.3 Key Company Financials
10.6.17.4 SWOT Analysis
10.6.18 Missler Software (TopSolid)
10.6.18.1 Company Overview & Snapshot
10.6.18.2 Product /Service Portfolio
10.6.18.3 Key Company Financials
10.6.18.4 SWOT Analysis
10.6.19 DP Technology Corp. (ESPRIT)
10.6.19.1 Company Overview & Snapshot
10.6.19.2 Product /Service Portfolio
10.6.19.3 Key Company Financials
10.6.19.4 SWOT Analysis
10.6.20 ESI Group
10.6.20.1 Company Overview & Snapshot
10.6.20.2 Product /Service Portfolio
10.6.20.3 Key Company Financials
10.6.20.4 SWOT Analysis
11. Analyst Recommendations
11.1 SNS Insider Opportunity Map
11.2 Industry Low-Hanging Fruit Assessment
11.3 Market Entry & Growth Strategy
11.4 Analyst Viewpoint & Suggestions On Market Growth
12. Assumptions
13. Disclaimer
14. Appendix
14.1 List Of Tables
14.2 List Of Figures
Key Segments:
By Component
-
Software
-
Services
By Deployment
-
On premise
-
Cloud
By Manufacturing Process
-
Milling
-
Turning
-
Drilling
-
Multi-Axis / 5-Axis
-
Additive Manufacturing
By End Use
-
Automotive
-
Aerospace & Defense
-
Industrial Equipment
-
Medical Devices & Component
-
Energy & Utilities
-
Others
Request for Segment Customization as per your Business Requirement: Segment Customization Request
Regional Coverage:
North America
-
US
-
Canada
Europe
-
Germany
-
UK
-
France
-
Italy
-
Spain
-
Russia
-
Poland
-
Rest of Europe
Asia Pacific
-
China
-
India
-
Japan
-
South Korea
-
Australia
-
ASEAN Countries
-
Rest of Asia Pacific
Middle East & Africa
-
UAE
-
Saudi Arabia
-
Qatar
-
South Africa
-
Rest of Middle East & Africa
Latin America
-
Brazil
-
Argentina
-
Mexico
-
Colombia
-
Rest of Latin America
Request for Country Level Research Report: Country Level Customization Request
Available Customization
With the given market data, SNS Insider offers customization as per the company’s specific needs. The following customization options are available for the report:
-
Detailed Volume Analysis
-
Criss-Cross segment analysis (e.g. Product X Application)
-
Competitive Product Benchmarking
-
Geographic Analysis
-
Additional countries in any of the regions
-
Customized Data Representation
-
Detailed analysis and profiling of additional market players
An accurate research report requires proper strategizing as well as implementation. There are multiple factors involved in the completion of good and accurate research report and selecting the best methodology to compete the research is the toughest part. Since the research reports we provide play a crucial role in any company’s decision-making process, therefore we at SNS Insider always believe that we should choose the best method which gives us results closer to reality. This allows us to reach at a stage wherein we can provide our clients best and accurate investment to output ratio.
Each report that we prepare takes a timeframe of 350-400 business hours for production. Starting from the selection of titles through a couple of in-depth brain storming session to the final QC process before uploading our titles on our website we dedicate around 350 working hours. The titles are selected based on their current market cap and the foreseen CAGR and growth.
The 5 steps process:
Step 1: Secondary Research:
Secondary Research or Desk Research is as the name suggests is a research process wherein, we collect data through the readily available information. In this process we use various paid and unpaid databases which our team has access to and gather data through the same. This includes examining of listed companies’ annual reports, Journals, SEC filling etc. Apart from this our team has access to various associations across the globe across different industries. Lastly, we have exchange relationships with various university as well as individual libraries.

Step 2: Primary Research
When we talk about primary research, it is a type of study in which the researchers collect relevant data samples directly, rather than relying on previously collected data. This type of research is focused on gaining content specific facts that can be sued to solve specific problems. Since the collected data is fresh and first hand therefore it makes the study more accurate and genuine.
We at SNS Insider have divided Primary Research into 2 parts.
Part 1 wherein we interview the KOLs of major players as well as the upcoming ones across various geographic regions. This allows us to have their view over the market scenario and acts as an important tool to come closer to the accurate market numbers. As many as 45 paid and unpaid primary interviews are taken from both the demand and supply side of the industry to make sure we land at an accurate judgement and analysis of the market.
This step involves the triangulation of data wherein our team analyses the interview transcripts, online survey responses and observation of on filed participants. The below mentioned chart should give a better understanding of the part 1 of the primary interview.

Part 2: In this part of primary research the data collected via secondary research and the part 1 of the primary research is validated with the interviews from individual consultants and subject matter experts.
Consultants are those set of people who have at least 12 years of experience and expertise within the industry whereas Subject Matter Experts are those with at least 15 years of experience behind their back within the same space. The data with the help of two main processes i.e., FGDs (Focused Group Discussions) and IDs (Individual Discussions). This gives us a 3rd party nonbiased primary view of the market scenario making it a more dependable one while collation of the data pointers.
Step 3: Data Bank Validation
Once all the information is collected via primary and secondary sources, we run that information for data validation. At our intelligence centre our research heads track a lot of information related to the market which includes the quarterly reports, the daily stock prices, and other relevant information. Our data bank server gets updated every fortnight and that is how the information which we collected using our primary and secondary information is revalidated in real time.

Step 4: QA/QC Process
After all the data collection and validation our team does a final level of quality check and quality assurance to get rid of any unwanted or undesired mistakes. This might include but not limited to getting rid of the any typos, duplication of numbers or missing of any important information. The people involved in this process include technical content writers, research heads and graphics people. Once this process is completed the title gets uploader on our platform for our clients to read it.
Step 5: Final QC/QA Process:
This is the last process and comes when the client has ordered the study. In this process a final QA/QC is done before the study is emailed to the client. Since we believe in giving our clients a good experience of our research studies, therefore, to make sure that we do not lack at our end in any way humanly possible we do a final round of quality check and then dispatch the study to the client.