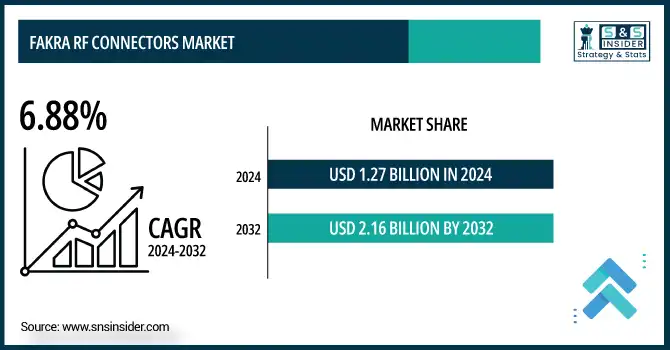
FAKRA RF Connectors Market Report Scope & Overview:
Driving the Future with Smart and Resilient FAKRA RF Connectors
The global FAKRA RF connectors market, valued at USD 1.27 billion in 2024, is projected to reach USD 2.16 billion by 2032, growing at a CAGR of 6.88%. This growth is powered by the accelerating adoption of ADAS, V2X, and infotainment systems in connected vehicles. As vehicles evolve into data-driven platforms, FAKRA connectors are transitioning from standard RF couplers to critical enablers of automotive intelligence and safety.
Accelerating Automotive Intelligence, Compliance & Connectivity
With automotive electrification and autonomy racing ahead, standardization, safety regulations, and production resilience are reshaping global FAKRA demand. Innovations in miniaturized coaxial systems, robust compliance (UNECE, NHTSA), and local sourcing strategies are positioning FAKRA connectors at the heart of next-generation vehicle architectures.
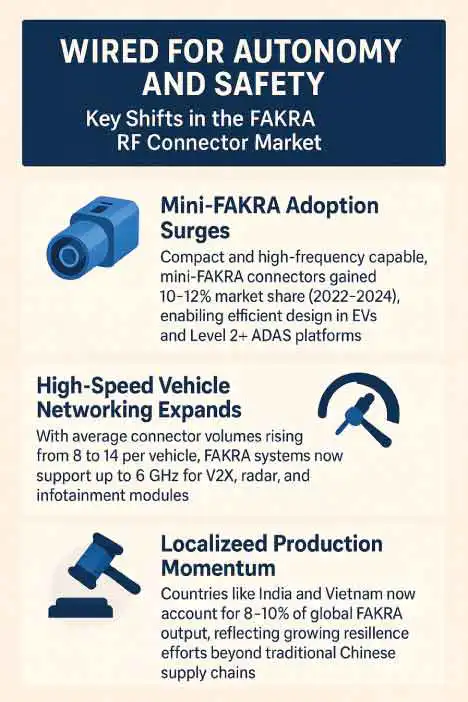
Wired for Autonomy and Safety: Key Shifts in the FAKRA RF Connector Market
Explores how FAKRA connectors are evolving to support high-speed, secure data transmission. Their adoption is accelerating with the rise of ADAS, EVs, and V2X technologies.
Critical Fault Lines in the Vehicle Connectivity Stack
CHALLENGE |
STAT/FACT |
MARKET IMPACT |
System Failures |
~83% of connected vehicle prototypes report at least one connector failure |
Drives need for pre-tested, OEM-grade FAKRA harnesses and plug‑and‑play interfaces |
Signal Integrity Risks |
Radar blind spots traced to poor shielding or connector mismatch (2023 SAE) |
Spurs demand for low-loss, 360° shielded mini-FAKRA variants |
Production Dependency |
>60% of FAKRA connectors made in China (2022 baseline) |
Fuels reshoring and component standardization in U.S., Europe, and Asia |
Labor Skill Gaps |
Field reports cite miscrimping and reverse mating as major failure causes |
Accelerates shift to pre-terminated and color-coded FAKRA assemblies |
Policy Volatility |
Delays in ADAS mandates could impact billions in RF connector demand |
Makes market sensitive to UNECE/NHTSA legislative timelines |
Wired for Growth: Key Trends Driving the FAKRA RF Connectors Market
How Ordinary and Mini-FAKRA Connectors Are Powering the Next Generation of Automotive and Aerospace Connectivity
Geographical Breakdown of the FAKRA RF Connectors Market: 2024 Benchmarks and CAGR Projections
Region |
2024 Market Share (%) |
CAGR (2025–2032) |
Insights |
North America |
39% |
4.34% |
Driven by high ADAS penetration and telematics mandates in the U.S. |
Europe |
XX |
XX |
Luxury OEMs like BMW, Audi, Mercedes driving RF adoption |
Asia-Pacific |
26% |
9.03% (Fastest) |
China and Japan leading connected and intelligent vehicle deployment |
Latin America |
XX |
XX |
Gradual growth with expansion of infotainment in emerging auto sectors |
Middle East & Africa |
XX |
XX |
Infrastructure developments and smart vehicle adoption in UAE, S. Africa |
Country |
Vehicle Production (2024) |
Relevance to FAKRA Connectors |
China |
31.3 million units 33% of global output |
✔ Rapid rollout of ADAS systems ✔ Strong investment in ICV infrastructure ✔ Expansion of 5G/V2X |
United States |
10.6 million units |
✔ Over 90% ADAS penetration (AEB, FCW, LDW) ✔ High adoption of telematics, GPS, infotainment ✔ OEM push for autonomous tech |
Europe / Germany |
18 million units (Europe) 4.1 million units (Germany) |
✔ Premium OEMs (BMW, Audi, Mercedes) adopt advanced RF systems ✔ EV & luxury trends driving higher FAKRA density |
Transforming the U.S. FAKRA RF Connectors Market Through Policy, Safety, and Smart Mobility Innovation
The U.S. FAKRA RF Connectors Market, valued at USD 0.34 billion in 2024, is projected to reach USD 0.42 billion by 2032, reflecting a CAGR of 2.92%. This growth is fueled by stricter automotive safety standards, rising ADAS deployment, and a surge in connected vehicle infrastructure.
Wiring the Future of Mobility with U.S. FAKRA RF Connector Growth in ADAS and EV Integration
In the U.S., over 90% of key ADAS features were present in new vehicles by 2023 (NHTSA), while public EV charging ports surpassed 195,000 by early 2025 (AFDC/DOE), both accelerating demand for certified FAKRA RF connectors.
Smart Mobility Infrastructure Accelerates Demand for Intelligent FAKRA Connectors
Urban EV rollout, transit automation, and micro-grid electrification are driving large-scale deployment of RF connectors with diagnostics, remote monitoring, and predictive capabilities.
Barriers Hindering the U.S. FAKRA RF Connectors Market Expansion
Challenge |
Details |
Legacy procurement practices |
Continue to favor low-cost, non-certified alternatives, leading to risks in durability, safety, and standards compliance. |
Aging automotive electronics platforms |
Often lack native support for FAKRA connectors, requiring costly system redesigns or custom retrofitting. |
Fragmented state-level regulations |
Result in inconsistent adoption and enforcement, preventing cohesive, nationwide market growth. |
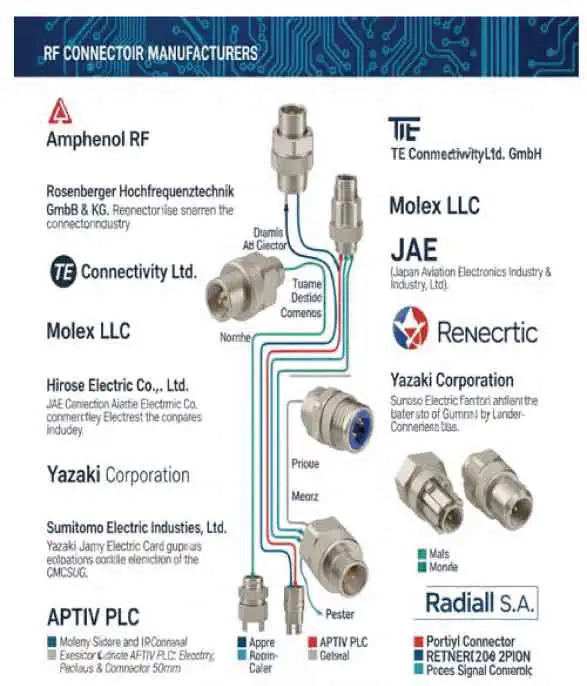
Key Players:
The FAKRA RF Connectors Market Companies are:
Recent Developments:
Report Attributes | Details |
Market Size in 2024 | USD 1.27 Billion |
Market Size by 2032 | USD 2.16 Billion |
CAGR | CAGR of 6.88% From 2024 to 2032 |
Base Year | 2024 |
Forecast Period | 2025-2032 |
Historical Data | 2021-2023 |
Report Scope & Coverage | Market Size, Segments Analysis, Competitive Landscape, Regional Analysis, DROC & SWOT Analysis, Forecast Outlook |
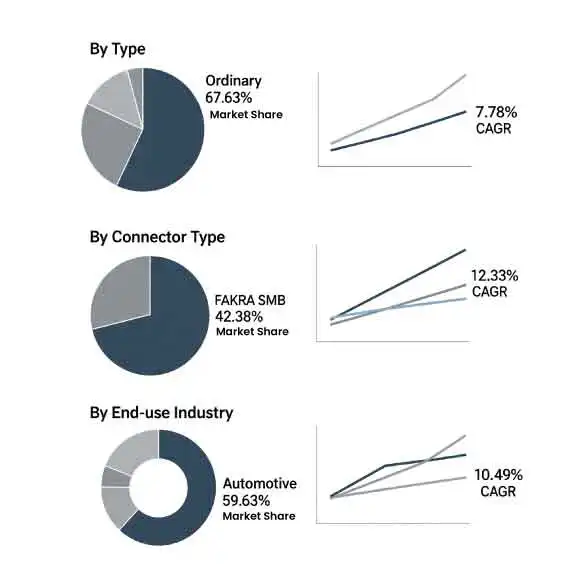
Key Segments | • By Type(Ordinary FAKRA, Mini FAKRA) • By Connector type(FAKRA SMB connectors, FAKRA II connectors, FAKRA HSD connectors, Other connector types) • By End-use industry(Automotive, Aerospace and defense, Consumer electronics, Telecommunications, Other industries) |
Regional Analysis/Coverage | North America (US, Canada, Mexico), Europe (Germany, France, UK, Italy, Spain, Poland, Turkey, Rest of Europe), Asia Pacific (China, India, Japan, South Korea, Singapore, Australia, Taiwan, Rest of Asia Pacific), Middle East & Africa (UAE, Saudi Arabia, Qatar, South Africa, Rest of Middle East & Africa), Latin America (Brazil, Argentina, Rest of Latin America) |
Company Profiles | The FAKRA RF Connectors Market Companies are Amphenol RF, Rosenberger, TE Connectivity, Molex, JAE, Hirose Electric, Yazaki, Sumitomo Electric, APTIV, Radiall and Others. |
Ans: The FAKRA RF Connectors Market is expected to grow at a CAGR of 6.88% during 2025-2032.
Ans: FAKRA RF Connectors Market size was valued at USD 1.27 Billion in 2024 and is projected to reach USD 2.16 Billion by 2032
Ans: Rising demand for high-speed, reliable in-vehicle communication systems in connected and autonomous vehicles is the key driver of the FAKRA RF Connectors Market.
Ans: The “Ordinary FAKRA” segment dominated the FAKRA RF Connectors Market.
Ans: North America dominated the FAKRA RF Connectors Market in 2024.
Table of Contents
1. Introduction
1.1 Market Definition
1.2 Scope (Inclusion and Exclusions)
1.3 Research Assumptions
2. Executive Summary
2.1 Market Overview
2.2 Regional Synopsis
2.3 Competitive Summary
3. Research Methodology
3.1 Top-Down Approach
3.2 Bottom-up Approach
3.3. Data Validation
3.4 Primary Interviews
4. Market Dynamics Impact Analysis
4.1 Market Driving Factors Analysis
4.1.1 Drivers
4.1.2 Restraints
4.1.3 Opportunities
4.1.4 Challenges
4.2 PESTLE Analysis
4.3 Porter’s Five Forces Model
5. Statistical Insights and Trends Reporting
5.1 Phase-Matching and Tuning Data
5.2 Deployment Statistics by Application Tier
5.3 Material and Structural Parameters
5.4 Frequency Conversion Usage Metrics
6. Competitive Landscape
6.1 List of Major Companies, By Region
6.2 Market Share Analysis, By Region
6.3 Product Benchmarking
6.3.1 Product specifications and features
6.3.2 Pricing
6.4 Strategic Initiatives
6.4.1 Marketing and promotional activities
6.4.2 Distribution and Supply Chain Strategies
6.4.3 Expansion plans and new Product launches
6.4.4 Strategic partnerships and collaborations
6.5 Technological Advancements
6.6 Market Positioning and Branding
7. FAKRA RF Connectors Market Segmentation By Type
7.1 Chapter Overview
7.2 Ordinary FAKRA
7.2.1 Ordinary FAKRA Market Trends Analysis (2021-2032)
7.2.2 Ordinary FAKRA Market Size Estimates and Forecasts to 2032 (USD Billion)
7.3 Mini FAKRA
7.3.1 Mini FAKRA Market Trends Analysis (2021-2032)
7.3.2 Mini FAKRA Market Size Estimates and Forecasts to 2032 (USD Billion)
8. FAKRA RF Connectors Market Segmentation By Connector Type
8.1 Chapter Overview
8.2 FAKRA SMB connectors
8.2.1 FAKRA SMB connectors Market Trend Analysis (2021-2032)
8.2.2 FAKRA SMB connectors Market Size Estimates and Forecasts to 2032 (USD Billion)
8.3 FAKRA II connectors
8.3.1 FAKRA II connectors Market Trends Analysis (2021-2032)
8.3.2 FAKRA II connectors Market Size Estimates and Forecasts to 2032 (USD Billion)
8.3 FAKRA HSD connectors
8.3.1 FAKRA HSD connectors Market Trends Analysis (2021-2032)
8.3.2 FAKRA HSD connectors Market Size Estimates and Forecasts to 2032 (USD Billion)
8.3 Other connector types
8.3.1 Other connector types Market Trends Analysis (2021-2032)
8.3.2 Other connector types Market Size Estimates and Forecasts to 2032 (USD Billion)
9. FAKRA RF Connectors Market Segmentation By End-use Industry
9.1 Chapter Overview
9.2 Automotive
9.2.1 Automotive Market Trends Analysis (2021-2032)
9.2.2 Automotive Market Size Estimates and Forecasts to 2032 (USD Billion)
9.3 Aerospace and defense
9.3.1 Aerospace and defense Market Trends Analysis (2021-2032)
9.3.2 Aerospace and defense Market Size Estimates and Forecasts to 2032 (USD Billion)
9.4 Consumer electronics
9.4.1 Consumer electronics Market Trends Analysis (2021-2032)
9.4.2 Consumer electronics Market Size Estimates and Forecasts to 2032 (USD Billion)
9.5 Telecommunications
9.5.1 Telecommunications Market Trends Analysis (2021-2032)
9.5.2 Telecommunications Market Size Estimates and Forecasts to 2032 (USD Billion)
9.6 Other industries
9.6.1 Other industries Market Trends Analysis (2021-2032)
9.6.2 Other industries Market Size Estimates and Forecasts to 2032 (USD Billion)
10. Regional Analysis
10.1 Chapter Overview
10.2 North America
10.2.1 Trends Analysis
10.2.2 North America FAKRA RF Connectors Market Estimates and Forecasts, by Country (2021-2032) (USD Billion)
10.2.3 North America FAKRA RF Connectors Market Estimates and Forecasts, By Type (2021-2032) (USD Billion)
10.2.4 North America FAKRA RF Connectors Market Estimates and Forecasts, By Connector Type(2021-2032) (USD Billion)
10.2.5 North America FAKRA RF Connectors Market Estimates and Forecasts, By End-use Industry (2021-2032) (USD Billion)
10.2.6 USA
10.2.6.1 USA FAKRA RF Connectors Market Estimates and Forecasts, By Type (2021-2032) (USD Billion)
10.2.6.2 USA FAKRA RF Connectors Market Estimates and Forecasts, By Connector Type(2021-2032) (USD Billion)
10.2.6.3 USA FAKRA RF Connectors Market Estimates and Forecasts, By End-use Industry (2021-2032) (USD Billion)
10.2.7 Canada
10.2.7.1 Canada FAKRA RF Connectors Market Estimates and Forecasts, By Type (2021-2032) (USD Billion)
10.2.7.2 Canada FAKRA RF Connectors Market Estimates and Forecasts, By Connector Type(2021-2032) (USD Billion)
10.2.7.3 Canada FAKRA RF Connectors Market Estimates and Forecasts, By End-use Industry (2021-2032) (USD Billion)
10.2.8 Mexico
10.2.8.1 Mexico FAKRA RF Connectors Market Estimates and Forecasts, By Type (2021-2032) (USD Billion)
10.2.8.2 Mexico FAKRA RF Connectors Market Estimates and Forecasts, By Connector Type(2021-2032) (USD Billion)
10.2.8.3 Mexico FAKRA RF Connectors Market Estimates and Forecasts, By End-use Industry (2021-2032) (USD Billion)
10.3 Europe
10.3.1 Trends Analysis
10.3.2 Europe FAKRA RF Connectors Market Estimates and Forecasts, by Country (2021-2032) (USD Billion)
10.3.3 Europe FAKRA RF Connectors Market Estimates and Forecasts, By Type (2021-2032) (USD Billion)
10.3.4 Europe FAKRA RF Connectors Market Estimates and Forecasts, By Connector Type(2021-2032) (USD Billion)
10.3.5 Europe FAKRA RF Connectors Market Estimates and Forecasts, By End-use Industry(2021-2032) (USD Billion)
10.3.6 Germany
10.3.1.6.1 Germany FAKRA RF Connectors Market Estimates and Forecasts, By Type (2021-2032) (USD Billion)
10.3.1.6.2 Germany FAKRA RF Connectors Market Estimates and Forecasts, By Connector Type(2021-2032) (USD Billion)
10.3.1.6.3 Germany FAKRA RF Connectors Market Estimates and Forecasts, By End-use Industry (2021-2032) (USD Billion)
10.3.7 France
10.3.7.1 France FAKRA RF Connectors Market Estimates and Forecasts, By Type (2021-2032) (USD Billion)
10.3.7.2 France a FAKRA RF Connectors Market Estimates and Forecasts, By Connector Type(2021-2032) (USD Billion)
10.3.7.3 France FAKRA RF Connectors Market Estimates and Forecasts, By End-use Industry (2021-2032) (USD Billion)
10.3.8 UK
10.3.8.1 UK FAKRA RF Connectors Market Estimates and Forecasts, By Type (2021-2032) (USD Billion)
10.3.8.2 UK FAKRA RF Connectors Market Estimates and Forecasts, By Connector Type(2021-2032) (USD Billion)
10.3.8.3 UK FAKRA RF Connectors Market Estimates and Forecasts, By End-use Industry (2021-2032) (USD Billion)
10.3.9 Italy
10.3.9.1 Italy FAKRA RF Connectors Market Estimates and Forecasts, By Type (2021-2032) (USD Billion)
10.3.9.2 Italy FAKRA RF Connectors Market Estimates and Forecasts, By Connector Type(2021-2032) (USD Billion)
10.3.9.3 Italy FAKRA RF Connectors Market Estimates and Forecasts, By End-use Industry (2021-2032) (USD Billion)
10.3.10 Spain
10.3.10.1 Spain FAKRA RF Connectors Market Estimates and Forecasts, By Type (2021-2032) (USD Billion)
10.3.10.2 Spain FAKRA RF Connectors Market Estimates and Forecasts, By Connector Type(2021-2032) (USD Billion)
10.3.10.3 Spain FAKRA RF Connectors Market Estimates and Forecasts, By End-use Industry (2021-2032) (USD Billion)
10.3.12 Poland
10.3.12.1 Poland FAKRA RF Connectors Market Estimates and Forecasts, by Country (2021-2032) (USD Billion)
10.3.12.1 Poland FAKRA RF Connectors Market Estimates and Forecasts, By Type (2021-2032) (USD Billion)
10.3.12.3 Poland FAKRA RF Connectors Market Estimates and Forecasts, By Connector Type(2021-2032) (USD Billion)
10.3.12.3 Poland FAKRA RF Connectors Market Estimates and Forecasts, By End-use Industry (2021-2032) (USD Billion)
10.3.13 Turkey
10.3.13.1 Turkey FAKRA RF Connectors Market Estimates and Forecasts, By Type (2021-2032) (USD Billion)
10.3.13.2 Turkey FAKRA RF Connectors Market Estimates and Forecasts, By Connector Type(2021-2032) (USD Billion)
10.3.13.3 Turkey FAKRA RF Connectors Market Estimates and Forecasts, By End-use Industry (2021-2032) (USD Billion)
10.3.14 Rest of Europe
10.3.14.1 Rest of Europe FAKRA RF Connectors Market Estimates and Forecasts, By Type (2021-2032) (USD Billion)
10.3.14.2 Rest of Europe FAKRA RF Connectors Market Estimates and Forecasts, By Connector Type(2021-2032) (USD Billion)
10.3.14.3 Rest of Europe FAKRA RF Connectors Market Estimates and Forecasts, By End-use Industry(2021-2032) (USD Billion)
10.4 Asia-Pacific
10.4.1 Trends Analysis
10.4.2 Asia-Pacific FAKRA RF Connectors Market Estimates and Forecasts, by Country (2021-2032) (USD Billion)
10.4.3 Asia-Pacific FAKRA RF Connectors Market Estimates and Forecasts, By Type (2021-2032) (USD Billion)
10.4.4 Asia-Pacific FAKRA RF Connectors Market Estimates and Forecasts, By Connector Type(2021-2032) (USD Billion)
10.4.5 Asia-Pacific FAKRA RF Connectors Market Estimates and Forecasts, By End-use Industry (2021-2032) (USD Billion)
10.4.6 China
10.4.6.1 China FAKRA RF Connectors Market Estimates and Forecasts, By Type (2021-2032) (USD Billion)
10.4.6.2 China FAKRA RF Connectors Market Estimates and Forecasts, By Connector Type(2021-2032) (USD Billion)
10.4.6.3 China FAKRA RF Connectors Market Estimates and Forecasts, By End-use Industry (2021-2032) (USD Billion)
10.4.7 India
10.4.7.1 India FAKRA RF Connectors Market Estimates and Forecasts, By Type (2021-2032) (USD Billion)
10.4.7.2 India FAKRA RF Connectors Market Estimates and Forecasts, By Connector Type(2021-2032) (USD Billion)
10.4.7.3 India FAKRA RF Connectors Market Estimates and Forecasts, By End-use Industry (2021-2032) (USD Billion)
10.4.8 Japan
10.4.8.1 Japan FAKRA RF Connectors Market Estimates and Forecasts, By Type (2021-2032) (USD Billion)
10.4.8.2 Japan FAKRA RF Connectors Market Estimates and Forecasts, By Connector Type(2021-2032) (USD Billion)
10.4.8.3 Japan FAKRA RF Connectors Market Estimates and Forecasts, By End-use Industry (2021-2032) (USD Billion)
10.4.9 South Korea
10.4.9.1 South Korea FAKRA RF Connectors Market Estimates and Forecasts, By Type (2021-2032) (USD Billion)
10.4.9.2 South Korea FAKRA RF Connectors Market Estimates and Forecasts, By Connector Type(2021-2032) (USD Billion)
10.4.9.3 South Korea FAKRA RF Connectors Market Estimates and Forecasts, By End-use Industry (2021-2032) (USD Billion)
10.4.10 Singapore
10.4.10.1 Singapore FAKRA RF Connectors Market Estimates and Forecasts, By Type (2021-2032) (USD Billion)
10.4.10.2 Singapore FAKRA RF Connectors Market Estimates and Forecasts, By Connector Type(2021-2032) (USD Billion)
10.4.10.3 Singapore FAKRA RF Connectors Market Estimates and Forecasts, By End-use Industry (2021-2032) (USD Billion)
10.4.11 Australia
10.4.11.1 Australia FAKRA RF Connectors Market Estimates and Forecasts, By Type (2021-2032) (USD Billion)
10.4.11.2 Australia FAKRA RF Connectors Market Estimates and Forecasts, By Connector Type(2021-2032) (USD Billion)
10.4.11.3 Australia FAKRA RF Connectors Market Estimates and Forecasts, By End-use Industry (2021-2032) (USD Billion)
10.4.12 Taiwan
10.4.12.1 Taiwan FAKRA RF Connectors Market Estimates and Forecasts, By Type (2021-2032) (USD Billion)
10.4.12.2 Taiwan FAKRA RF Connectors Market Estimates and Forecasts, By Connector Type(2021-2032) (USD Billion)
10.4.12.3 Taiwan FAKRA RF Connectors Market Estimates and Forecasts, By End-use Industry (2021-2032) (USD Billion)
10.4.13Rest of Asia-Pacific
10.4.13.1 Rest of Asia-Pacific FAKRA RF Connectors Market Estimates and Forecasts, By Type (2021-2032) (USD Billion)
10.4.13.2 Rest of Asia-Pacific FAKRA RF Connectors Market Estimates and Forecasts, By Connector Type(2021-2032) (USD Billion)
10.4.13.3 Rest of Asia-Pacific FAKRA RF Connectors Market Estimates and Forecasts, By End-use Industry (2021-2032) (USD Billion)
10.5 Middle East and Africa
10.5.1 Trends Analysis
10.5.2 Middle East and Africa East FAKRA RF Connectors Market Estimates and Forecasts, by Country (2021-2032) (USD Billion)
10.5.3Middle East and Africa FAKRA RF Connectors Market Estimates and Forecasts, By Type (2021-2032) (USD Billion)
10.5.4 Middle East and Africa FAKRA RF Connectors Market Estimates and Forecasts, By Connector Type(2021-2032) (USD Billion)
10.5.5 Middle East and Africa FAKRA RF Connectors Market Estimates and Forecasts, By End-use Industry (2021-2032) (USD Billion)
10.5.6 UAE
10.5.6.1 UAE FAKRA RF Connectors Market Estimates and Forecasts, By Type (2021-2032) (USD Billion)
10.5.6.2 UAE FAKRA RF Connectors Market Estimates and Forecasts, By Connector Type(2021-2032) (USD Billion)
10.5.6.3 UAE FAKRA RF Connectors Market Estimates and Forecasts, By End-use Industry (2021-2032) (USD Billion)
10.5.7 Saudi Arabia
10.5.7.1 Saudi Arabia FAKRA RF Connectors Market Estimates and Forecasts, By Type (2021-2032) (USD Billion)
10.5.7.2 Saudi Arabia FAKRA RF Connectors Market Estimates and Forecasts, By Connector Type(2021-2032) (USD Billion)
10.5.7.3 Saudi Arabia FAKRA RF Connectors Market Estimates and Forecasts, By End-use Industry (2021-2032) (USD Billion)
10.5.8 Qatar
10.5.8.1 Qatar FAKRA RF Connectors Market Estimates and Forecasts, By Type (2021-2032) (USD Billion)
10.5.8.2 Qatar FAKRA RF Connectors Market Estimates and Forecasts, By Connector Type(2021-2032) (USD Billion)
10.5.8.3 Qatar FAKRA RF Connectors Market Estimates and Forecasts, By End-use Industry (2021-2032) (USD Billion)
10.5.9 South Africa
10.5.9 1 South Africa FAKRA RF Connectors Market Estimates and Forecasts, By Type (2021-2032) (USD Billion)
10.5.9 2 South Africa FAKRA RF Connectors Market Estimates and Forecasts By Connector Type(2021-2032) (USD Billion)
10.5.9 3 South Africa FAKRA RF Connectors Market Estimates and Forecasts, By End-use Industry (2021-2032) (USD Billion)
10.5.10 Rest of Middle East & Africa
10.5.10.1 Rest of Middle East & Africa FAKRA RF Connectors Market Estimates and Forecasts, By Type (2021-2032) (USD Billion)
10.5.10.2 Rest of Middle East & Africa FAKRA RF Connectors Market Estimates and Forecasts, By Connector Type(2021-2032) (USD Billion)
10.5.10.3 Rest of Middle East & Africa FAKRA RF Connectors Market Estimates and Forecasts, By End-use Industry (2021-2032) (USD Billion)
10.6 Latin America
10.6.1 Trends Analysis
10.6.2 Latin America FAKRA RF Connectors Market Estimates and Forecasts, by Country (2021-2032) (USD Billion)
10.6.3 Latin America FAKRA RF Connectors Market Estimates and Forecasts, By Type (2021-2032) (USD Billion)
10.6.4 Latin America FAKRA RF Connectors Market Estimates and Forecasts, By Connector Type(2021-2032) (USD Billion)
10.6.5 Latin America FAKRA RF Connectors Market Estimates and Forecasts, By End-use Industry (2021-2032) (USD Billion)
10.6.6 Brazil
10.6.6.1 Brazil FAKRA RF Connectors Market Estimates and Forecasts, By Type (2021-2032) (USD Billion)
10.6.6.2 Brazil FAKRA RF Connectors Market Estimates and Forecasts, By Connector Type(2021-2032) (USD Billion)
10.6.6.3 Brazil FAKRA RF Connectors Market Estimates and Forecasts, By End-use Industry (2021-2032) (USD Billion)
10.6.7 Argentina
10.6.7.1 Argentina FAKRA RF Connectors Market Estimates and Forecasts, By Type (2021-2032) (USD Billion)
10.6.7.2 Argentina FAKRA RF Connectors Market Estimates and Forecasts, By Connector Type(2021-2032) (USD Billion)
10.6.7.3 Argentina FAKRA RF Connectors Market Estimates and Forecasts, By End-use Industry (2021-2032) (USD Billion)
10.6.8 Rest of Latin America
10.6.8.1 Rest of Latin America FAKRA RF Connectors Market Estimates and Forecasts, By Type (2021-2032) (USD Billion)
10.6.8.2 Rest of Latin America FAKRA RF Connectors Market Estimates and Forecasts, By Connector Type(2021-2032) (USD Billion)
10.6.8.3 Rest of Latin America FAKRA RF Connectors Market Estimates and Forecasts, By End-use Industry (2021-2032) (USD Billion)
12. Company Profiles
12.1 Amphenol RF
12.1.1 Company Overview
12.1.2 Financial
12.1.3 Products/ Services Offered
12.1.4 SWOT Analysis
12.2 Rosenberger
12.2.1 Company Overview
12.2.2 Financial
12.2.3 Products/ Services Offered
12.2.4 SWOT Analysis
12.3 TE Connectivity
12.3.1 Company Overview
12.3.2 Financial
12.3.3 Products/ Services Offered
12.3.4 SWOT Analysis
12.4 Molex
12.4.1 Company Overview
12.4.2 Financial
12.4.3 Products/ Services Offered
12.4.4 SWOT Analysis
12.5 JAE
12.5.1 Company Overview
12.5.2 Financial
12.5.3 Products/ Services Offered
12.5.4 SWOT Analysis
12.6 Hirose Electric,
12.6.1 Company Overview
12.6.2 Financial
12.6.3 Products/ Services Offered
12.6.4 SWOT Analysis
12.7 Hirose Electric
12.7.1 Company Overview
12.7.2 Financial
12.7.3 Products/ Services Offered
12.7.4 SWOT Analysis
12.8 Sumitomo Electric
12.8.1 Company Overview
12.8.2 Financial
12.8.3 Products/ Services Offered
12.8.4 SWOT Analysis
12.9 APTIV
12.9.1 Company Overview
12.9.2 Financial
12.9.3 Products/ Services Offered
12.9.4 SWOT Analysis
12.10 Radiall
12.10.1 Company Overview
12.10.2 Financial
12.10.3 Products/ Services Offered
12.10.4 SWOT Analysis
12. Use Cases and Best Practices
13. Conclusion
An accurate research report requires proper strategizing as well as implementation. There are multiple factors involved in the completion of good and accurate research report and selecting the best methodology to compete the research is the toughest part. Since the research reports we provide play a crucial role in any company’s decision-making process, therefore we at SNS Insider always believe that we should choose the best method which gives us results closer to reality. This allows us to reach at a stage wherein we can provide our clients best and accurate investment to output ratio.
Each report that we prepare takes a timeframe of 350-400 business hours for production. Starting from the selection of titles through a couple of in-depth brain storming session to the final QC process before uploading our titles on our website we dedicate around 350 working hours. The titles are selected based on their current market cap and the foreseen CAGR and growth.
The 5 steps process:
Step 1: Secondary Research:
Secondary Research or Desk Research is as the name suggests is a research process wherein, we collect data through the readily available information. In this process we use various paid and unpaid databases which our team has access to and gather data through the same. This includes examining of listed companies’ annual reports, Journals, SEC filling etc. Apart from this our team has access to various associations across the globe across different industries. Lastly, we have exchange relationships with various university as well as individual libraries.
Step 2: Primary Research
When we talk about primary research, it is a type of study in which the researchers collect relevant data samples directly, rather than relying on previously collected data. This type of research is focused on gaining content specific facts that can be sued to solve specific problems. Since the collected data is fresh and first hand therefore it makes the study more accurate and genuine.
We at SNS Insider have divided Primary Research into 2 parts.
Part 1 wherein we interview the KOLs of major players as well as the upcoming ones across various geographic regions. This allows us to have their view over the market scenario and acts as an important tool to come closer to the accurate market numbers. As many as 45 paid and unpaid primary interviews are taken from both the demand and supply side of the industry to make sure we land at an accurate judgement and analysis of the market.
This step involves the triangulation of data wherein our team analyses the interview transcripts, online survey responses and observation of on filed participants. The below mentioned chart should give a better understanding of the part 1 of the primary interview.
Part 2: In this part of primary research the data collected via secondary research and the part 1 of the primary research is validated with the interviews from individual consultants and subject matter experts.
Consultants are those set of people who have at least 12 years of experience and expertise within the industry whereas Subject Matter Experts are those with at least 15 years of experience behind their back within the same space. The data with the help of two main processes i.e., FGDs (Focused Group Discussions) and IDs (Individual Discussions). This gives us a 3rd party nonbiased primary view of the market scenario making it a more dependable one while collation of the data pointers.
Step 3: Data Bank Validation
Once all the information is collected via primary and secondary sources, we run that information for data validation. At our intelligence centre our research heads track a lot of information related to the market which includes the quarterly reports, the daily stock prices, and other relevant information. Our data bank server gets updated every fortnight and that is how the information which we collected using our primary and secondary information is revalidated in real time.
Step 4: QA/QC Process
After all the data collection and validation our team does a final level of quality check and quality assurance to get rid of any unwanted or undesired mistakes. This might include but not limited to getting rid of the any typos, duplication of numbers or missing of any important information. The people involved in this process include technical content writers, research heads and graphics people. Once this process is completed the title gets uploader on our platform for our clients to read it.
Step 5: Final QC/QA Process:
This is the last process and comes when the client has ordered the study. In this process a final QA/QC is done before the study is emailed to the client. Since we believe in giving our clients a good experience of our research studies, therefore, to make sure that we do not lack at our end in any way humanly possible we do a final round of quality check and then dispatch the study to the client.
Key Segments:
By Type
Ordinary FAKRA
Mini FAKRA
By Connector Type
FAKRA SMB connectors
FAKRA II connectors
FAKRA HSD connectors
Other connector types
By End-use Industry
Automotive
Aerospace and defense
Consumer electronics
Telecommunications
Other industries
Request for Segment Customization as per your Business Requirement: Segment Customization Request
Regional Coverage:
North America
US
Canada
Mexico
Europe
Germany
France
UK
Italy
Spain
Poland
Turkey
Rest of Europe
Asia Pacific
China
India
Japan
South Korea
Singapore
Australia
Taiwan
Rest of Asia Pacific
Middle East & Africa
UAE
Saudi Arabia
Qatar
South Africa
Rest of Middle East & Africa
Latin America
Brazil
Argentina
Rest of Latin America
Request for Country Level Research Report: Country Level Customization Request
Available Customization
With the given market data, SNS Insider offers customization as per the company’s specific needs. The following customization options are available for the report:
Detailed Volume Analysis
Criss-Cross segment analysis (e.g. Product X Application)
Competitive Product Benchmarking
Geographic Analysis
Additional countries in any of the regions
Customized Data Representation
Detailed analysis and profiling of additional market players