Get more information on Volatile Organic Compound Gas Sensor Market - Request Free Sample Report
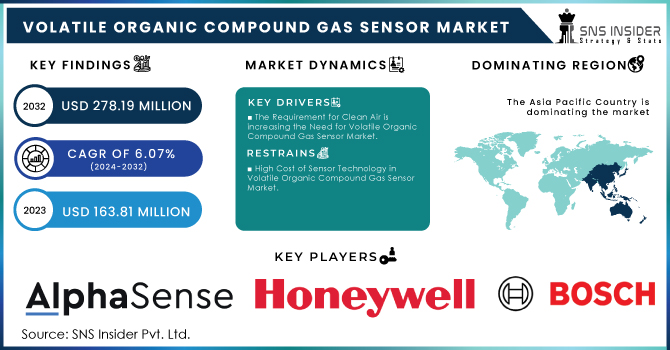
The Volatile Organic Compound Gas Sensor Market Size was valued at USD 163.81 million in 2023, and is expected to reach USD 278.19 million by 2032, and grow at a CAGR of 6.07% over the forecast period 2024-2032.
The increasing use of VOC gas sensors in various sectors is mainly driven by the growing enforcement of strict regulations by government agencies. Organizations like the EPA and MSHA have played a crucial role in pushing this trend forward. In the United States, the Environmental Protection Agency (EPA) monitors VOC regulation through 40 CFR 59, establishing nationwide emission standards for consumer and commercial goods. Additionally, in January 2022, Canada enacted regulations on limits for volatile organic compound concentrations in specific products. These rules require importers and manufacturers to follow precise VOC concentration restrictions in 130 different product categories. Regulatory attention has been specifically on the oil and gas industry. In July 2023, the EPA suggested major alterations to the industry's greenhouse gas emission reporting standards. If approved, these changes will appear in the 2025 reports and must be submitted by March 2026.Moreover, the EPA's recent regulation from December 2023 focused on reducing methane and VOC emissions in the oil and gas industry by establishing new source performance standards (NSPS) for new or updated sources, as well as emission guidelines for states to adhere to with regards to existing sources. In January 2024, the EPA proposed the Waste Emission Charge (WEC) as an additional incentive for reducing methane emissions. This fee imposed on surplus methane releases in the oil and gas industry is meant to prevent pollution and incentivize reductions in emissions. The fee will rise in the coming years, beginning at USD 900 per metric ton in 2024 and escalating to USD 1,500 per ton in 2026.The combined effect of these rules has led to an increased need for VOC gas sensors as industries work to meet environmental regulations and reduce emissions.
The VOC gas sensor market is experiencing rapid growth fueled by its integration with IoT technology. This synergy enables real-time air quality monitoring and control, expanding sensor applications across various sectors. Advancements in sensing materials have enhanced detection capabilities, exemplified by Sensirion AG's SGP41 sensor, which combines VOC and NOx detection with smart switch functionality. While supply chain challenges hindered IoT growth in 2023, the industry is poised for resurgence with 5G adoption, intelligent data analysis, and increased semiconductor production driving lower device costs. Key factors propelling the VOC gas sensor market include AI integration for enhanced data analysis, expanded connectivity for real-time monitoring, decreasing component costs for wider adoption, and technological advancements in computer architecture, chip design, and memory. As IoT matures, the demand for air quality monitoring, early warning systems, and smart city applications will drive the VOC gas sensor market, leading to more sophisticated solutions for environmental and human health challenges. The projected 27 billion connected IoT devices by 2025 underscore the immense potential of IoT to revolutionize industries and improve quality of life.
Drivers
The Requirement for Clean Air is increasing the Need for Volatile Organic Compound Gas Sensor Market
The growing global focus on air quality is a powerful motivator for the VOC gas sensor sector. As awareness grows about the health risks associated with poor air quality, individuals and businesses are placing greater emphasis on enhancing environmental health indoors and outdoors. This rise in awareness has caused a greater demand for reliable air quality monitoring choices, pushing the utilization of VOC gas sensors in residential, commercial, and industrial sectors. Moreover, ongoing media coverage and health campaigns have raised the importance of air quality, creating a favorable environment for the expansion of the sensor market. Therefore, manufacturers are driven to develop updated, user-friendly, and affordable VOC gas detectors to meet the growing demand and encourage better living and working environments. The AQS, previously known as AIRS, is where the EPA stores information about ambient air quality in the United States. AQS holds information from more than 10,000 monitors, with 5,000 of them being currently in use. Air quality measures have been implemented in all 50 states, the District of Columbia, Puerto Rico, and the U.S. Virgin Islands. The release of air pollutants remains a significant factor in several air quality concerns. Around 66 million tons of pollutants were released into the air in the United States in 2022.
Regulatory Push for Methane Emissions Reduction in Volatile Organic Compound Gas Sensor Market
The growing worldwide emphasis on addressing climate change and decreasing greenhouse gas emissions is a major factor driving the demand for VOC gas sensors in the oil and gas sector. Methane, a strong contributor to climate change, plays a large role in global warming, with the oil and gas industry being a significant emitter of this gas. The increasing regulatory pressure on the industry is emphasized by the proposed methane regulations in the United States and the European Union, as shown in the data provided. These rules require enhanced supervision, identification, and fixing of methane leaks, increasing the need for sophisticated VOC gas sensors. In order to meet these regulations, companies must invest in advanced sensor technology to monitor and decrease methane emissions. The additional proposal builds upon the EPA's 2021 proposal for oil and gas methane regulations, which received over 470,000 public comments. It consists of several modifications compared to the previous edition. Furthermore, stricter methane performance standards and import requirements in the European Union may increase the demand for VOC gas sensors among gas exporters aiming to comply with the new criteria. Roughly 66 million tons of pollutants were released into the air in the United States in 2022, underscoring the critical importance of implementing efficient strategies to reduce emissions. VOC gas sensors are essential tools for the oil and gas industry to meet environmental compliance and sustainability objectives by monitoring and controlling emissions.
Restraints
High Cost of Sensor Technology in Volatile Organic Compound Gas Sensor Market
Significant financial resources are required for the creation and implementation of VOC gas sensors. The significant financial obstacles involved in developing and producing VOC gas sensors include expenses for advanced sensor technology, specialized materials, manufacturing processes, and integration into current systems. Substantial research and development investments are required to create sensors with a high level of sensitivity and specificity. Additionally, the complex production processes contribute to increased manufacturing expenses. As a result, the end product is frequently too expensive for a large number of prospective buyers, particularly in markets that prioritize affordability. This economic obstacle prevents widespread adoption and restricts the complete potential of VOC gas sensor technology.
Based on Technology, Metal oxide semiconductor (MOS) dominated the Volatile Organic Compound Gas Sensor market share with 39% in 2023. These sensors operate by sensing variations in electrical resistance when they come into contact with VOCs. MOS sensors are well-known for being cost-effective, durable, and effective at detecting different gases, making them popular in industries like automotive, petrochemical, and healthcare. Figaro Engineering Inc., Alpha Sense, and Honeywell International are major players in this sector, providing various MOS-based VOC gas sensors.
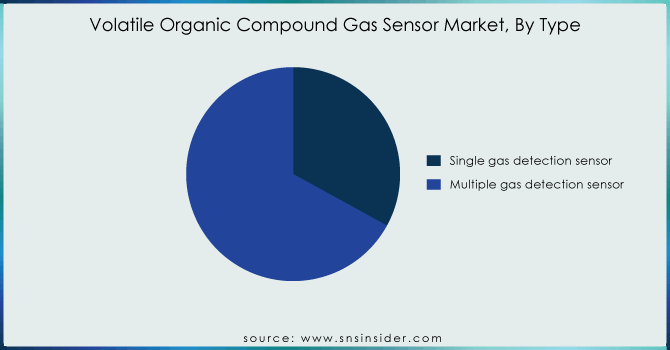
Based on Type, Multiple gas detection sensor dominated the global Volatile Organic Compound Gas Sensor market share with 67% in 2023. These portable and cost-effective devices are indispensable tools for industries like oil and gas, where they monitor pipelines for a wide range of gases including benzene, methylene chloride, and formaldehyde. Beyond leak detection, these sensors function as efficient VOC analyzers, safeguarding equipment and personnel. Employing technologies such as Metal Oxide Semiconductors (MOS), Infrared (IR) sensors, and Photoionization Detectors (PID), these sensors accurately measure VOC concentrations. Driven by stringent regulations and heightened public awareness about air pollution, the demand for multiple gas detection sensors is on the rise. Leading manufacturers such as Honeywell Analytics, Dragerwerk AG & Co. KGaA, and RKI Instruments are at the forefront of developing advanced solutions for diverse applications spanning automotive, manufacturing, and smart building management.
Get Customized Report as per your Business Requirement - Request For Customized Report
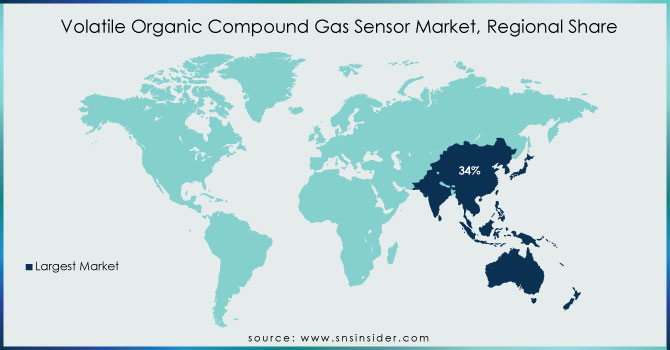
Asia Pacific is dominated the Volatile Organic Compound Gas Sensor market with a share of 34% in 2023. The increasing market is a result of the rising need for environmental and industrial monitoring solutions in the area. The area includes various developing nations like India, Japan, Australia, and Taiwan, experiencing fast urban growth and industrial development, leading to excessive air pollution and environmental decline. This increase in popularity of VOC gas sensors is due to the high demand for them in industries like automotive and manufacturing, where they are used for air quality monitoring and pollution control purposes. The VOC gas sensor market is experiencing growth due to the rising use of IoT and smart technologies in the region.
North America is fastest growing in Volatile Organic Compound Gas Sensor market with a share of 26% in 2023. The United States leads in the VOC gas sensor market. Stringent environmental rules and increased public awareness of air quality have led to a notable increase in the need for advanced VOC detection technologies. The automotive and industrial industries are making significant investments in conformity solutions. Government backing for infrastructure growth, particularly in the energy industry, has opened up significant market possibilities. The DOE's recent allocation of USD 25 million towards natural gas infrastructure advancements, such as low-cost retrofit technologies and integrated sensors, highlights the region's dedication to emission reduction and creating a positive environment for VOC gas sensor manufacturers.
Some of the major key players in Volatile Organic Compound Gas Sensor are Alpha sense ,Honeywell International Inc. ,Bosch Sensortech GmbH ,ABB Ltd. , Siemens AG ,Ion Science Ltd. ,SGX Sensortech , Renesas Electronics Corporation ,Eco Sensor , Sensirion AG ,ams AG, Figaro Engineering Inc. and others.
In May 2023, Honeywell unveiled a range of intelligent VOC gas detectors aimed at commercial and industrial uses in applications. This technology provides practical information and immediate tracking of air quality levels using cloud-based platforms and advanced analytics. The sensors are aimed at sectors like manufacturing, healthcare, and hospitality to enhance workplace safety and meet environmental regulations.
In February 2022, Sensirion released a small VOC gas sensor module designed for consumer electronics and IoT devices in The SGP40 module's high sensitivity and low power usage make it ideal for integration into wearable tech and smart home devices.
Report Attributes | Details |
Market Size in 2023 | USD 163.81 Million |
Market Size by 2032 | USD 278.19 Million |
CAGR | CAGR of 6.07% From 2024 to 2032 |
Base Year | 2023 |
Forecast Period | 2024-2032 |
Historical Data | 2020-2022 |
Report Scope & Coverage | Market Size, Segments Analysis, Competitive Landscape, Regional Analysis, DROC & SWOT Analysis, Forecast Outlook |
Key Segments | • By Technology (Photoionization detectors (PID), Metal oxide semiconductor (MOS), Electrochemical Sensors, Infrared-based Detection, Others) • By Type (Single gas detection sensor, multiple gas detection sensor) • By Application (Oil & Gas, Agriculture, Automotive, Chemical Industry, Manufacturing, Food & Beverages, Metals & Mining, Others) |
Regional Analysis/Coverage | North America (US, Canada, Mexico), Europe (Eastern Europe [Poland, Romania, Hungary, Turkey, Rest of Eastern Europe] Western Europe] Germany, France, UK, Italy, Spain, Netherlands, Switzerland, Austria, Rest of Western Europe]), Asia Pacific (China, India, Japan, South Korea, Vietnam, Singapore, Australia, Rest of Asia Pacific), Middle East & Africa (Middle East [UAE, Egypt, Saudi Arabia, Qatar, Rest of Middle East], Africa [Nigeria, South Africa, Rest of Africa], Latin America (Brazil, Argentina, Colombia, Rest of Latin America) |
Company Profiles | Alpha sense ,Honeywell International Inc. ,Bosch Sensortech GmbH ,ABB Ltd. , Siemens AG ,Ion Science Ltd. ,SGX Sensortech , Renesas Electronics Corporation ,Eco Sensor , Sensirion AG ,ams AG, Figaro Engineering Inc. and others. |
Key Drivers | • The Requirement for Clean Air is increasing the Need for Volatile Organic Compound Gas Sensor Market • Regulatory Push for Methane Emissions Reduction in Volatile Organic Compound Gas Sensor Market |
RESTRAINTS | • High Cost of Sensor Technology in Volatile Organic Compound Gas Sensor Market |
Ans. Stringent environmental regulations are the primary growth driver for the Volatile Organic Compound Gas Sensor market.
Ans. The Volatile Organic Compound Gas Sensor market Size was valued at USD 163.81 million in 2023, and is expected to reach USD 278.19 million by 2032, and grow at a CAGR of 6.07% over the forecast period 2024-2032.
Ans. North America region is to record the fastest growing in the Volatile Organic Compound Gas Sensor Market.
Ans. The Metal oxide semiconductor (MOS) is leading in the market revenue share in 2023.
Ans. Asia Pacific is to hold the largest market share in the Volatile Organic Compound Gas Sensor Market during the forecast period.
TABLE OF CONTENTS
1. Introduction
1.1 Market Definition
1.2 Scope
1.3 Research Assumptions
2. Industry Flowchart
3. Research Methodology
4. Market Dynamics
4.1 Drivers
4.2 Restraints
4.3 Opportunities
4.4 Challenges
5. Porter’s 5 Forces Model
6. Pest Analysis
7. Volatile Organic Compound Gas Sensor Market Segmentation, By Technology
7.1 Introduction
7.2 Photoionization detectors (PID)
7.3 Metal oxide semiconductor (MOS)
7.4 Electrochemical Sensors
7.5 Infrared-based Detection
7.6 Others
8. Volatile Organic Compound Gas Sensor Market Segmentation, By Type
8.1 Introduction
8.2 Single gas detection sensor
8.3 Multiple gas detection sensor
9. Volatile Organic Compound Gas Sensor Market Segmentation, By Application
9.1 Introduction
9.2 Oil & Gas
9.3 Agriculture
9.4 Automotive
9.5 Chemical Industry
9.6Manufacturing
9.7 Food & Beverages
9.8 Metals & Mining
9.9 Others
10. Regional Analysis
10.1 Introduction
10.2 North America
10.2.1 Trend Analysis
10.2.2 North America Volatile Organic Compound Gas Sensor Market by Country
10.2.3 North America Volatile Organic Compound Gas Sensor Market By Technology
10.2.4 North America Volatile Organic Compound Gas Sensor Market By Type
10.2.5 North America Volatile Organic Compound Gas Sensor Market By Application
10.2.6 USA
10.2.6.1 USA Volatile Organic Compound Gas Sensor Market By Technology
10.2.6.2 USA Volatile Organic Compound Gas Sensor Market By Type
10.2.6.3 USA Volatile Organic Compound Gas Sensor Market By Application
10.2.7 Canada
10.2.7.1 Canada Volatile Organic Compound Gas Sensor Market By Technology
10.2.7.2 Canada Volatile Organic Compound Gas Sensor Market By Type
10.2.7.3 Canada Volatile Organic Compound Gas Sensor Market By Application
10.2.8 Mexico
10.2.8.1 Mexico Volatile Organic Compound Gas Sensor Market By Technology
10.2.8.2 Mexico Volatile Organic Compound Gas Sensor Market By Type
10.2.8.3 Mexico Volatile Organic Compound Gas Sensor Market By Application
10.3 Europe
10.3.1 Trend Analysis
10.3.2 Eastern Europe
10.3.2.1 Eastern Europe Volatile Organic Compound Gas Sensor Market by Country
10.3.2.2 Eastern Europe Volatile Organic Compound Gas Sensor Market By Technology
10.3.2.3 Eastern Europe Volatile Organic Compound Gas Sensor Market By Type
10.3.2.4 Eastern Europe Volatile Organic Compound Gas Sensor Market By Application
10.3.2.5 Poland
10.3.2.5.1 Poland Volatile Organic Compound Gas Sensor Market By Technology
10.3.2.5.2 Poland Volatile Organic Compound Gas Sensor Market By Type
10.3.2.5.3 Poland Volatile Organic Compound Gas Sensor Market By Application
10.3.2.6 Romania
10.3.2.6.1 Romania Volatile Organic Compound Gas Sensor Market By Technology
10.3.2.6.2 Romania Volatile Organic Compound Gas Sensor Market By Type
10.3.2.6.4 Romania Volatile Organic Compound Gas Sensor Market By Application
10.3.2.7 Hungary
10.3.2.7.1 Hungary Volatile Organic Compound Gas Sensor Market By Technology
10.3.2.7.2 Hungary Volatile Organic Compound Gas Sensor Market By Type
10.3.2.7.3 Hungary Volatile Organic Compound Gas Sensor Market By Application
10.3.2.8 Turkey
10.3.2.8.1 Turkey Volatile Organic Compound Gas Sensor Market By Technology
10.3.2.8.2 Turkey Volatile Organic Compound Gas Sensor Market By Type
10.3.2.8.3 Turkey Volatile Organic Compound Gas Sensor Market By Application
10.3.2.9 Rest of Eastern Europe
10.3.2.9.1 Rest of Eastern Europe Volatile Organic Compound Gas Sensor Market By Technology
10.3.2.9.2 Rest of Eastern Europe Volatile Organic Compound Gas Sensor Market By Type
10.3.2.9.3 Rest of Eastern Europe Volatile Organic Compound Gas Sensor Market By Application
10.3.3 Western Europe
10.3.3.1 Western Europe Volatile Organic Compound Gas Sensor Market by Country
10.3.3.2 Western Europe Volatile Organic Compound Gas Sensor Market By Technology
10.3.3.3 Western Europe Volatile Organic Compound Gas Sensor Market By Type
10.3.3.4 Western Europe Volatile Organic Compound Gas Sensor Market By Application
10.3.3.5 Germany
10.3.3.5.1 Germany Volatile Organic Compound Gas Sensor Market By Technology
10.3.3.5.2 Germany Volatile Organic Compound Gas Sensor Market By Type
10.3.3.5.3 Germany Volatile Organic Compound Gas Sensor Market By Application
10.3.3.6 France
10.3.3.6.1 France Volatile Organic Compound Gas Sensor Market By Technology
10.3.3.6.2 France Volatile Organic Compound Gas Sensor Market By Type
10.3.3.6.3 France Volatile Organic Compound Gas Sensor Market By Application
10.3.3.7 UK
10.3.3.7.1 UK Volatile Organic Compound Gas Sensor Market By Technology
10.3.3.7.2 UK Volatile Organic Compound Gas Sensor Market By Type
10.3.3.7.3 UK Volatile Organic Compound Gas Sensor Market By Application
10.3.3.8 Italy
10.3.3.8.1 Italy Volatile Organic Compound Gas Sensor Market By Technology
10.3.3.8.2 Italy Volatile Organic Compound Gas Sensor Market By Type
10.3.3.8.3 Italy Volatile Organic Compound Gas Sensor Market By Application
10.3.3.9 Spain
10.3.3.9.1 Spain Volatile Organic Compound Gas Sensor Market By Technology
10.3.3.9.2 Spain Volatile Organic Compound Gas Sensor Market By Type
10.3.3.9.3 Spain Volatile Organic Compound Gas Sensor Market By Application
10.3.3.10 Netherlands
10.3.3.10.1 Netherlands Volatile Organic Compound Gas Sensor Market By Technology
10.3.3.10.2 Netherlands Volatile Organic Compound Gas Sensor Market By Type
10.3.3.10.3 Netherlands Volatile Organic Compound Gas Sensor Market By Application
10.3.3.11 Switzerland
10.3.3.11.1 Switzerland Volatile Organic Compound Gas Sensor Market By Technology
10.3.3.11.2 Switzerland Volatile Organic Compound Gas Sensor Market By Type
10.3.3.11.3 Switzerland Volatile Organic Compound Gas Sensor Market By Application
10.3.3.12 Austria
10.3.3.12.1 Austria Volatile Organic Compound Gas Sensor Market By Technology
10.3.3.12.2 Austria Volatile Organic Compound Gas Sensor Market By Type
10.3.3.12.3 Austria Volatile Organic Compound Gas Sensor Market By Application
10.3.3.13 Rest of Western Europe
10.3.3.13.1 Rest of Western Europe Volatile Organic Compound Gas Sensor Market By Technology
10.3.3.13.2 Rest of Western Europe Volatile Organic Compound Gas Sensor Market By Type
10.3.3.13.3 Rest of Western Europe Volatile Organic Compound Gas Sensor Market By Application
10.4 Asia-Pacific
10.4.1 Trend Analysis
10.4.2 Asia-Pacific Volatile Organic Compound Gas Sensor Market by Country
10.4.3 Asia-Pacific Volatile Organic Compound Gas Sensor Market By Technology
10.4.4 Asia-Pacific Volatile Organic Compound Gas Sensor Market By Type
10.4.5 Asia-Pacific Volatile Organic Compound Gas Sensor Market By Application
10.4.6 China
10.4.6.1 China Volatile Organic Compound Gas Sensor Market By Technology
10.4.6.2 China Volatile Organic Compound Gas Sensor Market By Type
10.4.6.3 China Volatile Organic Compound Gas Sensor Market By Application
10.4.7 India
10.4.7.1 India Volatile Organic Compound Gas Sensor Market By Technology
10.4.7.2 India Volatile Organic Compound Gas Sensor Market By Type
10.4.7.3 India Volatile Organic Compound Gas Sensor Market By Application
10.4.8 Japan
10.4.8.1 Japan Volatile Organic Compound Gas Sensor Market By Technology
10.4.8.2 Japan Volatile Organic Compound Gas Sensor Market By Type
10.4.8.3 Japan Volatile Organic Compound Gas Sensor Market By Application
10.4.9 South Korea
10.4.9.1 South Korea Volatile Organic Compound Gas Sensor Market By Technology
10.4.9.2 South Korea Volatile Organic Compound Gas Sensor Market By Type
10.4.9.3 South Korea Volatile Organic Compound Gas Sensor Market By Application
10.4.10 Vietnam
10.4.10.1 Vietnam Volatile Organic Compound Gas Sensor Market By Technology
10.4.10.2 Vietnam Volatile Organic Compound Gas Sensor Market By Type
10.4.10.3 Vietnam Volatile Organic Compound Gas Sensor Market By Application
10.4.11 Singapore
10.4.11.1 Singapore Volatile Organic Compound Gas Sensor Market By Technology
10.4.11.2 Singapore Volatile Organic Compound Gas Sensor Market By Type
10.4.11.3 Singapore Volatile Organic Compound Gas Sensor Market By Application
10.4.12 Australia
10.4.12.1 Australia Volatile Organic Compound Gas Sensor Market By Technology
10.4.12.2 Australia Volatile Organic Compound Gas Sensor Market By Type
10.4.12.3 Australia Volatile Organic Compound Gas Sensor Market By Application
10.4.13 Rest of Asia-Pacific
10.4.13.1 Rest of Asia-Pacific Volatile Organic Compound Gas Sensor Market By Technology
10.4.13.2 Rest of Asia-Pacific Volatile Organic Compound Gas Sensor Market By Type
10.4.13.3 Rest of Asia-Pacific Volatile Organic Compound Gas Sensor Market By Application
10.5 Middle East & Africa
10.5.1 Trend Analysis
10.5.2 Middle East
10.5.2.1 Middle East Volatile Organic Compound Gas Sensor Market by Country
10.5.2.2 Middle East Volatile Organic Compound Gas Sensor Market By Technology
10.5.2.3 Middle East Volatile Organic Compound Gas Sensor Market By Type
10.5.2.4 Middle East Volatile Organic Compound Gas Sensor Market By Application
10.5.2.5 UAE
10.5.2.5.1 UAE Volatile Organic Compound Gas Sensor Market By Technology
10.5.2.5.2 UAE Volatile Organic Compound Gas Sensor Market By Type
10.5.2.5.3 UAE Volatile Organic Compound Gas Sensor Market By Application
10.5.2.6 Egypt
10.5.2.6.1 Egypt Volatile Organic Compound Gas Sensor Market By Technology
10.5.2.6.2 Egypt Volatile Organic Compound Gas Sensor Market By Type
10.5.2.6.3 Egypt Volatile Organic Compound Gas Sensor Market By Application
10.5.2.7 Saudi Arabia
10.5.2.7.1 Saudi Arabia Volatile Organic Compound Gas Sensor Market By Technology
10.5.2.7.2 Saudi Arabia Volatile Organic Compound Gas Sensor Market By Type
10.5.2.7.3 Saudi Arabia Volatile Organic Compound Gas Sensor Market By Application
10.5.2.8 Qatar
10.5.2.8.1 Qatar Volatile Organic Compound Gas Sensor Market By Technology
10.5.2.8.2 Qatar Volatile Organic Compound Gas Sensor Market By Type
10.5.2.8.3 Qatar Volatile Organic Compound Gas Sensor Market By Application
10.5.2.9 Rest of Middle East
10.5.2.9.1 Rest of Middle East Volatile Organic Compound Gas Sensor Market By Technology
10.5.2.9.2 Rest of Middle East Volatile Organic Compound Gas Sensor Market By Type
10.5.2.9.3 Rest of Middle East Volatile Organic Compound Gas Sensor Market By Application
10.5.3 Africa
10.5.3.1 Africa Volatile Organic Compound Gas Sensor Market by Country
10.5.3.2 Africa Volatile Organic Compound Gas Sensor Market By Technology
10.5.3.3 Africa Volatile Organic Compound Gas Sensor Market By Type
10.5.3.4 Africa Volatile Organic Compound Gas Sensor Market By Application
10.5.3.5 Nigeria
10.5.3.5.1 Nigeria Volatile Organic Compound Gas Sensor Market By Technology
10.5.3.5.2 Nigeria Volatile Organic Compound Gas Sensor Market By Type
10.5.3.5.3 Nigeria Volatile Organic Compound Gas Sensor Market By Application
10.5.3.6 South Africa
10.5.3.6.1 South Africa Volatile Organic Compound Gas Sensor Market By Technology
10.5.3.6.2 South Africa Volatile Organic Compound Gas Sensor Market By Type
10.5.3.6.3 South Africa Volatile Organic Compound Gas Sensor Market By Application
10.5.3.7 Rest of Africa
10.5.3.7.1 Rest of Africa Volatile Organic Compound Gas Sensor Market By Technology
10.5.3.7.2 Rest of Africa Volatile Organic Compound Gas Sensor Market By Type
10.5.3.7.3 Rest of Africa Volatile Organic Compound Gas Sensor Market By Application
10.6 Latin America
10.6.1 Trend Analysis
10.6.2 Latin America Volatile Organic Compound Gas Sensor Market by country
10.6.3 Latin America Volatile Organic Compound Gas Sensor Market By Technology
10.6.4 Latin America Volatile Organic Compound Gas Sensor Market By Type
10.6.5 Latin America Volatile Organic Compound Gas Sensor Market By Application
10.6.6 Brazil
10.6.6.1 Brazil Volatile Organic Compound Gas Sensor Market By Technology
10.6.6.2 Brazil Volatile Organic Compound Gas Sensor Market By Type
10.6.6.3 Brazil Volatile Organic Compound Gas Sensor Market By Application
10.6.7 Argentina
10.6.7.1 Argentina Volatile Organic Compound Gas Sensor Market By Technology
10.6.7.2 Argentina Volatile Organic Compound Gas Sensor Market By Type
10.6.7.3 Argentina Volatile Organic Compound Gas Sensor Market By Application
10.6.8 Colombia
10.6.8.1 Colombia Volatile Organic Compound Gas Sensor Market By Technology
10.6.8.2 Colombia Volatile Organic Compound Gas Sensor Market By Type
10.6.8.3 Colombia Volatile Organic Compound Gas Sensor Market By Application
10.6.9 Rest of Latin America
10.6.9.1 Rest of Latin America Volatile Organic Compound Gas Sensor Market By Technology
10.6.9.2 Rest of Latin America Volatile Organic Compound Gas Sensor Market By Type
10.6.9.3 Rest of Latin America Volatile Organic Compound Gas Sensor Market By Application
11. Company Profiles
11.1 Alpha sense
11.1.1 Company Overview
11.1.2 Financial
11.1.3 Products/ Services Offered
11.1.4 The SNS View
11.2 Honeywell International Inc.
11.2.1 Company Overview
11.2.2 Financial
11.2.3 Products/ Services Offered
11.2.4 The SNS View
11.3 Bosch Sensortech GmbH
11.3.1 Company Overview
11.3.2 Financial
11.3.3 Products/ Services Offered
11.3.4 The SNS View
11.4 ABB Ltd.
11.4.1 Company Overview
11.4.2 Financial
11.4.3 Products/ Services Offered
11.4.4 The SNS View
11.5 Siemens AG
11.5.1 Company Overview
11.5.2 Financial
11.5.3 Products/ Services Offered
11.5.4 The SNS View
11.6 Ion Science Ltd.
11.6.1 Company Overview
11.6.2 Financial
11.6.3 Products/ Services Offered
11.6.4 The SNS View
11.7 SGX Sensortech
11.7.1 Company Overview
11.7.2 Financial
11.7.3 Products/ Services Offered
11.7.4 The SNS View
11.8 Renesas Electronics Corporation
11.8.1 Company Overview
11.8.2 Financial
11.8.3 Products/ Services Offered
11.8.4 The SNS View
11.9 Eco Sensor
11.9.1 Company Overview
11.9.2 Financial
11.9.3 Products/ Services Offered
11.9.4 The SNS View
11.10 Sensirion AG
11.10.1 Company Overview
11.10.2 Financial
11.10.3 Products/ Services Offered
11.10.4 The SNS View
12. Competitive Landscape
12.1 Competitive Benchmarking
12.2 Market Share Analysis
12.3 Recent Developments
12.3.1 Industry News
12.3.2 Company News
12.3.3 Mergers & Acquisitions
13. Use Case and Best Practices
14. Conclusion
An accurate research report requires proper strategizing as well as implementation. There are multiple factors involved in the completion of good and accurate research report and selecting the best methodology to compete the research is the toughest part. Since the research reports we provide play a crucial role in any company’s decision-making process, therefore we at SNS Insider always believe that we should choose the best method which gives us results closer to reality. This allows us to reach at a stage wherein we can provide our clients best and accurate investment to output ratio.
Each report that we prepare takes a timeframe of 350-400 business hours for production. Starting from the selection of titles through a couple of in-depth brain storming session to the final QC process before uploading our titles on our website we dedicate around 350 working hours. The titles are selected based on their current market cap and the foreseen CAGR and growth.
The 5 steps process:
Step 1: Secondary Research:
Secondary Research or Desk Research is as the name suggests is a research process wherein, we collect data through the readily available information. In this process we use various paid and unpaid databases which our team has access to and gather data through the same. This includes examining of listed companies’ annual reports, Journals, SEC filling etc. Apart from this our team has access to various associations across the globe across different industries. Lastly, we have exchange relationships with various university as well as individual libraries.
Step 2: Primary Research
When we talk about primary research, it is a type of study in which the researchers collect relevant data samples directly, rather than relying on previously collected data. This type of research is focused on gaining content specific facts that can be sued to solve specific problems. Since the collected data is fresh and first hand therefore it makes the study more accurate and genuine.
We at SNS Insider have divided Primary Research into 2 parts.
Part 1 wherein we interview the KOLs of major players as well as the upcoming ones across various geographic regions. This allows us to have their view over the market scenario and acts as an important tool to come closer to the accurate market numbers. As many as 45 paid and unpaid primary interviews are taken from both the demand and supply side of the industry to make sure we land at an accurate judgement and analysis of the market.
This step involves the triangulation of data wherein our team analyses the interview transcripts, online survey responses and observation of on filed participants. The below mentioned chart should give a better understanding of the part 1 of the primary interview.
Part 2: In this part of primary research the data collected via secondary research and the part 1 of the primary research is validated with the interviews from individual consultants and subject matter experts.
Consultants are those set of people who have at least 12 years of experience and expertise within the industry whereas Subject Matter Experts are those with at least 15 years of experience behind their back within the same space. The data with the help of two main processes i.e., FGDs (Focused Group Discussions) and IDs (Individual Discussions). This gives us a 3rd party nonbiased primary view of the market scenario making it a more dependable one while collation of the data pointers.
Step 3: Data Bank Validation
Once all the information is collected via primary and secondary sources, we run that information for data validation. At our intelligence centre our research heads track a lot of information related to the market which includes the quarterly reports, the daily stock prices, and other relevant information. Our data bank server gets updated every fortnight and that is how the information which we collected using our primary and secondary information is revalidated in real time.
Step 4: QA/QC Process
After all the data collection and validation our team does a final level of quality check and quality assurance to get rid of any unwanted or undesired mistakes. This might include but not limited to getting rid of the any typos, duplication of numbers or missing of any important information. The people involved in this process include technical content writers, research heads and graphics people. Once this process is completed the title gets uploader on our platform for our clients to read it.
Step 5: Final QC/QA Process:
This is the last process and comes when the client has ordered the study. In this process a final QA/QC is done before the study is emailed to the client. Since we believe in giving our clients a good experience of our research studies, therefore, to make sure that we do not lack at our end in any way humanly possible we do a final round of quality check and then dispatch the study to the client.
Key Segments:
By Technology
Photoionization detectors (PID)
Metal oxide semiconductor (MOS)
Electrochemical Sensors
Infrared-based Detection
Others
By Type
Single gas detection sensor
Multiple gas detection sensor
By Application
Oil & Gas
Agriculture
Automotive
Chemical Industry
Manufacturing
Food & Beverages
Metals & Mining
Others
Request for Segment Customization as per your Business Requirement: Segment Customization Request
REGIONAL COVERAGE:
North America
US
Canada
Mexico
Europe
Eastern Europe
Poland
Romania
Hungary
Turkey
Rest of Eastern Europe
Western Europe
Germany
France
UK
Italy
Spain
Netherlands
Switzerland
Austria
Rest of Western Europe
Asia Pacific
China
India
Japan
South Korea
Vietnam
Singapore
Australia
Rest of Asia Pacific
Middle East & Africa
Middle East
UAE
Egypt
Saudi Arabia
Qatar
Rest of the Middle East
Africa
Nigeria
South Africa
Rest of Africa
Latin America
Brazil
Argentina
Colombia
Request for Country Level Research Report: Country Level Customization Request
Available Customization
With the given market data, SNS Insider offers customization as per the company’s specific needs. The following customization options are available for the report:
Product Analysis
Criss-Cross segment analysis (e.g. Product X Application)
Product Matrix which gives a detailed comparison of product portfolio of each company
Geographic Analysis
Additional countries in any of the regions
Company Information
Detailed analysis and profiling of additional market players (Up to five)
The Head Mounted 3D Displays Market size was valued at USD 7.43 billion in 2022 and is expected to reach at USD 130.06 billion by 2030 and grow at a CAGR of 43% over the forecast period of 2023-2030
The Power Rental Market size was valued at USD 11.00 Billion in 2023. It is estimated to reach USD 19.28 Billion by 2032, growing at a CAGR of 6.45% during 2024-2032.
The Total Station Market Size was valued at USD 1.77 billion in 2022 and is expected to reach USD 2.89 billion by 2030, growing at a CAGR of 6.3% over the forecast period 2023-2030.
Static Random-Access Memory Market size was valued at USD 0.6 billion in 2022 and is expected to grow to USD 0.85 billion by 2030 and grow at a CAGR of 4.46% over the forecast period of 2023-2030.
The OLED-on-Silicon (OLEDoS) Market Size was valued at USD 0.41 Billion in 2023 and is expected to reach USD 5.92 Billion at 34.54% CAGR, During 2024-2032
The Electronic Manufacturing Services Market Size was valued at USD 553.51 Billion in 2023, growing at a CAGR of 5.55% During Forecast 2024-2032
Hi! Click one of our member below to chat on Phone