Tablet Application Processor Market Report Scope and Overview:
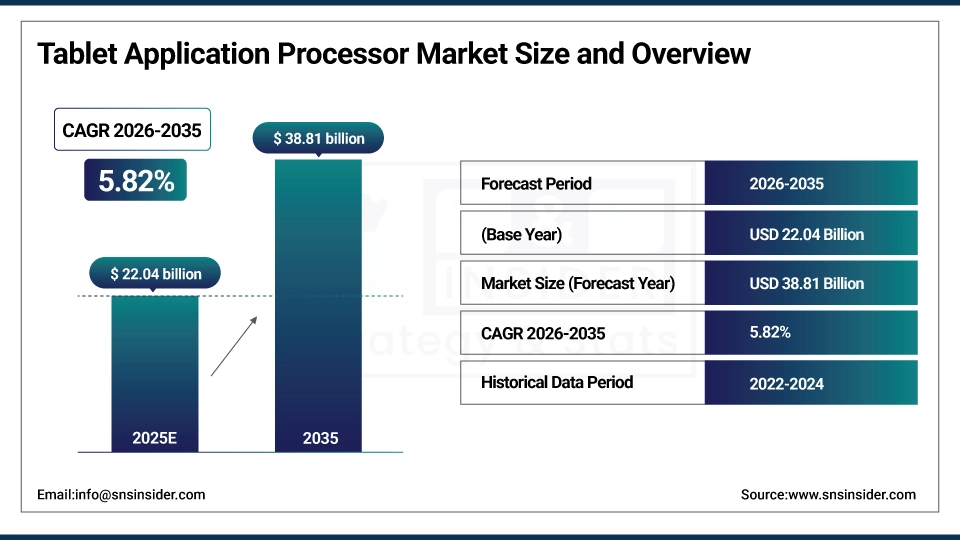
The Tablet Application Processor Market Size was valued at USD 22.04 billion in 2025 and is expected to reach USD 38.81 billion by 2035 and grow at a CAGR of 5.82% over the forecast period 2026-2035.
The world tablet market is growing with the increasing adoption of high-performance tablets in education, entertainment and enterprise solutions. Higher processing speed, enhanced power saving, and implementation of artificial intelligence capabilities in APs are some of the important forces driving the market growth across the globe. Rising consumer demand for smooth multitasking as well as high performance is likewise stoking the rapid penetration of higher end tablet processors.
According to research, more than 68% of new tablets featured AI-capable application processors, enabling functions, such as intelligent image processing and voice recognition.
Tablet Application Processor Market Size and Forecast:
-
Market Size in 2025: USD 22.04 Billion
-
Market Size by 2035: USD 38.81 Billion
-
CAGR: 5.82% from 2026 to 2035
-
Base Year: 2025
-
Forecast Period: 2026–2035
-
Historical Data: 2022–2024
To Get More Information On Tablet Application Processor Market - Request Free Sample Report
Tablet Application Processor Market Highlights:
-
Samsung announced the Galaxy Tab A11 and A11+ tablets with enhanced performance, up to 18 percent higher application processor performance, larger memory and storage options, and expandable storage up to 2 TB aimed at everyday entertainment and productivity segments
-
The Tab A11+ incorporates AI tools powered by Google Gemini and Samsung DeX support, emphasizing intelligent experiences and multitasking on tablets
-
Samsung unveiled the Galaxy Tab S11 and S11 Ultra lineup at IFA Berlin featuring the MediaTek Dimensity 9400+ application processor delivering significant CPU, GPU, and NPU performance improvements
-
Samsung is increasingly relying on MediaTek Dimensity chips for its flagship tablets rather than Qualcomm Snapdragon processors marking a strategic adjustment in its application processor partnerships
-
The Galaxy Tab S11 series faced criticism for launching with the Dimensity 9400+ just as newer MediaTek chips were about to release raising concerns about timing and competitiveness
-
Samsung continues to position its tablets in premium and midrange segments combining powerful application processors with sleek designs and productivity features while facing pressure from chipset update cycles and rival offerings
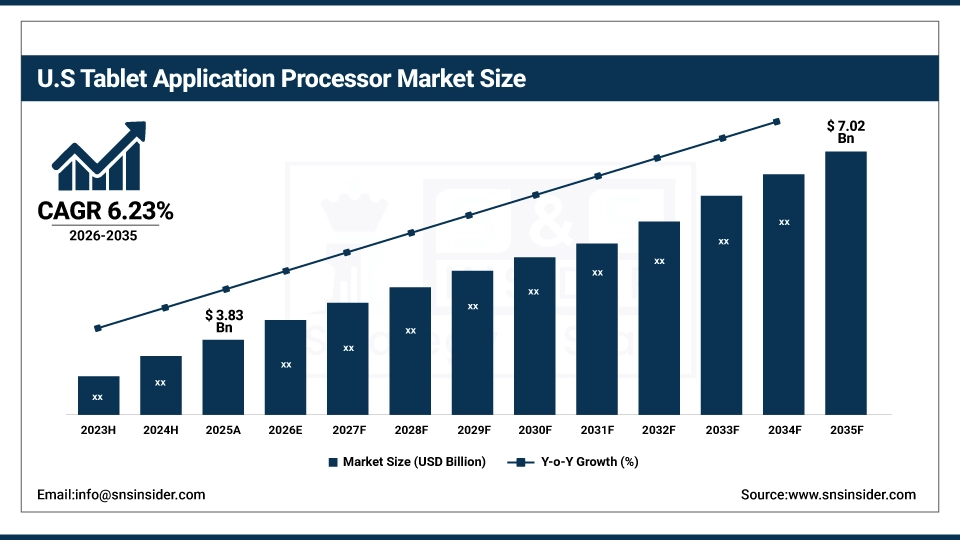
The U.S. Tablet Application Processor Market size was USD 3.83 billion in 2025 and is expected to reach USD 7.02 billion by 2035, growing at a CAGR of 6.23 % over the forecast period of 2026–2035.The U.S. tablet application processor market growth is attributed to the increasing consumer preference for tablets in education and remote work, growing adoption of high-end processors providing for better multitasking and battery efficiency. Moreover, technological advancements, and the presence of leading chip manufacturers are also boosting the growth in the U.S. market.
According to research, as of 2024, over 60% of K–12 schools in the U.S. deployed tablets for digital learning, supported by federal and state-level funding programs.
Tablet Application Processor Market Drivers:
-
Growing Adoption of Tablets in Education and Enterprise Sectors Fuels Processor Demand
Move to digital learning tools in the education sector, and growing adoption of tablets as mobile workforce solutions by enterprises will drive demand for tablet application processors. These processors would need to be secure, connected and power-optimized to fulfill institutional requirements. The increasing use of tablets for remote learning and work-from-home access boosts the market growth globally. Moreover, growing government support for digital education and rise in demand for real time collaboration tools in multiple organizations also act as drivers for the enhanced processors in tablet.
A McKinsey survey in 2023 found that 82% of companies adopted hybrid or remote work models, contributing to a 15% increase in tablet usage across home-based work environments.
Tablet Application Processor Market Restraints:
-
Supply Chain Disruptions and Semiconductor Shortages Affect Market Growth
Tablet Application Processors are becoming increasingly difficult to maintain with continuous availability, as the global semiconductor supply chain breaks down due to shortages of raw materials. Production bottlenecks and rising costs for components prevent manufacturers from quickly responding to growing demand. These things combine to slow the market and reduces new tablets with the latest CPUs coming to market. Compounded by geopolitical challenges, tight foundry capacity, and stretched lead times for critical components, the latency between innovations has increased, and private production scalability has become increasingly more challenging for next-gen processor technologies.
Tablet Application Processor Market Opportunities:
-
Integration of AI and Machine Learning Capabilities in Tablet Processors Opens New Market Frontiers
AI and machine learning integration in tablet chips is another possibility that should enable new types of user experiences, such as voice recognition, real-time translation, and real-time personalisation. This movement can contribute to market growth from the healthcare, education, entertainment, and other segments, and increase the market size of premium app processors. In addition to these, the five important trends also include AI-powered features such as predictive text, smart camera, and context computing that make their respective devices smarter in general, add more value to the offerings that companies can make, and make a strong case for tablet makers to invest more into intelligent processing.
According to research, in 2024, over 40% of healthcare apps and 35% of education platforms were optimized for AI-driven features such as voice interaction and adaptive learning on tablet devices.
Tablet Application Processor Market Segment Analysis:
By Type
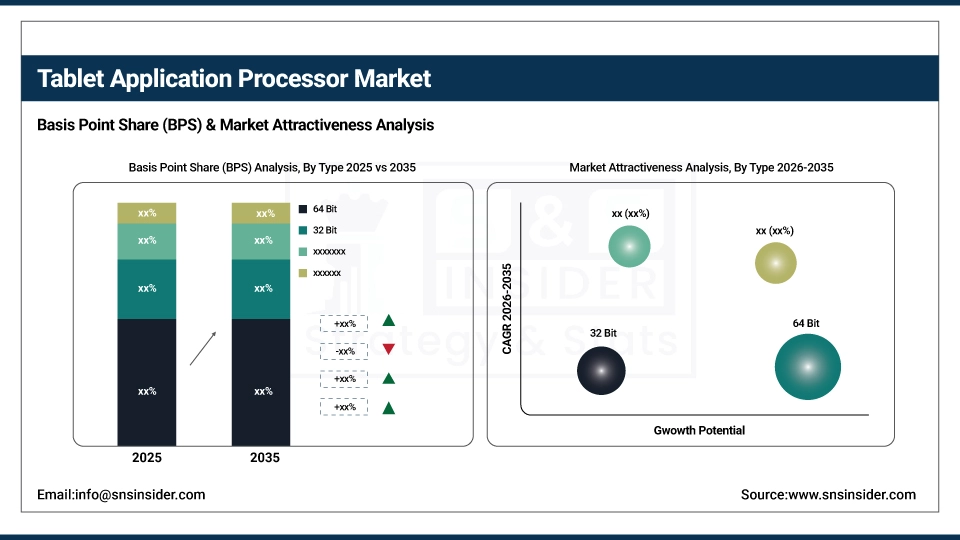
The 64 Bit segment dominated the Tablet Application Processor Market in 2025, capturing around 64.26% of the revenue share because of its higher processing speeds, better treatment of larger working memory, and improved multitasking and advanced-app performance. It is very well suitable for high end gaming, video editing and heavy applications for mobiles which demand high bandwidth. Its compatibility with contemporary OSes and apps is also one of the reasons we believe this slate is going to be successful in both the high-end and the mid-range tablet market.
The 32 Bit segment is projected to grow at the fastest CAGR of approximately 6.99% from 2026 to 2035, due to its ongoing presence in the low-cost segment and the entry-level tablets market. Companies, such as MediaTek are doing another important job here by providing cheap 32 Bit processors for lower end devices and developing markets. The processors aimed at those regions are increasingly chosen to be this class of processor, and potential reasons are lower production costs and good enough performance for running standard tasks mainly browsing the web, streaming video and editing documents.
By Core Type
The Multi-core segment dominated the Tablet Application Processor Market in 2025, accounting for about 66.95% of the revenue share, because it can optimize system efficiency, reduce power consumption and do more tasks at once. One of the brands, a leader in this race is Qualcomm, which is providing more advanced multi-core processors that drive a lot of high-end tablets. These chips are used for demanding uses such as gaming and media editing which has seen the processor’s adoption in high-performance devices and has also driven their market shares.
The Single Core segment is anticipated to grow at the fastest CAGR of approximately 6.67% over 2026-2035, driven by its growing adoption in ultra-price-sensitive and power-efficient tablets. Tablet application processors companies including Allwinner Technology has taken this market, making the small and inexpensive single-core processor, perfect for simple-usage tablets. These chips are well-suited to basic tasks and, as such, one will typically find them powering devices in education, digital signage and point-of-sale, applications in which price and power use are more important than anything.
By Operating System
Apple iOS dominated the Tablet Application Processor Market in 2025, securing around 48.80% of the revenue share, owing to Apple’s powerful ecosystem, upscale product strategy and mature consumers’ base. The company’s in-house chips are also designed specifically for iPads including the Apple M-series chips that power the current iPads and bring unparalleled performance and battery efficiency. Close collaboration between hardware and software makes the user experience smoother and increases the longevity of software updates, and it represents a continuation of Apple's domination of the high-end tablet market.
The Android segment is expected to register the fastest CAGR of approximately 6.69% from 2026 to 2035, as Android has become accessible in all price points of tablets and has penetrated in emerging as well. Top players such as Samsung Electronics are broadening their Android tablet lines with products featuring faster processors for better performance and user- experience. The platform highly flexible with a huge app eco system and appeals to a wide range of device users, thus the consumer and enterprise markets are both growing.
By End User
The Household segment dominated the Tablet Application Processor Market share of about 52.29% in 2025, because tablets are now being used for entertainment, online learning, video streaming, and communication at home. These trends have been accelerated in a generation where everything is available everywhere, and companies such as Amazon exploiting by selling very affordable tablets such as the Fire series, which are large enough to use as a family device. Rising awareness over multifunctional personal devices has bolstered the household sector adoption, thereby further influencing the market statistics.
The Commercial segment is forecasted to grow at the fastest CAGR of around 6.79% over 2026-2035, fueled by growing acceptance of tablets in retail, healthcare, hospitality and logistics. Tablet Application Processors Companies, such as Zebra Technologies are manufacturing business-class tablets with high quality, custom designed processors. Portable, robust & high-quality tablets required for operational activities will drive commercial segment growth in the upcoming years.
Tablet Application Processor Market Regional Analysis:
Asia-Pacific Tablet Application Processor Market Trends:
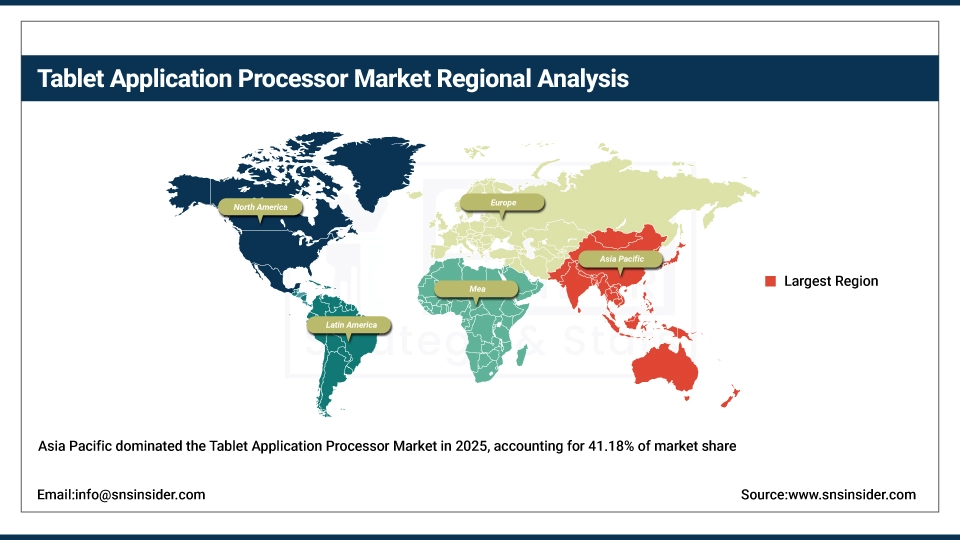
Asia Pacific dominated the Tablet Application Processor Market in 2025, accounting for approximately 41.18% of the total revenue share, due to a strong manufacturing ecosystem, inexpensive labor, and smart-device pervasiveness. The region is home to a number of fast-growing economies with rising disposable incomes and more people getting online (which in turn drives up demand for tablets). The Asia Pacific region is heavily impacted with advanced electronics supply chain and is investing heavily in semiconductor manufacturing resulting in the dominance of the region in the global tablet application processor market.
China leads the Asia Pacific Tablet Application Processor Market on the account of plentiful of manufacturing capacity and domestic demand and all established semiconductor ecosystem. The support of government, workforce abundance, and strong supply chains also bolster its place as the top manufacturing and consumption center.
Get Customized Report as Per Your Business Requirement - Enquiry Now
North America Tablet Application Processor Market Trends:
North America is estimated to witness the highest CAGR of 6.83% during the forecast period 2026-2035 on account of increasing adoption of tablets in sectors including education, healthcare and corporates. The heavy emphasis on technology innovation, digital transformation and the trend toward remote work in the region further drive tablet penetration. Moreover, consumers’ high satisfaction levels with performance and security, and established digital infrastructure are driving the early adoption of high-performance tablet processors across North America.
The U.S. is the largest market for North America Tablet Application Processor Market and is likely to continue its dominance due to massive technology base and high demand for technologically advanced devices among its consumers and R&D. Its market leadership is also supported by a mature digital ecosystem and large industry adoption.
Europe Tablet Application Processor Market Trends:
Europe occupies a considerable share in the Tablet Application Processor Market as there is a surge in the demand for tablets imposed by the sectors, such as education, healthcare, enterprises. High emphasis on innovation, governments encouraging digitalization, and increasing proliferation of connected devices drive the market growth. Furthermore, the emergence of advanced technology centers and increasing consumer inclination toward branded and secure equipment are supplementing the market expansion in the region.
Germany leads the Tablet Application Processor Industry in Europe on account of the well-established infrastructure in the region, increasing implementation of high-end equipment and devices, the presence of developed manufacturing industries, and higher consumer purchasing power.
Latin America and Middle East & Africa Tablet Application Processor Market Trends:
Middle East & Africa region powered by UAE is showing highest growth in Tablet Application Processor Market due to growing public demand for digital services and government initiatives which are driving the demand for tech infrastructure. Likewise in Latin America, led by Brazil, growth continues to come from increased internet penetration, adoption of digital education and rising interest in inexpensive smart devices.
Tablet Application Processor Market Competitive Landscape:
Apple Inc. is a global technology company established in 1976 known for designing innovative consumer electronics, software and services, including iPhone, iPad, Mac, and iOS. Apple leads in performance‑focused processors for mobile and tablet devices and emphasizes seamless user experiences.
- In May 2024, Apple introduced the Apple M4 chip, built on TSMC's 3nm process, which powers the latest iPad Pro models, offering enhanced performance and energy efficiency.
Qualcomm Technologies, Inc. is a leading semiconductor and telecommunications company established in 1985, known for its Snapdragon mobile and tablet processors, 5G solutions, and wireless technologies that power high-performance smartphones and tablets globally.
- In May 2025, Qualcomm's Snapdragon 8cx Gen 3 continues to be a preferred choice for Windows-based tablets, offering robust performance and power efficiency. The company's strategy focuses on delivering flexibility and compatibility across a wide range of devices, essential in the Android tablet market.
Tablet Application Processor Market Key Players:
-
Apple Inc.
-
Qualcomm Technologies, Inc.
-
MediaTek Inc.
-
Samsung Electronics Co., Ltd.
-
Intel Corporation
-
NVIDIA Corporation
-
Advanced Micro Devices, Inc. (AMD)
-
UNISOC
-
Texas Instruments Incorporated
-
Rockchip Electronics Co., Ltd.
-
Broadcom Inc.
-
HiSilicon Technologies Co., Ltd. (Huawei)
-
STMicroelectronics
-
NXP Semiconductors
-
Marvell Technology, Inc.
-
Allwinner Technology Co., Ltd.
-
VIA Technologies, Inc.
-
Cavium, Inc.
-
Infineon Technologies AG
-
Renesas Electronics Corporation
| Report Attributes | Details |
|---|---|
| Market Size in 2025 | USD 22.04 Billion |
| Market Size by 2035 | USD 38.81 Billion |
| CAGR | CAGR of 5.82% From 2026 to 2035 |
| Base Year | 2025 |
| Forecast Period | 2026-2035 |
| Historical Data | 2022-2024 |
| Report Scope & Coverage | Market Size, Segments Analysis, Competitive Landscape, Regional Analysis, DROC & SWOT Analysis, Forecast Outlook |
| Key Segments | • By Type (32 Bit, 64 Bit, Other Types) • By Core Type (Single Core, Multi-core) • By Operating System (Android, Apple iOS, Windows) • By End User (Household, Commercial, Other End Users) |
| Regional Analysis/Coverage | North America (US, Canada), Europe (Germany, UK, France, Italy, Spain, Russia, Poland, Rest of Europe), Asia Pacific (China, India, Japan, South Korea, Australia, ASEAN Countries, Rest of Asia Pacific), Middle East & Africa (UAE, Saudi Arabia, Qatar, South Africa, Rest of Middle East & Africa), Latin America (Brazil, Argentina, Mexico, Colombia, Rest of Latin America). |
| Company Profiles | Apple Inc., Qualcomm Technologies, Inc., MediaTek Inc., Samsung Electronics Co., Ltd., Intel Corporation, NVIDIA Corporation, Advanced Micro Devices, Inc. (AMD), UNISOC, Texas Instruments Incorporated, Rockchip Electronics Co., Ltd., Broadcom Inc., HiSilicon Technologies Co., Ltd. (Huawei), STMicroelectronics, NXP Semiconductors, Marvell Technology, Inc., Allwinner Technology Co., Ltd., VIA Technologies, Inc., Cavium, Inc., Infineon Technologies AG, Renesas Electronics Corporation |
Frequently Asked Questions
Asia Pacific dominated the Tablet Application Processor Market in 2025.
64 Bit segment dominated the Tablet Application Processor Market.
The major growth factor of the Tablet Application Processor Market is the increasing demand for high-performance, energy-efficient tablets across education, enterprise, and consumer electronics sectors.
The Tablet Application Processor Market Size was valued at USD 22.04 billion in 2025 and is expected to reach USD 38.81 billion by 2035
The Tablet Application Processor Market is expected to grow at a CAGR of 5.82 % from 2026-2035.
Get in Touch
