Frame Grabber Market Size & Growth:
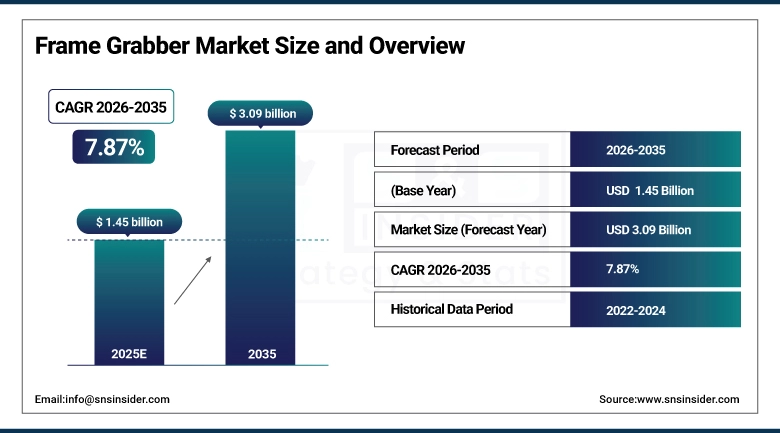
The Frame Grabber Market size was valued at USD 1.45 billion in 2025 and is expected to grow at a CAGR of 7.87% to reach USD 3.09 billion by 2035.
The Frame Grabber Market inspects the Frame Grabber market, giving historical and estimated market insights, segments, market drivers, demand, and geographical landscape. The rising adoption of machine vision systems in manufacturing, logistics, and scientific research industries has emerged as one of the significant machine vision frame grader market growth drivers. As far as the technology for high-speed data transfer and real-time image acquisition is concerned, frame grabbers are being used for automation and inspection systems which is boosting the frame grabber market in developed and developing regions globally.
Over 70% of advanced manufacturing facilities globally now integrate some form of machine vision system.
Market Size and Forecast:
-
Market Size in 2025 USD 1.45 Billion
-
Market Size by 2035 USD 3.09 Billion
-
CAGR of 7.87% From 2026 to 2035
-
Base Year 2025
-
Forecast Period 2026-2035
-
Historical Data 2022-2024
To Get More Information On Frame Grabber Market - Request Free Sample Report
Frame Grabber Market Trends:
• Increasing adoption of high-bandwidth interfaces (CoaXPress, Camera Link HS, and 10GigE/25GigE Vision) in frame grabbers to support ultra-high-resolution and high-frame-rate imaging in smart manufacturing and medical applications.
• Rising integration of AI and edge analytics with frame grabbers, enabling real-time defect detection, pattern recognition, and automated decision-making directly at the inspection point.
• Growing demand for compact, embedded, and PCIe-based frame grabbers that support modular deployment across both small-scale automation setups and large, enterprise manufacturing lines.
• Expanding use of frame grabbers in medical diagnostics and life sciences, driven by growth in endoscopy, digital pathology, robotic surgery, and image-guided clinical workflows.
• Strong focus on low-latency, deterministic image acquisition to support real-time industrial control systems and precision healthcare applications requiring immediate visual feedback.
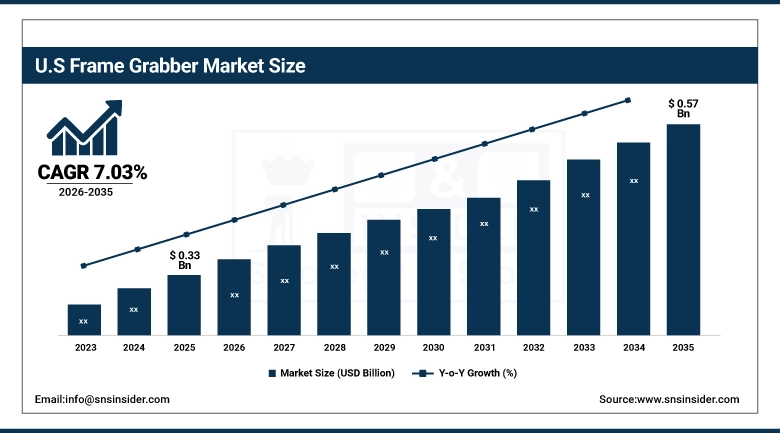
The U.S. Frame Grabber Market size was USD 0.33 billion in 2025 and is expected to reach USD 0.57 billion by 2035, growing at a CAGR of 7.03% over the forecast period of 2026–2035.
In the U.S. market, the growing investment in smart manufacturing, AI-based quality control, and industrial automation are driving steady growth. The demand is further supported by the presence of advanced industries and leading machine vision solution providers. The U.S. leads the global frame grabber market in terms of adoption, high levels of production efficiency, error prevention, and regulatory conformity, which bolster its importance in expanding the overall market.
More than 65% of the U.S.-based electronics and automotive manufacturers utilize machine vision for defect detection.
Over 70% of the U.S. pharmaceutical and medical device manufacturers deploy visual data acquisition tools to meet FDA standards.
Frame Grabber Market Growth Drivers:
Key Drivers:
-
Growing Demand for Automated Inspection and Quality Control Boosts Frame Grabber Adoption in Smart Manufacturing.
Frame grabbers play a key role in line with automation as in automation-driven industries, high-speed image data needs to be processed for analysis and is digitized, and frame grabbers performs this task. In the age of smart factories and Industry 4.0, manufacturers are turning to machine vision for maintaining consistent quality of products, minimal defects, and high throughput. They depend on frame grabbers that provide accurate visual information for automated decision making and detection of faults. The scalability of frame grabbers in industrial automation allows their integration to small-scale systems and enterprise-scale deployments which is one of the primary reasons of their usage in modern quality control ecosystems.
Over 60% of smart factories globally now use machine vision systems with integrated frame grabbers for real-time inspection.
Frame grabber-enabled systems have shown to reduce manufacturing defects by up to 45% in high-volume production lines.
Frame Grabber Market Restraints:
-
Lack of Standardization Between Image Interfaces and Software Hinders Seamless Integration in Vision-Based Systems
The frame grabber market has traditionally faced challenges due to the technological advancements, particularly with respect to the compatibility of various camera types, software platforms, and communication protocols, as well. As such, incorporating frame grabbers into existing industrial or scientific imaging systems typically involves ad-hoc solutions or costly third-party middleware. This absence of common standards makes it difficult to deploy more projects with examples taking longer to set up. This means that potential buyers are not quite ready, as such issues are more evident in multi-vendor environments or legacy systems, which slows down the pace of market growth.
Frame Grabber Market Opportunities:
-
Medical Diagnostics and Life Sciences Emerge as High-Growth Verticals for Frame Grabber Manufacturers’ Integration
The high-speed and high-resolution imaging capabilities provided by frame grabbers have led to their rising demand for use in many biomedical applications, including endoscopy, pathology, and surgical navigation systems. As healthcare continues moving toward image-guided diagnostics and minimally invasive procedures, the demand for quantitative, real-time visual information is only expected to grow. Telehealth advancements and robotic surgery require the precise capture and processing of those data, which frame grabbers allow implementations to do. The emerging cross-market between imaging technology and life sciences indicates unexplored growth opportunities for manufacturers of frame grabbers.
Over 70% of modern endoscopy systems now rely on real-time digital image capture supported by high-speed frame grabbers.
More than 60% of telehealth platforms integrating visual diagnostics rely on high-fidelity, real-time image acquisition technologies.
Frame Grabber Market Segment Analysis:
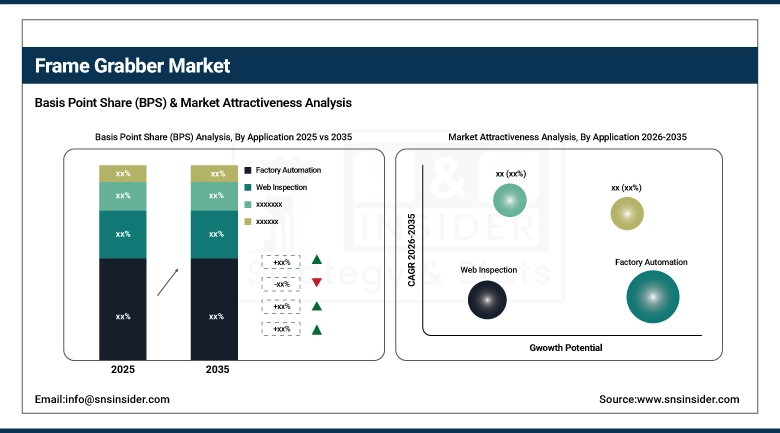
By Application
Factory Automation segment had the largest Frame Grabber market share of approximately 33.07% in 2025, owing to its significant contribution in various mission-critical applications, such as real-time defect detection, robotic guidance, and high-speed production line monitoring. For instance, Teledyne DALSA offers high-performance frame grabbers specifically designed for industrial automation. Frame grabbers have become essential due to high demands for reliable image acquisition in automated manufacturing environments.
Furthermore, Factory Automation is predicted to exhibit the highest compound annual growth rate (CAGR) of approximately 9.01% during the forecast period, over 2026-2035, powered by adoption of Industry 4.0 and AI-enabled machine vision.
By End-User
Manufacturers dominated the Frame Grabber Market in 2025, contributing to 42.5% of the total revenue, as visual inspection systems are being deployed in high volumes in the production line. They improve efficiency, minimize defects, and scale up quality assurance. Major manufacturers in the automotive, electronics, and fast-moving consumer goods (FMCG) sectors offer customized frame grabbers from companies, such as Matrox Imaging. The manufacturers continue to dominate the market by means of the necessity of real-time, high speed data processing.
System Integrators is expected to grow at the fastest CAGR of 8.71% over 2026-2035. Frame grabbers play a key role in a wide range of tasks from logistics and security to medical imaging, providing the integration between hardware and software that integrators need to achieve high performance, expert-secured image data stream and integration process. Able to be scaled up from low volume to high volume production, companies, such as Euresys give integrators lots of options with flexible and programmable frame grabbers. This segment is currently growing the fastest owing to the rise in demand for modular and adaptable systems.
Frame Grabber Market Regional Analysis:
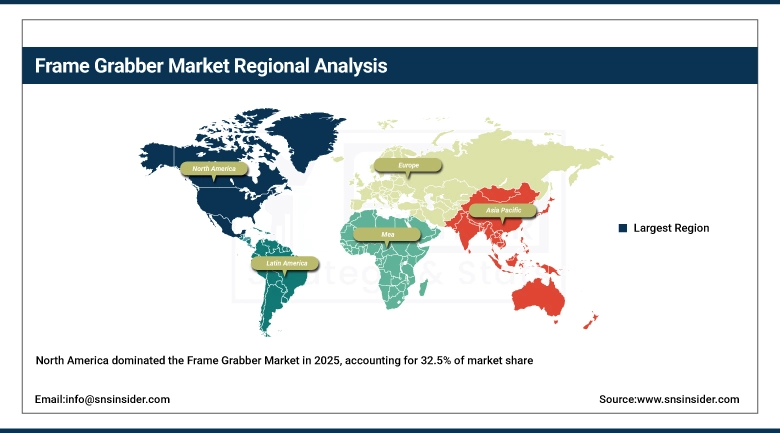
North America Frame Grabber Market Insights
In 2025, North America accounted for largest revenue share of 32.5% in the Frame Grabber Market, due to the early adoption of advanced technologies, presence of machine vision providers and matured automation infrastructure. It is expected that frame grabber demand across important industrial and scientific verticals to be sustained by the region’s focus on high-precision manufacturing, aerospace development, and medical imaging.
-
The U.S. dominates the North American Frame Grabber Market due to its strong industrial automation ecosystem, early adoption of imaging technologies, and presence of major machine vision companies, driving widespread use across manufacturing, defense, aerospace, and medical imaging applications.
Get Customized Report as Per Your Business Requirement - Enquiry Now
Asia Pacific Frame Grabber Market Insights
Asia Pacific is expected to grow at the fastest CAGR of 8.86% over 2026-2035, fueled by rapid industrialization and expanding electronics production. Countries including China, South Korea, and India are heavily investing in smart factories and automation. The region’s growing role in global manufacturing makes it a key emerging hub for frame grabber adoption.
-
China leads the Asia Pacific Frame Grabber Market owing to its vast electronics and automotive manufacturing base, large-scale factory automation initiatives, and strong government support for smart industry transformation, making it the region’s primary hub for machine vision and frame grabber deployment.
Europe Frame Grabber Market Insights
Europe accounts for a prominent share in the Frame Grabber Market led by highly established manufacturing sector, strong automotive and industrial automation domain, and increasing investments in machine vision technologies. Germany, France, and the U.K. are the biggest ones. Strict quality standards and the demand for AI-based inspection systems in factories, laboratories, and transportation infrastructure in the region are also supporting the regional growth of the market.
-
Germany dominates the European Frame Grabber Market due to its advanced industrial automation, strong automotive sector, and widespread adoption of machine vision technologies. Its leadership in smart manufacturing and robotics places it ahead of France, the U.K., Italy, and Spain.
Middle East & Africa (MEA) Frame Grabber Market Insights
The Middle East & Africa is majorly dominated by the UAE as the region is growing rapidly from tech side with more smart infrastructure development and investment in automation technologies. Brazil is the leading industrial automation market in Latin America, due to an expanding automotive and electronics manufacturing sector which results in a higher demand for machine vision and frame grabbers.
Frame Grabber Market Key Players:
Major Key Players in Frame Grabber Companies are Teledyne DALSA, Basler AG, Matrox Imaging, Euresys, Advantech Co., Ltd., National Instruments Corporation, Pleora Technologies, Sensor to Image GmbH, Active Silicon Ltd., and Silicon Software GmbH and others.
Competitive Landscape for Frame Grabber Market:
Zebra Technologies participates in the frame grabber ecosystem through its machine vision and industrial imaging portfolio. The company supports high-speed image acquisition and processing for automated inspection, quality control, and logistics applications, enabling reliable data capture and real-time decision-making in smart manufacturing environments.
-
In March 2024, Zebra Technologies introduced the GevIQ smart NIC frame grabber, enabling GigE Vision acquisition at up to 25 Gb/s per port. This solution offloads packet processing from the CPU, supports 32-camera configurations, and offers standard SFP28 connectors, making high-bandwidth multi-camera setups more flexible and efficient.
Pleora Technologies is a specialized provider of high-performance frame grabber and image connectivity solutions. The company enables low-latency, high-bandwidth image acquisition for industrial automation, medical imaging, and defense applications, supporting standards such as GigE Vision, CoaXPress, and Camera Link for real-time processing.
-
In October 2024, Pleora showcased its Thunderbolt external frame grabber at Vision 2024. This device converts GigE Vision cameras to PCIe via Thunderbolt/USB‑C, delivering up to 22.5 Gbps, lowering CPU load, and enabling compact, embedded host systems.
| Report Attributes | Details |
|---|---|
| Market Size in 2025 | USD 1.45 Billion |
| Market Size by 2035 | USD 3.09 Billion |
| CAGR | CAGR of 7.87% From 2026 to 2035 |
| Base Year | 2025 |
| Forecast Period | 2026-2035 |
| Historical Data | 2021-2024 |
| Report Scope & Coverage | Market Size, Segments Analysis, Competitive Landscape, Regional Analysis, DROC & SWOT Analysis, Forecast Outlook |
| Key Segments | • By Application (Web Inspection, Transportation Safety and maintenance, Scientific, Factory Automation, Industrial Camera Manufacturer, Security) • By End-User (OEMs, Manufacturers, System Integrators) |
| Regional Analysis/Coverage | North America (US, Canada), Europe (Germany, UK, France, Italy, Spain, Russia, Poland, Rest of Europe), Asia Pacific (China, India, Japan, South Korea, Australia, ASEAN Countries, Rest of Asia Pacific), Middle East & Africa (UAE, Saudi Arabia, Qatar, South Africa, Rest of Middle East & Africa), Latin America (Brazil, Argentina, Mexico, Colombia, Rest of Latin America). |
| Company Profiles | Teledyne DALSA, Basler AG, Matrox Imaging, Euresys, Advantech Co., Ltd., National Instruments Corporation, Pleora Technologies, Sensor to Image GmbH, Active Silicon Ltd., Silicon Software GmbH. |
Frequently Asked Questions
North America dominated the Frame Grabber Market in 2025.
The Factory Automation segment dominated the Frame Grabber Market in 2025.
Rising demand for high-resolution, real-time imaging in medical diagnostics, industrial automation, and surveillance drives Frame Grabber market growth.
The Frame Grabber Market size was valued at USD 1.45 billion in 2025 and is expected to grow at a CAGR of 7.87% to reach USD 3.09 billion by 2035.
The Frame Grabber Market is expected to grow at a CAGR of 7.87% from 2026-2035.
Get in Touch
