Glass Lined Equipment Market Report Scope & Overview:
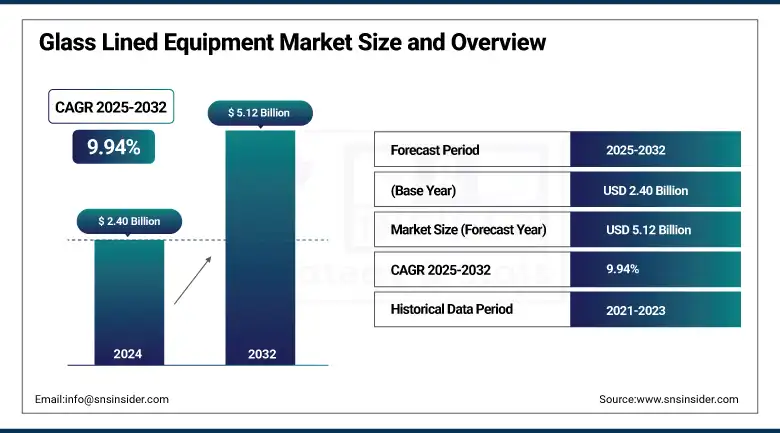
The Glass Lined Equipment Market size was valued at USD 2.40 billion in 2024 and is expected to reach USD 5.12 billion by 2032, growing at a CAGR of 9.94% over the forecast period of 2025-2032.
The glass-lined equipment market growth is driven by the increasing demand from the pharmaceutical, chemical food processing industries. This surge is largely attributed to the enhanced properties of glass-lined technology, which offers superior corrosion resistance, chemical inertness, and greater compliance with high-level safety and environmental consumption standards. Developments in this field have made glass reactors more efficient and durable, transforming equipment performance and expanding the applicability scope of glass-lined vessels across various industries. All these innovations are effectively reengineering operational efficiencies and reducing downtimes through the introduction of advanced features like self-repairing and self-cleaning surfaces, smarter agitator designs, and the integration of AI and automation to predict and automatically correct faults and hazards.
To Get more information On Glass Lined Equipment Market - Request Free Sample Report
The expanding pharmaceutical & specialty chemical industry, notably in developing regions like Asia-Pacific, is expected to supplement the growth of the market. Thus, it is evident from all of these that the economic significance of site-specific manufacturing hubs nearer to local demand is validated globally, with the coming up of manufacturing clusters like this Hyderabad Pharma City in India. In reaction to the demand for high-purity and low contamination equipment and material systems new greenfield investments and expansions of existing capacity in the industry are being targeted. However, it is also burdened with high start-up expense and operational complexity. Accordingly, businesses are prioritizing on R&D to ensure cost effective and long-lasting potable water solutions and are evaluating collaborations to leverage upon technology innovations.
In March 2024, PFG Glasskem Inc. showcased its innovative glass-lined reactors at the ChemTECH World Expo 2024 in Mumbai, highlighting advancements in corrosion resistance and operational safety for the chemical and pharmaceutical industries.
Glass Lined Equipment Market Dynamics
Drivers
-
Technological Advancements Driving Efficiency, Expansion, and Sustainability in Glass-Lined Equipment and Manufacturing
Innovations in technology will enhance the performance and efficiency of glass-lined equipment and widen their availability in years to come. Technologies pertaining to glass-lining procedures have improved equipment thermal resistance and chemical stability, along with bolstering stability. Operational efficiency and predictive maintenance functions are being optimized with automation; and AI and IoT are driving the digitalization of maintenance and managing critical asset functions. These developments are opening glass-lined equipment to a broader and wider variety of industries.
For instance, Piramal Glass has implemented a real-time manufacturing insights (RTMI) system using IoT sensors and Azure IoT Hub, enabling real-time monitoring and analysis of production lines. This system has led to a 25% improvement in employee productivity and a 5% reduction in defects.
In addition, the integration of AI and deep learning technologies is enhancing the efficiency and simplicity of manufacturing processes in flat glass. These technologies enable faster and more precise analyses of complex data in order to make fewer mistakes, reduce downtime, and save energy.
Restraint
-
Fragility of Glass-Lined Equipment Driving the Need for Strict Handling and Maintenance Protocols
Glass-lined equipment is known for its outstanding corrosion resistance properties and chemical inertness, but they are severely troubled by fragility and durability. Due to mechanical loading such as impacts from falling heavy objects or improper handling during maintenance, glass linings are liable to crack or chip. Thermal shock resulting from rapid temperature changes can create glass breaks, especially at weld joints or areas in which thermal expansion compatibility is poorly matched. In addition, chemical corrosion, despite the glass layer, will still slowly corrode the lining over time. These weaknesses call for stringent handling procedures, frequent inspections, and adherence to operating guidelines if one wishes to prevent damage and stay within the lifetime of glass-lined equipment in an industrial process.
For Instance, A European chemical plant experienced significant damage to its glass-lined agitators due to mechanical shocks. The incident underscored the susceptibility of glass-lined equipment to physical impacts, leading to operational disruptions and highlighting the need for improved handling and maintenance practices to mitigate such risks.
Glass Lined Equipment Market Segmentation Analysis
By Product
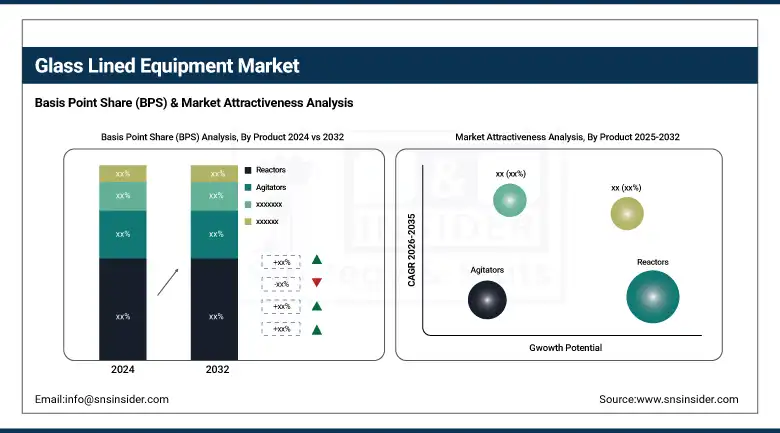
The reactors segment dominated the market and accounted for 42% of the glass-lined equipment market share in 2024. The reactors that occupy this central role in industries from chemicals and pharmaceuticals to food processing, also account for this leadership. Glass-lined reactors are preferred as they are corrosion-resistant, easy to clean, and heat-resistant, allowing them to be used for reactions with highly acidic or alkaline chemicals. Increased demand in these sectors for safe, effective, and reliable reactors further expands their market share, solidifying their position as the largest segment in the global glass-lined equipment market.
Agitators are the most rapidly growing segment within the glass lined equipment market due to the increasing requirement from all segments of industry (pharmaceutical, chemical, food processing). It enhances mixing efficiency and ensures uniform reactions, making it essential for processes that demand precise control over fluid dynamics. Also, the major drivers in the market are the technology enhancements through which the agitators are becoming highly powerful, efficient and adaptable for many different applications. The high rate of adoption for agitators in various industrial applications is due to the increasing focus on improving product quality, the operating expenditure reduction and ensuring consistency.
By End-Use
The chemicals segment dominated the market and accounted for 48% of glass glass-lined equipment market share. Such applications arise because of the number of glass-lined equipment employed in the chemical industry, where they are needed in processes that involve the use of corrosive materials and high-temperature reactions. Glass-lined equipment is more resistant to chemical reactions, corrosion, and abrasion than any other form of equipment, making it ideal for use in the production of acids, alkalis, and other chemicals. Due to which it does not react, it is easy to clean, and its durability is the reason why it captivates storage tanks and is considered to be a market leader in the chemical processing plants.
The pharmaceuticals segment of the Glass Lined Equipment Market is anticipated to be the fastest-growing segment due to increasing usage of glass-lined equipment in the drug manufacturing process as they provide high-quality and corrosion-resistant equipment. In the pharmaceutical industry, processes require high protective characteristics such as strict hygiene, controlled temperature, and protection against aggressive chemicals, which highlights the importance of glass-lined equipment. Rising global health demands link to drug production, and the thirst for superior drug production systems has spurred the global demand for glass-lined vessels, tanks, and reactors even more. The well-established pharmaceutical industry is leaping ahead with the wheels arriving in terms of new drugs and treatments; thus this segment can be expected to continue its impressive growth.
Glass Lined Equipment Market Regional Outlook
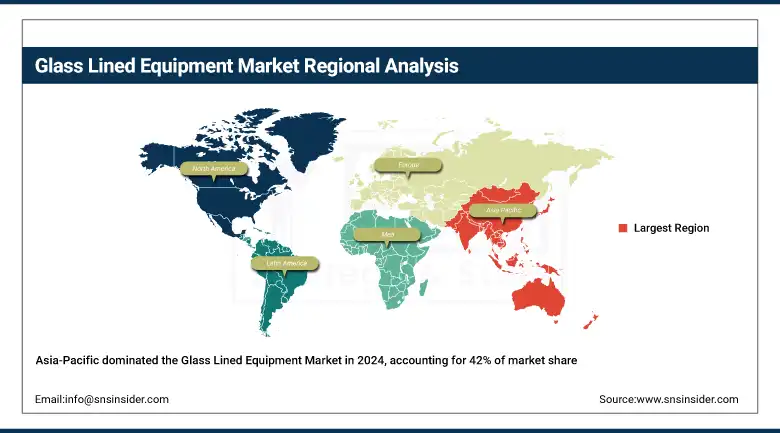
Asia-Pacific held the dominant position in the global glass-lined equipment market, accounting for 42% in 2024. This is primarily due to the large production industries for chemicals and pharmaceuticals in the region, particularly in fast-industrializing nations such as China and India. A huge investment in process industries, coupled with progressive government policies and rising domestic demand have propelled investments in these countries. In addition, the presence of a sufficient number of factories and low–cost labor make this region also strong in terms of market.
Get Customized Report as per Your Business Requirement - Enquiry Now
China and India have been the growing countries for glass lined equipment on account of huge demand from chemical and pharmaceutical industries there. Widespread manufacturing capability and government incentives position China for the lead, while a growing pharma industry and business climate fuel India. This trend is expected to continue, with both countries remaining the market leaders due to ongoing industrial growth coupled with rising domestic consumption
Europe becoming the fastest-growing market in the glass-lined equipment sector due to a rush of investments centered on green chemical processing technologies. Rapid adoption of green manufacturing in the region is a direct result of stringent legislation to reduce your carbon emission and provide for cleaner workplace. These regulatory conditions have amplified the demand for complex, corrosion-resistant equipment including glass-lined reactors and storage vessels.
North America accounted for a substantial share in the glass-lined equipment market due to the base of well-established end-use industries like pharmaceuticals, chemicals, and food processing. It is backed by modern manufacturing capability and a solid research & development focus that delivers innovative and effective equipment. In addition to this, robust regulatory standards about safety and quality have compelled industries to make investments in glass-lined equipment, which is highly durable and resistant to corrosion. The U.S. and Canada, specifically, are major contributors to the same owing to their sturdy industrial setup and increasing requirement of specialist equipment across various high-precision application areas.
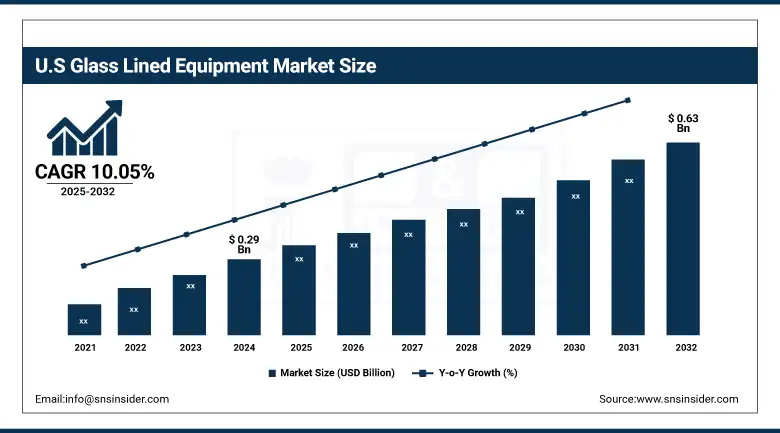
The U.S. market was valued at USD 0.29 billion in 2024 and is expected to reach USD 0.63 billion by 2032, growing at a CAGR of 10.05%. Growth is largely supported by rising demand from various end-use industries including pharmaceutical, chemical and food among others, where corrosion resistance and hygiene is crucial. The uptake is also driven by regulatory requirements and process safety.
The glass lined equipment market is witnessing robust growth in the Middle East & Africa (MEA) and Latin America. While countries like Brazil see increasing demand driven by the pharmaceutical and chemical sector, this also follows from industrial growth and as part of the modernization process in Latin America. The MEA region is also on the rise, with rapid industrialization and a boom in infrastructure development, spearheaded by the GCC (Gulf Cooperation Council) countries. The economic diversification initiatives in these countries are reviving the demand for durable, corrosion-resistant machinery.
Glass Lined Equipment Market Key players are:
Glass lined equipment companies include SACHIN INDUSTRIES LTD., Standard Group of Companies Ltd, Jiangsu Yangyang Chemical Equipments Manufacture Co., Ltd, HLE Glascoat, THALETEC, Zibo Taiji Industrial Enamel Co., Ltd, 3V Tech S.p.A., SGT Glass-Lined Equipment Co., Ltd, Büchiglasuster, and GMM Pfaudler.
Recent Development
-
In March 2024: Zibo Taiji Industrial Enamel Co., Ltd successfully developed a 135,000-liter large-scale enamel glass equipment, which received high recognition from a key customer for its advanced performance and quality.
-
In October 2024: Zibo Taiji completed the construction of the "Taiji Special Material Equipment Factory," boosting its capability to produce GMP-compliant stainless steel enamel equipment and other specialty materials.
| Report Attributes | Details |
|---|---|
| Market Size in 2024 | USD 2.40 Billion |
| Market Size by 2032 | USD 5.12 Billion |
| CAGR | CAGR of 9.95% From 2025 to 2032 |
| Base Year | 2024 |
| Forecast Period | 2025-2032 |
| Historical Data | 2021-2023 |
| Report Scope & Coverage | Market Size, Segments Analysis, Competitive Landscape, Regional Analysis, DROC & SWOT Analysis, Forecast Outlook |
| Key Segments | • By Product (Reactors, Agitators, Heat Exchangers, Storage Tanks, Others) • By End-use (Pharmaceuticals, Chemicals, Agriculture, Food & Beverage, Others) |
| Regional Analysis/Coverage | North America (US, Canada, Mexico), Europe (Germany, France, UK, Italy, Spain, Poland, Turkey, Rest of Europe), Asia Pacific (China, India, Japan, South Korea, Singapore, Australia, Rest of Asia Pacific), Middle East & Africa (UAE, Saudi Arabia, Qatar, South Africa, Rest of Middle East & Africa), Latin America (Brazil, Argentina, Rest of Latin America) |
| Company Profiles | SACHIN INDUSTRIES LTD., Standard Group of Companies Ltd, Jiangsu Yangyang Chemical Equipments Manufacture Co., Ltd, HLE Glascoat, THALETEC, Zibo Taiji Industrial Enamel Co., Ltd, 3V Tech S.p.A., SGT Glass-Lined Equipment Co., Ltd, Büchiglasuster, GMM Pfaudler. |
Get in Touch
